Open Access
Research article
Putative psychosis genes in the prefrontal cortex: combined analysis
of gene expression microarrays
Kwang Ho Choi*
1, Michael Elashoff
2, Brandon W Higgs
2, Jonathan Song
1,
Sanghyeon Kim
1, Sarven Sabunciyan
3, Suad Diglisic
1, Robert H Yolken
3,
Michael B Knable
4, E Fuller Torrey
4and Maree J Webster
1Address: 1Stanley Laboratory of Brain Research, 9800 Medical Center Dr. Bldg 2C, Rockville, MD 20850, USA, 2Elashoff Consulting, Redwood City, CA 94065, USA, 3Stanley Laboratory of Developmental Neurovirology, Johns Hopkins University, School of Medicine, 600 North Wolfe Street, Blalock 1105, Baltimore, MD 21287, USA and 4Stanley Medical Research Institute, 8401 Connecticut Ave, Suite 200, Chevy Chase, MD 20815, USA
Email: Kwang Ho Choi* - choik@stanleyresearch.org; Michael Elashoff - mike@elashoffconsulting.com;
Brandon W Higgs - brandon@elashoffconsulting.com; Jonathan Song - sjonathan@comcast.net; Sanghyeon Kim - kims@stanleyresearch.org; Sarven Sabunciyan - ssabunc1@jhmi.edu; Suad Diglisic - diglisics@stanleyresearch.org; Robert H Yolken - rhyolken@aol.com;
Michael B Knable - knablem@stanleyresearch.org; E Fuller Torrey - torreyf@stanleyresearch.org; Maree J Webster - websterm@stanleyresearch.org
* Corresponding author
Abstract
Background: Recent studies have shown similarities between schizophrenia and bipolar disorder in phenotypes and in genotypes, and those studies have contributed to an ongoing re-evaluation of the traditional dichotomy between schizophrenia and bipolar disorder. Bipolar disorder with psychotic features may be closely related to schizophrenia and therefore, psychosis may be an alternative phenotype compared to the traditional diagnosis categories.
Methods: We performed a cross-study analysis of 7 gene expression microarrays that include both psychosis and non-psychosis subjects. These studies include over 400 microarray samples (163 individual subjects) on 3 different Affymetrix microarray platforms.
Results: We found that 110 transcripts are differentially regulated (p < 0.001) in psychosis after adjusting for confounding variables with a multiple regression model. Using a quantitative PCR, we validated a set of genes such as up-regulated metallothioneins (MT1E, MT1F, MT1H, MT1K, MT1X, MT2A and MT3) and down-regulated neuropeptides (SST, TAC1 and NPY) in the dorsolateral prefrontal cortex of psychosis patients.
Conclusion: This study demonstrates the advantages of cross-study analysis in detecting consensus changes in gene expression across multiple microarray studies. Differential gene expression between individuals with and without psychosis suggests that psychosis may be a useful phenotypic variable to complement the traditional diagnosis categories.
Published: 7 November 2008
BMC Psychiatry 2008, 8:87 doi:10.1186/1471-244X-8-87
Received: 29 May 2008 Accepted: 7 November 2008
This article is available from: http://www.biomedcentral.com/1471-244X/8/87 © 2008 Choi et al; licensee BioMed Central Ltd.
Background
Kraepelin's 1896 dichotomous classification of functional psychoses into dementia praecox (schizophrenia) and manic-depressive insanity (bipolar disorder) is well known and has dominated most diagnostic systems in psychiatry. Less well known is the fact that two decades later, Kraepelin himself questioned the validity of his clas-sificatory system, noting that "it is becoming increasingly clear that we cannot distinguish satisfactorily between these two illnesses and this brings home the suspicion that our formulation of the problem may be incorrect." [1,2] In recent years, increasing number of observers have shared Kraepelin's doubts, with some proposing instead a continuum hypothesis [3,4]. Clinically, there is much overlap of symptoms, and the intermediate category of schizoaffective disorder may imply an artificial preserva-tion of the dichotomy between these two diagnoses [5]. The clinical gulf between individuals with bipolar II and those with bipolar I with psychotic features is marked, whereas the latter often resemble individuals with schizo-phrenia quite closely. Epidemiologically, there is also some overlap, especially in so far as both have a winter-spring seasonal birth excess [6,7].
Genetically, it has been said that "accumulating evidence supports the existence of an overlap in genetic susceptibil-ity across the traditional Kraepelinian divide" [8]; this has been reported for family studies, linkage studies, and can-didate genes such as G72, NRG1, dysbindin, COMT, BDNF, and DISC1 [9-12]. An overlap for some neuropsy-chological dysfunctions, such as working memory [13], has also been reported, although individuals with bipolar disorder are less severely impaired [14]. This suggests that working memory dysfunction may be closely related to psychotic features in individuals with schizophrenia and with bipolar disorder.
Neuropathologically, an overlap in findings between schizophrenia and bipolar disorder has also been noted, both neurochemically [15] and structurally [16]. As was true for the neuropsychology findings, individuals with bipolar disorder are structurally less severely impaired. Neuropathological studies that have divided bipolar patients into those with and without psychotic features have reported that the former are more closely related to schizophrenia than the latter [17]. This last observation suggests that an important variable in categorizing seri-ously mentally ill individuals may be the presence or absence of psychotic features. To date, most studies of gene expression in schizophrenia and bipolar disorder have used the traditional Kraepelinian classification. We, therefore, decided to reanalyze a set of microarray studies, dividing the individuals within each study into those with and without psychotic features.
Although genome-wide expression studies of psychiatric disorders have been published, there have been inconsist-ent findings among previous studies possibly due to sev-eral factors including: relatively small sample sizes, inappropriate p-value and fold change criteria, and failure to adjust for potential confounding variables. In order to address these issues, we performed a cross-study analysis of 7 microarray datasets using the subjects with and with-out psychotic features from the two post-mortem brain collections of the Stanley Medical Research Institute (SMRI). The microarray datasets of the prefrontal cortex with three Affymetrix platforms (hgu133A, hgu133 2.0+ and hgu95Av2) were used for this cross-study analysis.
Methods
Post-mortem brain tissues
Two post-mortem brain collections from the SMRI have been made available to researchers worldwide. The first, the Neuropathology Consortium, has 60 individual sub-jects, with multiple brain regions per subject. The details of the sample collection have been described previously [18]. Notable exclusion criteria include: age>65 years, poor quality mRNA, and significant structural brain pathology on post-mortem examination. These samples are matched for age, gender, race, pH, post-mortem inter-val (PMI), side of the brain and mRNA quality. For micro-array studies using this collection, tissue samples from the prefrontal cortex (Brodmann area 46/10, 6 and 8/9) were provided to individual investigators, who then performed the RNA extraction and experiment.
The second, the Array Collection, consists of 105 individ-ual subjects, with multiple brain regions per subject. Exclusion criteria are similar to those for the Neuropathol-ogy Consortium. For this collection, dorsolateral prefron-tal cortex (Brodmann area 46) was used for the microarrays. In contrast to the Neuropathology Consor-tium, the SMRI performed the RNA extraction for the Array Collection tissues. Briefly, tissue was homogenized in Trizol; nucleic acid was separated with chloroform at high speed centrifugation; and RNA was then precipitated with isopropyl alcohol and washed with 70% alcohol. Pellets of RNA were resuspended in DEPC water. The quality of RNA was assessed using an Agilent bioanalyzer 2100 (Agilent, Foster City, CA). RNA processing and microarray data generation was performed by the individ-ual investigators at their own facilities. RNA processing protocols were generally those recommended by the Affymetrix microarray manufacturer.
82) included those with bipolar without psychotic fea-tures, those with depression, and the unaffected controls. Two cases with bipolar disorder were excluded due to insufficient information on psychotic features.
Quality control of microarray data
All microarray raw data (cel files) were transformed using the Robust Multichip Average (RMA) normalization algo-rithm. The importance of quality control (QC) measures in microarray studies, including pre-chip (RNA quality of samples) and post-chip outcomes of the data, has been described previously [19]. We have performed a series of QC analyses to identify and remove microarray chip out-liers before conducting statistical analysis on individual studies and on combined studies. Detailed QC procedures are described in our previous publications [20,21]. Briefly, each microarray chip was subjected to Affymetrix QC met-rics for chip-level parameters such as scale factor, probe perfect match/mismatch difference counts, percent present calls, control gene (GAPDH and beta-actin) 5'/3' ratios and average correlation with respect to the reference distribution for those parameters across the arrays. Although no hard cutoffs were applied for each of the QC metrics, we examined the distribution of the metrics to determine whether samples appeared to be outliers.
Analysis of microarray studies
The cross-study analysis includes 7 Affymetrix microarrays that were completed and provided to the SMRI from each investigator. The studies were coded as 1, 2, 3, 4, 5, 7 and 14 for the purpose of cross-study analysis to focus on the overall results and findings of the larger investigation, and also for the consistency with the SMRI online genomics database http://www.stanleygenomics.org. Names of the investigators involved in microarray studies are as follows: Study 1: Altar A, Study 2: Altar C, Study 3: Bahn, Study 4: Chen, Study 5: Dobrin, Study 7: Kato, Study 14: Sklar A.
It is important to note that studies based on a common brain collection will have overlap in terms of subjects, thus the combined analysis on these studies are not com-pletely independent. As a result, the degrees of freedom (df) can be over-estimated and the resulting p-values may be insufficiently stringent. In order to adjust for this lack of independence, a permutation method was used to identify a correction factor that adjusts the naïve df for the calculated p-value to a lower value (and subsequently higher p-value) at the point where the percentage of dif-ferentially expressed genes is equal to the selected alpha level (i.e. 5% differentially expressed genes found at p < 0.05) based on random data. This method used 7 micro-array studies where both individual and cross-study anal-yses were computed for each iteration, for 100 total iterations, similar to our previous study [21].
For each iteration, the columns of each of 7 microarray data matrices were randomly shuffled to remove class memberships. Then, both individual study and cross-study analyses were computed on these permuted studies. Next, we calculated the cross-study p-values for the genes using df correction factor values starting at 0 and going up to 8 by increments of 0.2. For example, if the naïve df for gene X is 5, then using a correction value of 1.2, the adjusted df would be 3.8 and the adjusted p-value is cal-culated using this adjusted df. The number of genes at p < 0.05 was summated using each incremental df correction factor for 100 total permutations and the df (based on the naïve df minus the correction factor) that provided a median of 5% of the genes (p < 0.05) was selected. Genes where the difference between the naïve df and the correc-tion factor was less than or equal to 0 were not counted in the gene percentages. This selected correction factor was then applied to the naïve df for each gene in the original data to provide adjusted p-values for each gene. We acknowledge the dependency between these studies where certain subjects are shared; however, after correct-ing for this over-estimated df, we found that our results are more powered to demonstrate consensus fold changes as compared to a single study.
Individual study analysis
First, each demographic and clinical variable was assessed using a multiple regression model within each study. We identified probe sets that were significantly correlated with individual variables, where significance was defined as p < 0.01 and fold change >1.3 (the criteria that widely used in the previous brain microarray studies). For com-parison of effect sizes, all demographics were analyzed using two levels. Continuous variables and ordered cate-gorical variables were cut at values as close as possible to the median (e.g. continuous: PMI>30 vs. PMI<30; cate-gorical: Heavy drug use vs. All lower levels of drug use) for the regression analysis. Demographic variables were assessed using both non-psychotic controls and psychosis subjects, while disease-specific variables were analyzed within the disease group to avoid the confounding of demographic effects and disease effects.
or markers indicative of disease between the psychosis subjects and non-psychotic controls. The multiple regres-sion analysis provided an adjusted fold change, standard error (SE), and p-value for each gene in each study.
Cross-study analysis
The cross-study comparisons are based on scaled repre-sentations of individual study-level analysis across studies to extract the biological patterns and relationships. For the gene level analysis, consensus fold change was calculated for each gene based on a weighted combination of the individual fold changes and the SEs for the Affymetrix probe sets that map to each gene across the studies. Weights were determined in a probe set specific manner to account for the different levels of precision associated with each probe set that map to a given gene across the platforms. The weights were equal to 1/SEi, where SEi is the standard error of the ith probe set for the gene across all the studies. For the Gene Ontology (GO) analysis, GO association to disease was tested using a Fisher's Exact test (p < 0.05), based on the number of significantly regulated genes from the cross-study analysis within each GO term. Each GO term with number of genes between 10 and 500 were retained in the cross-study analysis. Additional infor-mation about cross-study analysis can be found at the SMRI online genomics database http://www.stanleygen omics.org/cross.html. The false discovery rate (FDR) was calculated based on the ratio of expected number of genes by chance at the specific p-value threshold (e.g. at p = 0.0001 and 19,502 genes = expect 2 genes by chance) divided by the sum of the expected number of genes by chance and the actual number of genes obtained at that threshold.
Bioinformatics mappings
NCBI's Database for Annotation, Visualization and Inte-grated Discovery (DAVID 2007) was used as the standard source for gene annotation information [22]. The primary fields extracted from the DAVID include: Entrez ID, gene symbol, gene name and gene summary. Additional anno-tations include gene product mappings to the GO Consor-tium for the GO terms/classes. For microarrays, queries were based on the Affymetrix probe set ID (AFFYID).
Real-time quantitative PCR
Total RNA was extracted from the dorsolateral prefrontal cortex tissues (BA46) of the Array Collection (psychosis N = 56, non-psychosis N = 49). RNA was further purified with the PureLink Micro to Midi Total RNA Purification System (Invitrogen, Carlsbad, CA) and the quality of RNA was assessed with the Bioanalyzer 2100 (Agilent, Foster City, CA). cDNA was synthesized with RT-PCR using oligo dT primers (Super Script III, Invitrogen, Carlsbad, CA). For real-time PCR, 1 μl aliquots of validated QuantiTect SYBR primer (Qiagen, Valencia, CA), 10 μl qPCR Master
mix (Applied Biosystems, Foster City, CA), and 10 μl diluted cDNA were mixed together and pipetted into sin-gle wells of the qPCR plate (384-well format) with the Prism7900HT Sequence Detection System (Applied Bio-systems, Foster City, CA). For no template controls for each gene tested, water was added instead of the cDNA. Thermo cycle conditions were: (1) 1 cycle for 2 min at 50°C, (2) 1 cycle for 15 min at 95°C, and (3) 40 cycles for 15 sec at 95°C and 1 min at 60°C and fluorescence was measured during the 60°C step for each cycle as recom-mended by the manufacturer. Reactions were quantified by the delta delta cycle threshold (Ct) method using SDS2.2 software (Applied Biosystems, Foster City, CA) generating a mean quantity value (Qty mean) for each sample from the triplicates of that sample for each gene. Recent studies have shown an advantage of using multiple endogenous control genes for the qPCR experiment [23], and therefore we used three endogenous control genes including β-2 microglobulin (B2M), glyceraldehyde-3-phosphate dehydrogenase (GAPDH) and β-actin (ACTB) in the qPCR experiment. The data for each gene of interest was expressed as Qty mean for the gene of interest/geo-metric mean of Qty mean values for the three endogenous control genes. Normalized values were then expressed as fold changes between the psychosis and the non-psycho-sis control group.
Results
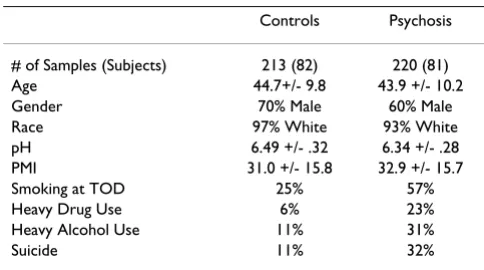
A summary of subject characteristics in 7 microarray stud-ies is shown in Table 1. There were no significant differ-ences in age, gender, race, brain pH and PMI between the psychosis and the non-psychosis group; this is important since these demographic and post-mortem variables appear to influence gene expression in the post-mortem brains. The psychosis subjects had a higher incidence of smoking at time of death, heavy drug use, heavy alcohol use, and suicide status compared to the non-psychosis controls, and these factors tend to be associated with
psy-Table 1: Summary of subject characteristics in the studies included in the cross-study analysis of psychosis
Controls Psychosis
# of Samples (Subjects) 213 (82) 220 (81) Age 44.7+/- 9.8 43.9 +/- 10.2
Gender 70% Male 60% Male
Race 97% White 93% White
pH 6.49 +/- .32 6.34 +/- .28 PMI 31.0 +/- 15.8 32.9 +/- 15.7
Smoking at TOD 25% 57%
Heavy Drug Use 6% 23%
Heavy Alcohol Use 11% 31%
Suicide 11% 32%
[image:4.612.312.554.575.710.2]chotic features. Therefore, these psychosis-specific varia-bles were included in the following demographic analysis.
Table 2 represents the characteristics of individual studies, including the number of samples, brain collection, brain region, Affymetrix platform and number of probe sets in each study. Four studies (Study ID 1, 3, 5 and 7) used the Array Collection and three studies (Study ID 2, 4 and 14) used the Neuropathology Consortium. Note that total number of samples included in each study vary from 26 to 86. This is due to the availability of microarray raw data from each study and also due to the removal of poor qual-ity arrays based on the QC analysis. Removal of microar-ray outliers was carried out before statistical analysis of individual and combined study analyses. Nonetheless, we validated a set of genes with the qPCR using a complete set of dorsolateral PFC tissues (N = 105) from the Array Collection.
As an initial comparison across individual studies prior to the cross-study analysis, we used the significance criteria (p < 0.01 and fold change>1.3) that had been widely used in the previous microarray studies. The percentage of genes regulated by individual factors within each study is shown in Table 3. The median percentage of genes signif-icantly regulated in psychosis is 0.62%, indicating the sec-ond highest percentage of genes significantly regulated. Brain pH was the most influential factor for gene expres-sion with the median percentage of 1.28%. Other factors, including PMI (0.13%), heavy alcohol use (0.27%), antipsychotic use (0.28%) and lithium use (0.22%), also showed comparable number of gene expression changes in this analysis.
Following the analyses on individual studies, we per-formed cross-study analysis to identify a list of discrimi-nating genes in psychosis. Table 4 represents the summary results of the cross-study analysis including fold changes
and p-values for all genes. Most genes showed small fold changes (less than 1.3) in this analysis. The cumulative FDR analysis indicates that a p-value cutoff of 0.001 would maximize the number of genes while keeping the FDR relatively low (14%). For example, 110 genes showed a highly significant change at p < 0.001 (see Addi-tional file 1). The number of genes found to be differen-tially expressed while maintaining a relatively low FDR illustrates the robust expression differences between indi-viduals with and without psychosis.
From the cross-study analysis, we have identified the genes that are differentially regulated in psychosis com-pared to non-psychosis using a relatively large fold change and moderate p-value threshold (p < 0.05). Such guide-lines have been suggested by the MicroArray Quality Con-trol (MAQC) I project to maximize reproducibility of differential expression across platforms [24]. Addition-ally, large fold change magnitudes are preferred for valida-tion purposes on an alternative platform such as qPCR. Among differentially regulated genes, a set of metal-lothionein genes are consistently up-regulated across the studies (Figure 1). The p-values and fold changes for the genes are MT1E (p = 0.002, FC 1.22), MT1F (p = 0.00005, FC 1.1), MT1K (p = 0.027, FC 1.26) and MT1X (p = 0.0001, FC 1.31). As shown at the bottom of each graph, the combined analysis with weighted fold change and 95% confidence intervals indicates significant expression changes. For instance, MT1F gene is not significant in most individual studies, however, the combined analysis clearly shows that MT1F gene is significantly up-regulated because of the increased power to detect small but consist-ent changes across multiple studies (Figure 1B).
[image:5.612.51.560.560.719.2]Down-regulated genes in psychosis include several neu-ropeptide genes (Figure 2). The p-values and fold changes for the genes are somatostatin (SST) (p = 0.038, FC -1.17), Tachykinin precursor 1 (TAC1) (p = 0.04, FC -1.17), and
Table 2: Summary of the seven microarray studies included in the cross-study analysis of psychosis
Study ID Samples Controls Psychosis Collection* Region Array Type Probesets
1 81 38 43 A Frontal
BA46
Affy hgu133A 22283
2 55 30 25 C Frontal BA46/10 Affy hgu133A 22283
3 86 42 44 A Frontal
BA46
Affy hgu133A 22283
4 26 16 10 C Frontal
BA6
Affy hgu133 2.0+ 54681
5 73 35 38 A Frontal
BA46
Affy hgu133 2.0+ 54681
7 81 35 46 A Frontal
BA46
Affy hgu133A 22283
14 31 17 14 C Frontal
BA8/9
Affy Hgu95Av2 12453
neuropeptide Y (NPY) (p = 0.05, FC -1.09). A nuclear receptor subfamily 4, group A, member 2 (NR4A2) gene was also down-regulated (p = 0.00001, FC -1.16) in psy-chosis. This gene has been implicated in psychiatric disor-ders including schizophrenia and bipolar disorder. Most individual studies show consistent down-regulation of NR4A2 gene, except the study 4, and the combined anal-ysis at the bottom indicates that NR4A2 gene is signifi-cantly down-regulated in psychosis (Figure 2D).
The GO analysis of metal ion binding function is shown in Figure 3. The metallothionein genes including MT1E (p = 0.002, FC 1.22), MT1F (p < 0.0001, FC 1.1), MT1H (p = 0.007, FC 1.14), MT1K (p = 0.027, FC 1.26), MT1X (p = 0.0001, FC 1.31), MT2A (p = 0.023, FC 1.16), and MT3 (p = 0.001, FC 1.08) are constantly up-regulated as com-pared to other genes associated with the metal ion bind-ing function. Metal ion bindbind-ing was found to be among
the top 9 GO terms significantly regulated in the cross-study analysis of psychosis (p = 0.01) and was chosen to highlight based on the robust and consistent changes in a shared gene group (i.e. metallothionein genes). Addi-tional significant GO terms include: regulation of cell growth (p = 0.001), negative regulation of transcription from Pol II promoter (p = 0.003), voltage-gated potas-sium channel activity (p = 0.005), metabolism (p = 0.006), translational elongation (p = 0.006), learning and/or memory (p = 0.006), WNT receptor signaling pathway (p = 0.008), and glutathione transferase activity (p = 0.009) (see Additional file 2).
[image:6.612.54.565.99.296.2]Following the cross-study analysis of microarrays, we per-formed a qPCR experiment to validate gene expression changes that we observed in microarrays (Figure 4). We confirmed differential expression of metallothionein genes including MT1X (p = 0.001, FC 1.64), MT2A (p =
Table 3: Demographic and clinical variable analysis in individual studies
Factor Median % Regulated in Individual Studies
Psychosis .62%
Smoking .03%
Gender .12%
PMI .13%
Brain Side .03%
Brain pH 1.28%
Age .03%
Heavy Alcohol Use .27%
Heavy Drug Use .12%
Suicide .05%
Agonal State (Sudden Death) .19%
Antidepressant Use .04%
Antipsychotic Use .28%
Mood Stabilizer Use .09%
Lithium Use .22%
Valproate Use .07%
Median percentage of genes regulated in individual studies is shown with each variable. The criteria of significance (p-value < 0.01 and FC >1.3).
Table 4: Summary of cross-study analysis of psychosis showing fold changes and p-values.
Psychosis Combined Analysis p-value
Fold Change <.0001 .0001–.0005 .0005–.001 .001–.005 .005–.01 .01–.05 >.05
1–1.1 28 40 26 184 197 1327 17343
1.1–1.2 5 4 3 18 14 73 192
1.2–1.3 1 0 2 2 1 5 31
>1.3 0 1 0 0 0 0 5
Total 34 45 31 204 212 1405 17570
Chance 2 7 9 72 90 725 18527
Cum total 34 79 110 314 526 1931 19502
Cum chance 2 9 18 90 180 906 19502
Cum FDR 5.6% 10.2% 14.1% 21.8% 25.5% 31.9%
[image:6.612.54.562.563.719.2]Increased gene expression of metallothioneins in the cross-study analysis of psychosis
Figure 1
0.009, FC 1.51), MT1E (p = 0.01, FC 1.47), MT1K (p = 0.005, FC 1.47), MT1H (p = 0.03, FC 1.36), MT3 (p = 0.004, FC 1.3) and MT1F (p = 0.02, FC 1.3). The order of fold changes of metallothionein genes in the qPCR corre-sponds to the order of fold changes of these genes
observed in the microarray analysis. We have also con-firmed that expression of the neuropeptide genes are down-regulated in psychosis; NPY (p = 0.02, FC -1.32), NR4A2 (p = 0.01, FC -1.39), SST (p = 0.001, FC -1.57) and TAC1 (p = 0.01, FC -1.6). Overall fold changes of these
Decreased gene expression of neuropeptides in the cross-study analysis of psychosis
Figure 2
genes that we found with the qPCR experiment are larger than fold changes observed in the microarray analysis.
Discussion
In the current study, we have found the genes that are dif-ferentially regulated in the prefrontal cortex of individuals
with psychosis. These findings are important because we performed a cross-study analysis of seven microarray stud-ies that used three different Affymetrix platforms with two different post-mortem brain collections. Therefore, these gene expression changes are "consensus" fold changes
[image:9.612.65.542.115.564.2]Consistent up-regulation of metallothionein genes among metal ion binding genes in the Gene Ontology (GO) term
Figure 3
Quantitative PCR validation of metallothionein and neuropeptide genes
Figure 4
across multiple microarray studies following adjustment of confounding variables in individual studies.
It is well known that gene expression studies of psychiatric disorders using post-mortem brains are more challenging than others [25-28]. Possible reasons for this complexity include pre- and post-mortem factors such as RNA qual-ity, brain pH, PMI and agonal state that affect gene expres-sion patterns in the brains of psychiatric patients [23]. Moreover, biological and disease-specific effects are often hindered by several issues such as relatively small sample sizes, small effect sizes and heterogeneity of psychiatric phenotypes in the general population. The clinical infor-mation available for the patients is typically sparse, so that unknown clinical covariates may either confound or con-fuse many of the gene expression findings in psychiatric disorders [20]. Therefore, appropriate statistical adjust-ment using such demographic and clinical information is critical in order to improve inferences in determining putative genes and biological pathways in psychiatric dis-orders.
Gene expression microarray technology has become a powerful tool for discovery, although this technology had some limitations such as high cost of experiments, limited sample size, and lack of standardization on data analysis. Recently, there have been improvements in the microar-ray field, and more microarmicroar-ray datasets are available for meta-analysis. Several studies have described important issues related to the meta-analysis of microarray data including standardization, statistical analysis and data-basing strategy [29], and the development of new bioin-formatic tools such as searchable online archives of genetic/genomic findings in psychiatric disorders [30]. One of the main advantages of meta-analysis as compared to an individual study is the increased statistical power to detect consensus fold changes across multiple studies. It has been reported that gene expression changes in post-mortem brains of psychiatric patients are relatively small. This may explain some of the discrepancies in previous studies that reported putative genes in psychiatric disor-ders, because most of the studies were not sufficiently powered (due to small sample sizes) to detect small changes in gene expression. Moreover, some studies did not have sufficient clinical information of post-mortem brains to adjust for possible confounding variables.
In the current analysis, we have included seven microarray studies that used the frontal cortex (BA46/10, BA8/9 and BA6) as compared to the previous study [21] that included the cerebellum studies. A recent study demonstrated that different brain regions such as the frontal, cingulate, tem-poral, parietal, occipital cortices, hippocampus and sub-cortical regions show different patterns of gene expression [31]. The authors also found that gene expression patterns
in the prefrontal cortices (BA10 and BA46) are similar to each other as compared to non-frontal regions. To our knowledge, there is little evidence on gene expression dif-ferences in the sub-regions of the frontal cortex because most studies have focused on one region of the frontal cortex of schizophrenia patients. Another limitation was an availability of the prefrontal cortex (BA46) tissues from the Neuropathology Consortium when individual micro-array studies were conducted. This brain cohort has been used by many investigators for various types of research in the past. Therefore, we included 3 studies that used the frontal cortices (BA46/10, BA8/9 and BA6) from the Neu-ropathology Consortium because these regions are adja-cent to each other and have been implicated in schizophrenia [32-34]. Nevertheless, we included another 4 studies that used the Array Collection with the same dor-solateral prefrontal cortex (BA46).
In the current cross-study analysis, we identified a set of metallothionein genes including MT1X, MT1K, MT1E, MT1H, MT1F, MT2A and MT3 that are significantly up-regulated in psychosis. We used a real-time qPCR to vali-date differential expression of metallothionein genes in the prefrontal cortex (BA46) of psychosis patients. Real-time qPCR is often referred as the gold standard for vali-dation of gene expression in microarrays due to its advan-tages in detection sensitivity, large scale dynamic range, high precision and reproducible quantitation compared to other techniques [35,36]. For the qPCR, we used a com-plete set of dorsolateral prefrontal cortex (BA46) tissues from the Array Collection (psychosis N = 56, non-psycho-sis N = 49). It is important to note that most previous microarray studies have used a relatively small number of post-mortem brains for the qPCR validation.
the PFC of schizophrenia patients [50]. These results sug-gest that metallothioneins in the brain may play a signifi-cant role in neuroprotection and cognitive function. It is possible that neurodegenerative process may disrupt cog-nitive function in the frontal cortex of psychosis patients and up-regulation of metallothionein genes in the PFC may be a compensatory mechanism against these adverse processes. Interestingly, a recent study reported that met-allothionein-related compounds are well tolerated in ani-mal studies [39], and therefore, these compounds may be potential candidates for novel medication development in psychosis-related disorders.
The genes down-regulated in psychosis include neuropep-tide genes such as somatostatin (SST), neuropepneuropep-tide Y (NPY) and tachykinin (TAC1). The neuropeptide genes have been implicated in working memory function and in schizophrenia [51]. The NPY gene may be associated with schizophrenia [52], impulsivity [53], aggression and bipolar disorders [54,55]. Previous studies reported decreased NPY levels in the temporal cortex of schizo-phrenia [56] and decreased NPY receptor gene expression in lymphocytes of schizophrenia [57]. Gabriel et al reported that both NPY and SST levels are decreased in the cerebral cortex of individuals with schizophrenia [58]. A microarray study reported that SST gene expression is increased in the PFC of bipolar disorder but not with schizophrenia patients [59]. It is possible that this study may not have been sufficiently powered (due to small sample sizes) to detect small gene expression changes in schizophrenia. Consistent to the current results, mRNA levels of SST in the PFC are decreased in schizophrenia patients in a study using in situ hybridization [60] and another microarray study reported that both SST and NPY expression levels are decreased in the PFC of schizophre-nia [51]. TAC1-related genes are also implicated in psychi-atric disorders [61,62] and increased protein levels of TAC1 receptor in the PFC of schizophrenia have been reported [63]. Taken together, previous findings and the current results provide strong evidence for involvement of neuropeptide genes in psychosis-related disorders.
One of the potential confounding variables affecting neu-ropeptide gene expression may be the antipsychotic med-ication. Previous studies reported that NPY levels in the brain are affected by various drugs including typical and atypical antipsychotics [64,65]. Using rodents, one study reported that NPY and SST levels are increased in the PFC following haloperidol treatment [66], while another study reported that NPY levels are decreased following chronic antipsychotic treatment [67]. However, GABA-system related genes including SST are not changed in the PFC of monkey brains treated with chronic antipsychotic drugs [51]. In order to minimize the confounding effect of antipsychotic medication from the disease effect, we used
multiple regression models to adjust antipsychotic medi-cation in the current analysis.
Another gene down-regulated in psychosis is the tran-scription factor Nurr1 (NR4A2), an orphan nuclear recep-tor associated with the development of dopaminergic cells in the mid-brain (p < 0.00001, FC-1.16). This gene has been implicated in attention deficit hyperactivity disor-der, alcohol dependence, schizophrenia and bipolar dis-order [68-70]. A recent study with NR4A2 knock-out mice suggests that these animals display behavioral endophe-notypes that are displayed in other animal models of psy-chosis/schizophrenia. [71]. Therefore, reduced NR4A2 gene expression in the PFC may be associated with psy-chotic features.
Although genome-wide gene expression profiling in the postmortem brains may reveal valuable information related to psychiatric disorders, this approach alone is limited in terms of being able to distinguish between changes reflecting the primary disease etiology from those reflecting compensatory mechanisms and many potential confounding influences such as medications and drug use [72]. Therefore, it is necessary to study the relationship between gene expression, genetic and epigenetic varia-tions in individuals with psychiatric disorders. The inte-gration of postmortem gene expression with genetic variations including single nucleotide polymorphisms (SNPs) is the subject of ongoing investigations.
Conclusion
We found a set of genes that are differentially regulated in the prefrontal cortex of individuals with psychosis. Among those genes, metallothionein genes are consist-ently up-regulated and neuropeptide genes are down-reg-ulated. These genes may have implications in neurodegeneration and working memory function in the prefrontal cortex that are thought to be disrupted in psy-chosis. With an advantage of cross-study analysis, we were able to detect small but "consensus" changes in gene expression across multiple microarray studies. By combin-ing gene expression analyses across multiple microarray studies and with the qPCR validation of putative genes, we can provide greater confidence in the scientific find-ings, which include potential genes and biological path-ways in psychiatric disorders, as compared to the result obtained from a single study.
Competing interests
The authors declare that they have no competing interests.
Authors' contributions
manuscript. JS, SK, SS and SD acquisition of data, analysis and interpretation of data. RY, MK, EFT and MW analysis and interpretation of data, revisions of the manuscript.
Additional material
Acknowledgements
We would like to thank the SMRI collaborators who contributed their microarray data for the cross-study analysis: Drs. C. Anthony Altar, Sabine Bahn, Haiming Chen, Seth E Dobrin, Tadafumi Kato and Pamela Sklar.
References
1. Jablensky A: The conflict of the nosologists: views on schizo-phrenia and manic-depressive illness in the early part of the 20th century. Schizophr Res 1999, 39(2):95-100. discussion 159. 2. Ovsiew F: An end to Kraepelinian nosology? J Neuropsychiatry
Clin Neurosci 2000, 12(3):297-299.
3. Crow TJ: The continuum of psychosis and its genetic origins. The sixty-fifth Maudsley lecture. Br J Psychiatry 1990,
156:788-797.
4. Taylor MA: Are schizophrenia and affective disorder related? A selective literature review. Am J Psychiatry 1992, 149(1):22-32. 5. Taylor MA, Amir N: Are schizophrenia and affective disorder related?: the problem of schizoaffective disorder and the dis-crimination of the psychoses by signs and symptoms. Compr Psychiatry 1994, 35(6):420-429.
6. Torrey EF, Miller J, Rawlings R, Yolken RH: Seasonality of births in schizophrenia and bipolar disorder: a review of the litera-ture. Schizophr Res 1997, 28(1):1-38.
7. Torrey EF: Epidemiological comparison of schizophrenia and bipolar disorder. Schizophr Res 1999, 39(2):101-106. discussion 159–160.
8. Craddock N, O'Donovan MC, Owen MJ: Genes for schizophrenia and bipolar disorder? Implications for psychiatric nosology.
Schizophr Bull 2006, 32(1):9-16.
9. Owen MJ, Craddock N, Jablensky A: The genetic deconstruction of psychosis. Schizophr Bull 2007, 33(4):905-911.
10. Ivleva E, Thaker G, Tamminga CA: Comparing genes and phe-nomenology in the major psychoses: schizophrenia and bipo-lar 1 disorder. Schizophr Bull 2008, 34(4):734-742.
11. Goes FS, Sanders LL, Potash JB: The genetics of psychotic bipolar disorder. Curr Psychiatry Rep 2008, 10(2):178-189.
12. Pearlson GD, Folley BS: Endophenotypes, dimensions, risks: is psychosis analogous to common inherited medical illnesses?
Clin EEG Neurosci 2008, 39(2):73-77.
13. Glahn DC, Bearden CE, Cakir S, Barrett JA, Najt P, Serap Monkul E, Maples N, Velligan DI, Soares JC: Differential working memory impairment in bipolar disorder and schizophrenia: effects of lifetime history of psychosis. Bipolar Disord 2006, 8(2):117-123. 14. Krabbendam L, Arts B, van Os J, Aleman A: Cognitive functioning
in patients with schizophrenia and bipolar disorder: a quan-titative review. Schizophr Res 2005, 80(2–3):137-149.
15. Torrey EF, Barci BM, Webster MJ, Bartko JJ, Meador-Woodruff JH, Knable MB: Neurochemical markers for schizophrenia, bipo-lar disorder, and major depression in postmortem brains.
Biol Psychiatry 2005, 57(3):252-260.
16. Baumann B, Bogerts B: The pathomorphology of schizophrenia and mood disorders: similarities and differences. Schizophr Res
1999, 39(2):141-148. discussion 162.
17. Strasser HC, Lilyestrom J, Ashby ER, Honeycutt NA, Schretlen DJ, Pulver AE, Hopkins RO, Depaulo JR, Potash JB, Schweizer B, et al.:
Hippocampal and ventricular volumes in psychotic and nonpsychotic bipolar patients compared with schizophrenia patients and community control subjects: a pilot study. Biol Psychiatry 2005, 57(6):633-639.
18. Torrey EF, Webster M, Knable M, Johnston N, Yolken RH: The stanley foundation brain collection and neuropathology con-sortium. Schizophr Res 2000, 44(2):151-155.
19. Jones L, Goldstein DR, Hughes G, Strand AD, Collin F, Dunnett SB, Kooperberg C, Aragaki A, Olson JM, Augood SJ, et al.: Assessment of the relationship between pre-chip and post-chip quality measures for Affymetrix GeneChip expression data. BMC Bio-informatics 2006, 7:211.
20. Higgs BW, Elashoff M, Richman S, Barci B: An online database for brain disease research. BMC Genomics 2006, 7:70.
21. Elashoff M, Higgs BW, Yolken RH, Knable MB, Weis S, Webster MJ, Barci BM, Torrey EF: Meta-analysis of 12 genomic studies in bipolar disorder. J Mol Neurosci 2007, 31(3):221-243.
22. Dennis G Jr, Sherman BT, Hosack DA, Yang J, Gao W, Lane HC, Lem-picki RA: DAVID: Database for Annotation, Visualization, and Integrated Discovery. Genome Biol 2003, 4(5):P3.
23. Lipska BK, Deep-Soboslay A, Weickert CS, Hyde TM, Martin CE, Herman MM, Kleinman JE: Critical factors in gene expression in postmortem human brain: Focus on studies in schizophre-nia. Biol Psychiatry 2006, 60(6):650-658.
24. Shi L, Reid LH, Jones WD, Shippy R, Warrington JA, Baker SC, Collins PJ, de Longueville F, Kawasaki ES, Lee KY, et al.: The MicroArray Quality Control (MAQC) project shows inter- and intraplat-form reproducibility of gene expression measurements. Nat Biotechnol 2006, 24(9):1151-1161.
25. Iwamoto K, Kato T: Gene expression profiling in schizophrenia and related mental disorders. Neuroscientist 2006,
12(4):349-361.
26. Miklos GL, Maleszka R: Microarray reality checks in the context of a complex disease. Nat Biotechnol 2004, 22(5):615-621. 27. Mirnics K, Levitt P, Lewis DA: Critical appraisal of DNA
micro-arrays in psychiatric genomics. Biol Psychiatry 2006,
60(2):163-176.
28. Bahn S, Augood SJ, Ryan M, Standaert DG, Starkey M, Emson PC:
Gene expression profiling in the post-mortem human brain – no cause for dismay. J Chem Neuroanat 2001, 22(1–2):79-94. 29. Cahan P, Rovegno F, Mooney D, Newman JC, St Laurent G 3rd,
McCaffrey TA: Meta-analysis of microarray results: challenges, opportunities, and recommendations for standardization.
Gene 2007, 401(1–2):12-18.
30. Konneker T, Barnes T, Furberg H, Losh M, Bulik CM, Sullivan PF: A searchable database of genetic evidence for psychiatric dis-orders. Am J Med Genet B Neuropsychiatr Genet 2008.
31. Katsel P, Davis KL, Gorman JM, Haroutunian V: Variations in dif-ferential gene expression patterns across multiple brain regions in schizophrenia. Schizophr Res 2005, 77(2–3):241-252. 32. Koch K, Wagner G, Nenadic I, Schachtzabel C, Roebel M, Schultz C,
Axer M, Reichenbach JR, Sauer H, Schlosser RG: Temporal mode-ling demonstrates preserved overlearning processes in schizophrenia: an fMRI study. Neuroscience 2007,
146(4):1474-1483.
33. Digney A, Keriakous D, Scarr E, Thomas E, Dean B: Differential changes in apolipoprotein E in schizophrenia and bipolar I disorder. Biol Psychiatry 2005, 57(7):711-715.
34. Dean B, Keriakous D, Scarr E, Thomas EA: Gene expression pro-filing in Brodmann's area 46 from subjects with schizophre-nia. Aust N Z J Psychiatry 2007, 41(4):308-320.
35. Morey JS, Ryan JC, Van Dolah FM: Microarray validation: factors influencing correlation between oligonucleotide microar-rays and real-time PCR. Biol Proced Online 2006, 8:175-193. 36. Wang Y, Barbacioru C, Hyland F, Xiao W, Hunkapiller KL, Blake J,
Chan F, Gonzalez C, Zhang L, Samaha RR: Large scale real-time PCR validation on gene expression measurements from two
Additional file 1
A list of transcripts that shows significant regulation in the cross-study analysis of psychosis (p < 0.001)
Click here for file
[http://www.biomedcentral.com/content/supplementary/1471-244X-8-87-S1.csv]
Additional file 2
A list of GO terms that shows enriched gene sets in the cross-study analysis of psychosis (p < 0.05)
Click here for file
commercial long-oligonucleotide microarrays. BMC Genomics
2006, 7:59.
37. West AK, Hidalgo J, Eddins D, Levin ED, Aschner M: Metal-lothionein in the central nervous system: Roles in protec-tion, regeneration and cognition. Neurotoxicology 2008. 38. Haq F, Mahoney M, Koropatnick J: Signaling events for
metal-lothionein induction. Mutat Res 2003, 533(1–2):211-226. 39. Penkowa M: Metallothioneins are multipurpose
neuroprotect-ants during brain pathology. Febs J 2006, 273(9):1857-1870. 40. Ebadi M, Iversen PL, Hao R, Cerutis DR, Rojas P, Happe HK, Murrin
LC, Pfeiffer RF: Expression and regulation of brain metal-lothionein. Neurochem Int 1995, 27(1):1-22.
41. Natale JE, Knight JB, Cheng Y, Rome JE, Gallo V: Metallothionein I and II mitigate age-dependent secondary brain injury. J Neu-rosci Res 2004, 78(3):303-314.
42. West AK, Chuah MI, Vickers JC, Chung RS: Protective role of metallothioneins in the injured mammalian brain. Rev Neuro-sci 2004, 15(3):157-166.
43. Ogra Y, Suzuki KT: Nuclear trafficking of metallothionein: pos-sible mechanisms and current knowledge. Cell Mol Biol (Noisy-le-grand) 2000, 46(2):357-365.
44. Hidalgo J, Aschner M, Zatta P, Vasak M: Roles of the metal-lothionein family of proteins in the central nervous system.
Brain Res Bull 2001, 55(2):133-145.
45. Nagano S, Satoh M, Sumi H, Fujimura H, Tohyama C, Yanagihara T, Sakoda S: Reduction of metallothioneins promotes the dis-ease expression of familial amyotrophic lateral sclerosis mice in a dose-dependent manner. Eur J Neurosci 2001,
13(7):1363-1370.
46. Penkowa M, Espejo C, Ortega-Aznar A, Hidalgo J, Montalban X, Mar-tinez Caceres EM: Metallothionein expression in the central nervous system of multiple sclerosis patients. Cell Mol Life Sci
2003, 60(6):1258-1266.
47. Dittmann J, Fung SJ, Vickers JC, Chuah MI, Chung RS, West AK: Met-allothionein biology in the ageing and neurodegenerative brain. Neurotox Res 2005, 7(1–2):87-93.
48. Loney KD, Uddin KR, Singh SM: Strain-specific brain metal-lothionein II (MT-II) gene expression, its ethanol responsive-ness, and association with ethanol preference in mice. Alcohol Clin Exp Res 2003, 27(3):388-395.
49. Levin ED, Perraut C, Pollard N, Freedman JH: Metallothionein expression and neurocognitive function in mice. Physiol Behav
2006, 87(3):513-518.
50. Arion D, Unger T, Lewis DA, Levitt P, Mirnics K: Molecular evi-dence for increased expression of genes related to immune and chaperone function in the prefrontal cortex in schizo-phrenia. Biol Psychiatry 2007, 62(7):711-721.
51. Hashimoto T, Arion D, Unger T, Maldonado-Aviles JG, Morris HM, Volk DW, Mirnics K, Lewis DA: Alterations in GABA-related transcriptome in the dorsolateral prefrontal cortex of sub-jects with schizophrenia. Mol Psychiatry 2008, 13(2):147-161. 52. Ikeda K, Ikeda K, Iritani S, Ueno H, Niizato K: Distribution of
neu-ropeptide Y interneurons in the dorsal prefrontal cortex of schizophrenia. Prog Neuropsychopharmacol Biol Psychiatry 2004,
28(2):379-383.
53. Greco B, Carli M: Reduced attention and increased impulsivity in mice lacking NPY Y2 receptors: relation to anxiolytic-like phenotype. Behav Brain Res 2006, 169(2):325-334.
54. Karl T, Herzog H: Behavioral profiling of NPY in aggression and neuropsychiatric diseases. Peptides 2007, 28(2):326-333. 55. Kuromitsu J, Yokoi A, Kawai T, Nagasu T, Aizawa T, Haga S, Ikeda K:
Reduced neuropeptide Y mRNA levels in the frontal cortex of people with schizophrenia and bipolar disorder. Brain Res Gene Expr Patterns 2001, 1(1):17-21.
56. Frederiksen SO, Ekman R, Gottfries CG, Widerlov E, Jonsson S:
Reduced concentrations of galanin, arginine vasopressin, neuropeptide Y and peptide YY in the temporal cortex but not in the hypothalamus of brains from schizophrenics. Acta Psychiatr Scand 1991, 83(4):273-277.
57. Vawter MP, Ferran E, Galke B, Cooper K, Bunney WE, Byerley W:
Microarray screening of lymphocyte gene expression differ-ences in a multiplex schizophrenia pedigree. Schizophr Res
2004, 67(1):41-52.
58. Gabriel SM, Davidson M, Haroutunian V, Powchik P, Bierer LM, Puro-hit DP, Perl DP, Davis KL: Neuropeptide deficits in
schizophre-nia vs. Alzheimer's disease cerebral cortex. Biol Psychiatry 1996,
39(2):82-91.
59. Nakatani N, Hattori E, Ohnishi T, Dean B, Iwayama Y, Matsumoto I, Kato T, Osumi N, Higuchi T, Niwa S, et al.: Genome-wide expres-sion analysis detects eight genes with robust alterations spe-cific to bipolar I disorder: relevance to neuronal network perturbation. Hum Mol Genet 2006, 15(12):1949-1962.
60. Morris HM, Hashimoto T, Lewis DA: Alterations in Somatostatin mRNA Expression in the Dorsolateral Prefrontal Cortex of Subjects with Schizophrenia or Schizoaffective Disorder.
Cereb Cortex 2008.
61. Chahl LA: Tachykinins and neuropsychiatric disorders. Curr Drug Targets 2006, 7(8):993-1003.
62. Le-Niculescu H, Balaraman Y, Patel S, Tan J, Sidhu K, Jerome RE, Edenberg HJ, Kuczenski R, Geyer MA, Nurnberger JI Jr, et al.:
Towards understanding the schizophrenia code: an expanded convergent functional genomics approach. Am J Med Genet B Neuropsychiatr Genet 2007, 144(2):129-158.
63. Tooney PA, Crawter VC, Chahl LA: Increased tachykinin NK(1) receptor immunoreactivity in the prefrontal cortex in schiz-ophrenia. Biol Psychiatry 2001, 49(6):523-527.
64. Obuchowicz E, Krysiak R, Herman ZS: Does neuropeptide Y (NPY) mediate the effects of psychotropic drugs? Neurosci Biobehav Rev 2004, 28(6):595-610.
65. Fitzgerald PB, Scaffidi A, Morris MJ, de Castella AR, Kulkarni J: The relationship of changes in leptin, neuropeptide Y and repro-ductive hormones to antipsychotic induced weight gain. Hum Psychopharmacol 2003, 18(7):551-557.
66. Sakai K, Maeda K, Chihara K, Kaneda H: Increases in cortical neu-ropeptide Y and somatostatin concentrations following haloperidol-depot treatment in rats. Neuropeptides 1995,
29(3):157-161.
67. Huang XF, Deng C, Zavitsanou K: Neuropeptide Y mRNA expression levels following chronic olanzapine, clozapine and haloperidol administration in rats. Neuropeptides 2006,
40(3):213-219.
68. Chen YH, Tsai MT, Shaw CK, Chen CH: Mutation analysis of the human NR4A2 gene, an essential gene for midbrain dopaminergic neurogenesis, in schizophrenic patients. Am J Med Genet 2001, 105(8):753-757.
69. Smith KM, Bauer L, Fischer M, Barkley R, Navia BA: Identification and characterization of human NR4A2 polymorphisms in attention deficit hyperactivity disorder. Am J Med Genet B Neu-ropsychiatr Genet 2005, 133(1):57-63.
70. Ishiguro H, Okubo Y, Ohtsuki T, Yamakawa-Kobayashi K, Arinami T:
Mutation analysis of the retinoid × receptor beta, nuclear-related receptor 1, and peroxisome proliferator-activated receptor alpha genes in schizophrenia and alcohol depend-ence: possible haplotype association of nuclear-related receptor 1 gene to alcohol dependence. Am J Med Genet 2002,
114(1):15-23.
71. Rojas P, Joodmardi E, Hong Y, Perlmann T, Ogren SO: Adult mice with reduced Nurr1 expression: an animal model for schizo-phrenia. Mol Psychiatry 2007, 12(8):756-766.
72. Bray NJ: Gene expression in the etiology of schizophrenia.
Schizophr Bull 2008, 34(3):412-418.
Pre-publication history
The pre-publication history for this paper can be accessed here: