NO
xEmission Prediction Based on Measurement of in-Cylinder Pressure
for CI Engine Running with Diesel and Biodiesel
B. Tesfa , R. Mishra, F. Gu, and A.D. Ball
Center for Performance and Efficiency Engineering
University of Huddersfield, Queensgate, Huddersfield, HD1 3DH, UK
Abstract
NOx is one of the major toxic emissions that needs to be regulated stringently in both EU and
USA emission regulations. The engine designer is keen to get an accurate, reliable and cost
effective NOx measurement system. In this paper, the application of the cylinder pressure for
predicting the NOx emission of compression ignition (CI) engine fuelled with diesel and
biodiesel during steady state operations is carried out. To address the problem, an
experimental work was conducted on four-cylinder, turbo-charged, four-stroke and
direct-injection CI engine which was fuelled with diesel and biodiesel blends. During the
experiment, the main parameters consisting of in-cylinder pressure, fuel flow rate, air flow
rate, and the NOx emission, were measured. The temperature within the cylinder was
predicted using the cylinder pressure and air flow rate. Using the temperature values, the
NOx emission was simulated in the Zeldovich extended mechanism. The simulation result
was then compared with the measured one for a range of engine operating conditions. The
models were shown to produce consistent results with the measured one for a range of engine
working speeds and loads.
Keywords: NOx emission prediction, In-cylinder pressure, In-cylinder Temperature, Biodiesel, Zeldovich mechanism, Transient measurement
1.
Introduction
Internal combustion engines release NOx which is one of the most toxic emissions for the
public and the environment. NOx has a direct connection with the formation of photochemical
smog in the atmosphere. Currently, NOx gas emission has been stringently constrained by
emission law [1], [2], and it has become the biggest challenge facing automotive industries
throughout the world [3], [4]. To confirm the legal requirement and to carry out further
investigation on the combustion characteristics of the engine, NOx measurement is of importance
In addition, the fossil fuel demand around the world is increasing, and hence the fossil fuel
deposits may be depleted in the coming 50 years [5]. These problems are compelling the world to
find alternative fuels to the existing fossil fuels such as biodiesel, hydrogen, ethanol and others.
The development of these alternative fuels requires rigorous testing on the combustion,
performance and emission characteristics of the engine running with alternative fuels [6].
Currently, three methods of measuring/predicting NOx emissions are available: analyser use
(direct measuring), engine map method, and model based (for example artificial neural network).
The direct measurement of nitrogen oxides, by using a heated chemiluminescent detector
(HCLD) with a NO2/NO analyser, is widely used. However, the analyser has disadvantages of
higher initial costs, larger space requirement, frequent calibration demand and a sooty effect. In
addition, its response time is very slow (1-2 seconds), which affect transient NOx emission
measurements [7]. However, the formation of NOx is the most significant phenomena under
transient engine operations, especially when biodiesel is used as a fuel [8]. The transient effects
are mainly seen during engine speed or load changes, as result increases fuel injection which
contributes to higher cycle temperatures and, hence NOx production [8], [9]. Recently, fast NOx
analysers were commercialized for engine calibration, after treatment development and
combustion diagnosis. However, these methods are still in the process of adaptation in the
industry. An engine map method is based on measurements of a setting series of engine speed and
torque, or power of the engine, under stationary conditions. Then, a NOx database is set to use for
simulation work. Most maps have the drawbacks of not considering the effects of all the
significant variables on NOx emission levels. This causes deviation from real NOx emissions
estimated by the engine map. In addition, it estimates the transient conditions from discrete
steady state values [7]. The third method, which needs the artificial neural network (ANN)
system, has the advantage of training using real data taken under steady and transient conditions.
However, in the neural network, there is no explicit mathematical representation of the physical
process, and the predicting capability is limited only to the specific engine type for which the
neural network is trained [10].
As has been discussed earlier, the available methods such as emission analyser, the engine map
and ANN system, are limited either only for steady state operations or only some engine
operations or underdevelopments. Therefore, it is important to develop an online NOx emission
prediction method which can be used for engine calibration, after-treatment development and
combustion diagnostics. The NOx emission of CI engines is largely a thermal phenomenon and
thus in-cylinder pressure and air flow rate can be used to make an accurate online quantitative
purpose due to its well established relationship with in-cylinder temperature, either ideal gas law
or thermodynamic equations [11].
The in-cylinder pressure signal can provide vital information such as peak pressure, P-V
diagram, indicated mean effective pressure, fuel supply effective pressure, heat release rate,
combustion duration, ignition delay and so on. Moreover, based on ideal gas and the first law
of thermodynamics it can be used in more complex calculations, for example, in air mass
flow estimation and combustion diagnosis [12]–[15].
The beauty of the new NOx prediction method is that the parameters which can be used for
the NOx predictions are already a must measure parameters during engine development and
calibration for combustion and performance analysis. Furthermore, the correlation between
cylinder pressure and NOx emission would be integrated with the non-destructive engine
dynamics data, e.g. vibration and acoustic emission, to enable prediction of NOx emission by
dynamics data in future work. Therefore, the objective of this study is to investigate the
application of the cylinder pressure for predicting the NOx emission from a CI engine fuelled
with diesel and biodiesel during steady state conditions. The biodiesel was considered in this
study to test the model for its consistency for alternative fuels. In the next sections, the NOx
prediction model, the experimental facilities and procedures, the result and discussion will be
addressed.
2.
NOx Prediction Model Development
The NOx formation process in internal combustion (IC) engines can be categorized as prompt
NOx formation process, fuel NOx formation process and the thermal NOx formation process.
Although the NOx emission releases amount varies, each of the three pathways of NOx formation
contributes to the overall NOx emission into the environment [16]. Prompt NOx is produced
when hydrocarbon fragments (mainly CH and CH2) react with nitrogen in the combustion
chamber to form fixed nitrogen species, such as HCN. HCN reacts with the atmospheric nitrogen
to form NOx. Prompt NOx formation is only common in fuel-rich combustion. Diesel engines
run fuel-lean; therefore, the probability of prompt NOx formation is limited. Additionally, the
carbon to hydrogen ratio in biodiesel is lower than that in diesel fuel. Therefore, the contribution
of prompt NOx formation from biodiesel within fuel engines is insignificant. The second method
of NOx formation occurs when nitrogen, which has been chemically bound in the fuel, combines
with excess oxygen during the combustion process. This is not a problem for the current standard
of diesel fuel and biodiesel, which does not contain nitrogen inherently [17]. The third method is
engines. It occurs during fuel combustion in the cylinder chamber when the atmospheric oxygen
and nitrogen combines at higher temperature.
In this study, the thermal NOx formation approach is used for predicting the NOx emissions. The
model involves the use of the in-cylinder pressure to obtain the in-cylinder temperature which is
then used for obtaining the NOx emission from the CI engine using the Zeldovich mechanism.
NOx formation is a thermal mechanism, which occurs in the post-flame burned gases, and is
modelled by the extended Zeldovich mechanism, described in equations (1) to (3). These
equations include the reactants, products and rate constants. In order to drive the rate of NO
concentration change in the equation (4), it was assumed that the concentration of the N is minor
in comparison to the concentrations of the other species. Therefore, the rate of change in N can be
set equal to zero. The rate constants in equation (4) have been measured and critically evaluated
in numerous studies [3], [17], [18]. The reaction rates used in this NOx model are given in Table
1. In Table 1, the (+) sign indicates the forward reaction and the (-) sign indicate the backward
reaction. The [N2] and [O2] concentrations were determined at ambient condition of the
atmospheric air. O and OH values are calculated from equation (5) to (7). Both equations (5) and
(6) give O value, the maximum value was taken.
N2 + O NO + N (1)
N + O2 NO + O (2)
N + OH NO + H (3)
The flow chart of the NOx prediction from the in-cylinder pressure and air flow rate is shown in
Error! Reference source not found.. As shown in Error! Reference source not found., the
in-cylinder pressure and the air flow rate were measured experimentally by using the procedure
described in section 3.
[ ][ ] (
[ ] [ ] )
( [ ]
[ ] [ ])
[image:4.595.63.295.666.755.2]gmol/(m3 s) (4)
Table 1 Rate constants for thermal NOx formation[3] Rate constants Values [m3/(gmol s)]
k1
k-1
k2
K±3
K±2
k-2
k3
k-3
Where k1, k2, and k3 are the rate constants for the forward reactions as given in Table 1.
[ ] [ ] gmol/m3
(5)
[ ] [ ] gmol/m3
(6)
[ ] [ ] [ ] gmol/m3
(7)
The in-cylinder temperature has been estimated from the ideal gas law stated in equation (8)
(8)
where, T(θ) is the instantaneous in-cylinder temperature (K) at crank-angle θ, P(θ) is the
instantaneous in-cylinder pressure (Pa) at crank-angle θ, Ma(θ) is the instantaneous mass of
air in the cylinder at crank-angle θ (kg) and Rg is gas constant (J/kg.K).
[ (9)
where V( is the instantaneous cylinder volume (m3) at crank-angle θ, Vdis displacement
volume given (m3), R is the ratio of connecting rod length to crank angle, and ris the
compression ratio.
To predict the NOx emission using the in-cylinder pressure and air flow rate, the following
input parameters and computational procedures have been used.
The Input parameters:-The input parameters used in the NOx prediction are engine geometry,
gas constant (Rg), air percentage composition, air-mass flow rate, and in-cylinder pressure.
Computational steps:- the NOx emission can be predicted from cylinder pressure and
in-cylinder temperature values. The steps used in these computations are outlined as follows:
Step 1: The air flow rate and in-cylinder pressure data have been acquired by the data
acquisition system as described in Figure 1.
Step 2: The air mass flow rate and in-cylinder pressure have been calculated from the air
flow meter readings and pressure sensor calibration coefficients.
Step 3: The instantaneous cylinder volume has been calculated from the engine geometry
described in Table 2 and instantaneous crank angle using equation (9).
Step 4: The N2 and O2 concentration have been computed from the air composition and air
flow rate. The percentage of air composition for O2 and N2 are 20.9% and 79%,
Step 5: The O concentration has been computed using the maximum value obtained from
[image:6.595.79.532.132.641.2]equations (5) and (6). OH concentration has been obtained from equation (7).
Figure 1 Flow chart for NOx prediction from in-cylinder pressure and air flow rate
Step 6: The in-cylinder temperature has been computed from airflow rate, air-gas constant,
in-cylinder volume and in-cylinder pressure using the ideal gas law which is
described in equation (8). Piezoelectric sensor
ADC data acquisition system
Crank angle encoder Air-mass meter
Charge Amplifier
Calculate in cylinder pressure from pressure
sensor properties Calculate Ma from
sensor properties
Calculate in cylinder Temperature using ideal
gas law
Calculate rate constants k±1, k±2, k±3
Calculate the concentration of N2,
O2, O, OH
Calculate NOx using Zeldovich mechanism equation (4)
Predicted NOx emission value
Step 7: The NOx formation reaction constants have been computed from the N2, O2, O and
OH concentration which have been obtained from steps 4 and 5 using rate constant
equations presented in Table 1.
Step 8: The NOx emission has been computed from the in-cylinder temperature calculated
in step 6 and the NOx reaction rate constants obtained from step 7 using the
extended Zeldovich mechanism which is described by equation (4).
Output parameters:- the output parameters of NOx prediction models are the in-cylinder
temperature and NOx emission. In the following section, the experimental facilities and test
procedures for the measurement of in-cylinder pressure and air flow rate are described.
3.
Experimental Facilities and Test Procedures
The engine system used in the experiment was a four-cylinder, four-stroke, turbo-charged,
inter-cooled and direct-injection CI engine which is presently fitted to large agricultural
vehicles. The engine specifications are given in Table 2. The engine was loaded by a 200kW
AC Dynamometer with 4-Quadrant regenerative drive.
The engine system was integrated with pressure transducers, speed sensors, air flow meters,
fuel flow meters and in-line torque meter. The air mass flow rate was measured using the
hot-film air-mass meter HFM5. The fuel flow rate was measured by using a gravimetric fuel
flow meter (FMS-1000 gravimetric fuel meter). An air-cooled piezo-quartz (Kistler 6125A11
model) pressure sensor was used to measure the in-cylinder pressure by mounting on the
cylinder head. The cylinder pressure signal was passed through a Bruel & KJaer 2635 charge
amplifier to give outputs of 0-10volts for the calibrated pressure range of 0-25MPa. The
crankshaft position was determined using a crank angle sensor to synchronize the cylinder
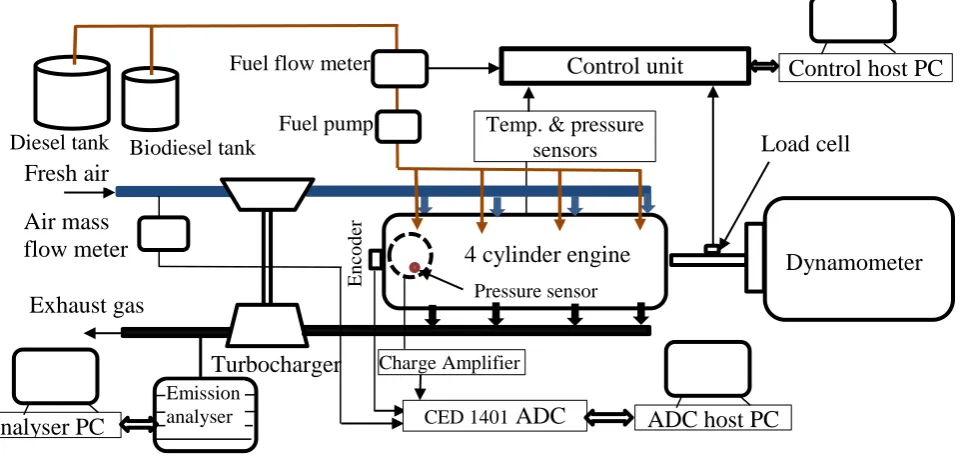
pressure and the crank angle. The schematic of the test facilities is shown in Figure 2.
The level of NOx emissions was measured using a chemiluminescent detector (HCLD) with a
NO2/NO analyser, Horriba EXSA – 1500 in dry basis. It has a measuring range of 0 –
5000ppm and error of 1%. The sample hose of the analyser was connected directly to the
exhaust pipe. It was extended from the exhaust pipe to the equipment unit where the
analysers were located. To avoid condensation of hydrocarbons and to maintain a wall
temperature, the sample line was heated to a temperature of around 191˚C. The system was
Before each batch of tests, the engine was running at a higher load for 10min to remove the
deposited hydrocarbon from the sample line on the day prior to the actual test day and also in
[image:8.595.59.540.143.371.2]between test regimes with different fuel types.
Figure 1 Experimental setup [19]
The maximum frequency of the data acquisition system was 37 kHz. The operating
conditions used in the tests are listed in Table 3. The experiments were carried out for engine
speeds of 900, 1100, 1300 and 1500rpm at 420Nm load and engine loads of 105, 210, 315
and 420Nm at 1300rpm. These operating conditions are selected because the conditions lie
with the engine working conditions.
Table 2Characteristics of engine
Parameters Specification
Engine type Turbo charged diesel engine
Number of cylinders 4
Bore 103mm
Stroke 132mm
Compression ratio 18.3:1
Number of valves 16
Injection system Direct injection
Displacement 4.4 litre
Cooling system Water
ADC host PC
Control host PC
Diesel tank
Turbocharger Exhaust gas
4 cylinder engine
Load cell
Pressure sensor
Fuel pump
E
n
co
d
er
Biodiesel tank
Fuel flow meter
Fresh air
CED 1401 ADC Charge Amplifier
Control unit
Temp. & pressure sensors
Dynamometer
Analyser PC
Emission analyser Air mass
[image:8.595.75.396.523.722.2]Table 3Engine operating speeds and loads
In this study both diesel and biodiesel were used. The biodiesel (rapeseed oil biodiesel) was
obtained from a local biodiesel producer which was produced by a transesterfication process
[image:9.595.72.473.280.408.2]from „virgin‟ oil using alcohol. Properties of the fuels are described in Table 4.
Table 4 Physical and Chemical properties of fuel [20]
4.
Result and Discussion
In this study, the application of cylinder pressure for predicting the NOx emission has been
investigated. In the previous section, the NOx prediction models were developed and the
experimental facilities and test procedures were described. In this section, firstly the
in-cylinder temperature which was calculated using equation (8) has been compared for
different operating conditions and fuel types. Secondly, the NOx emissions of an engine
running with diesel and biodiesel have been investigated. Finally, to validate the prediction
model, the predicted NOx emission values have been compared with measured NOx emission
data for both diesel and biodiesel fuel.
4.1
Parametric Investigations (in-cylinder temperature and NOx)
The diesel combustion temperature values, which have been calculated from the
instantaneous in-cylinder pressure, cylinder volume and air flow rate, are discussed in this
section for different engine speed and load ranges. The mathematical relation between the
in-cylinder temperature and in-in-cylinder pressure has been discussed in the section 2. Condition Speed (rpm) Load (Nm) Fuel
A 1300 105, 210, 315, 420 Diesel, Biodiesel B 9900,1100, 1300, 1500 420 Diesel, Biodiesel
Property Units Diesel Biodiesel
% C 87 77
Composition % H 13 12
% O 0 11
Density Kg m-3 853 879
The in-cylinder temperatures of biodiesel and diesel fuel at different operating conditions are
depicted in Figure 2Error! Reference source not found.. The result shows that the engine
running with biodiesel resulted in higher in-cylinder temperature than that of the diesel. This
phenomena can be explained as the availability of extra oxygen molecules in biodiesel fuel
which facilitates the complete combustion of fuel resulting in higher temperature for an
engine running with biodiesel, as well as the advanced combustion process initiated by the
physical properties such as higher cetane number, viscosity, density and bulk modulus [21]–
[23].As it will be discussed later, this is the main cause for the higher emission of NOx from
an engine running with biodiesel. On the contrary, Monyem et al [24] reported that for both
constant-volume combustion and constant-pressure combustion, the temperature for biodiesel
was slightly below that for diesel fuel.
Figure 2 In-cylinder temperatures versus crank angle of CI engine running with diesel and biodiesel for engine loads of 420Nm and range of speeds
Figure 3 shows the measured value of nitrogen oxides (NOx) emission for an engine running
with biodiesel and diesel at various loads and engine speeds. It can be seen that the NOx
emission, when the engine running with biodiesel, is higher than when it runs with diesel for
0 200 400 600
0 500 1000 1500 2000
Crank Angle, deg
In -c y lin d e r T e m p e ra tu re , K
(a) 900rpm, 420Nm
Diesel Biodiesel
0 200 400 600
0 500 1000 1500 2000
Crank Angle, deg
In -c y lin d e r T e m p e ra tu re , K
(b) 1100rpm, 420Nm
0 200 400 600
0 500 1000 1500 2000
Crank Angle, deg
In -c y lin d e r T e m p e ra tu re , K
(c) 1300rpm, 420Nm
0 200 400 600
0 500 1000 1500 2000
Crank Angle, deg
In -c y lin d e r T e m p e ra tu re , K
[image:10.595.84.480.303.630.2]both engine speed and load variation. The main reason for higher emission with biodiesel is
the higher temperature of the cylinder chamber which is discussed in Figure 2. The higher
temperature is caused by the higher cetane number of biodiesel [22], [25] which leads to an
advanced combustion by shortening the ignition delay and the higher availability of free oxygen
[25]–[27]. In addition, when biodiesel is injected, the pressure rise produced by the pump is
higher for biodiesel due to its physical properties (density and viscosity), as a consequence of
its lower compressibility (higher bulk modulus) and fuel propagates quickly towards the
injectors. As a result, the cylinder gas becomes rich fairly quickly by fuel and reaches its peak
[image:11.595.107.495.260.542.2]temperature which speeds up the formation of NOx.
Figure 3 Comparison of diesel and biodiesel NOx emission (a) at 420 Nm range of speeds (b) at 1300rpm range of loads
4.2
NOx Prediction and Model Validation
The comparison between measured and predicted NOx emissions corresponding to the diesel
and biodiesel operation at various loads and various engine speeds are shown from Figure 4
to Figure 7. As it can be seen in Figure 4(a) and Figure 5(a), the NOx emissions of the engine
running with diesel and biodiesel are found to increase with the increase of the engine speed
at higher load (420Nm). This can be primarily due to an increase in volumetric efficiency and
gas flow motion within the engine cylinder under higher engine speeds and higher load
operating conditions, which led to a faster mixing between fuel and air and hence the shorter
900 1100 1300 1500
0 200 400 600 800 1000 1200
Speed (rpm)
N
O
x
(p
p
m
)
(a) NOx emission at 420Nm
Diesel Biodiesel
105 210 315 420
0 200 400 600 800 1000 1200
Load(Nm)
N
O
x
(p
p
m
)
(b) NOx emission at 1300rpm
ignition delay. This phenomenon has also been reported by C.Lin and H. Lin [4] and Utlu and
Koak [28]. The % error between the measured and predicted NOx emission values are
depicted in Figure 6(a) and Figure 5(b). It can be seen that the new NOx prediction model
described in section 2 can predict NOx emission only up to a maximum error of 3.8% and 3%
[image:12.595.96.497.181.501.2]for engines running with diesel and biodiesel respectively.
Figure 4 CI engine running with diesel at 420Nm (a) Measured and predicted NOx emission values (b) The % error between measured and predicted values
The measured and predicted NOx emission value of engines running with diesel and
biodiesel running at 1300rpm and at a range of loads are shown in Figure 6(a) and Figure
7(a). It can be seen that the NOx emission is increasing with the load. Figure 8(b) and Figure
9(b) show the % error between measured and predicted NOx emission values. It can be seen
that the NOx prediction model can predict NOx emission only up to a maximum error of 5%
and 5.2% for engines running with diesel and biodiesel respectively at a range of engine
loads.
900 1100 1300 1500
0 200 400 600 800 1000 1200
Speed (rpm)
N
O
x
(p
p
m
)
(a) Diesel fuel- NOx emission at 420Nm
Measured Predicted
900 1100 1300 1500
-6 -4 -2 0 2 4 6
Speed (rpm)
Erro
r
(%
)
Figure 5 CI engine running with biodiesel at 420Nm (a) Measured and predicted NOx emission values (b) The % error between measured and predicted values
Figure 6 CI engine running with diesel at 420Nm (a) Measured and predicted NOx emission values (b) The % error between measured and predicted values
900 1100 1300 1500
0 200 400 600 800 1000 1200 Speed (rpm) N O x (p p m )
(a) Biodiesel fuel- NOx emission at 420Nm Measured
Predicted
900 1100 1300 1500
-6 -4 -2 0 2 4 6 Speed (rpm) Erro r (% )
(b) Biodiesel fuel- measured and predicted difference
105 210 315 420
0 200 400 600 800 1000 Load (Nm) N O x (p p m )
(a) Diesel fuel- NOx emission at 1300rpm
Measured Predicted
105 210 315 420
-6 -4 -2 0 2 4 6 Load (Nm) Erro r (% )
[image:13.595.113.480.427.712.2]Figure 7 CI engine running with biodiesel at 1300rpm (a) Measured and predicted NOx emission values (b) The measured and predicted % error
Conclusion
In this study, a model for predicting NOx emission has been developed by using measured
in-cylinder pressure as an input. The efficacy of using the in-in-cylinder pressure to predict the
NOx emission has also been investigated for a compression ignition (CI) engine running with
diesel and biodiesel. The temperature of the cylinder is predicted using the cylinder pressure
by ideal-gas state equation. Using the predicted temperature, the NOx emission is then
calculated based on the Zeldovich extended mechanism.
The measured and predicted results of NOx emission at a range of engine speeds and loads
are compared. The comparisons show that the emission values of prediction model and
measured are in an acceptable error (maximum of 5.2%) for all operating ranges of engine
speeds.
The prediction model paves the way for real-time NOx emission estimation for engine
transient study and on-line diagnosis. This model can be used during the design stage of the
engine to meet the emission standards requirements, especially during transient operations.
To become fully functional for road vehicles and stationary engines, it needs further
integration to link the in-cylinder temperature with engine dynamics, such as engine vibration
105 210 315 420
0 200 400 600 800 1000 1200
Load (Nm)
N
O
x
(p
p
m
)
(a) Biodiesel fuel- NOx emission at 1300rpm Measured
Predicted
105 210 315 420
-6 -4 -2 0 2 4 6
Load (Nm)
Erro
r(%
)
or acoustic emission. This can be achieved through correlating the in-cylinder temperature
with vibration or acoustic by using the in-cylinder pressure in future research.
References
[1] B. Tesfa, R. Mishra, F. Gu, and O. Gilkes, “Emission Behaviour of a CI Engine Running by Biodiesel under Transient Conditions,” SAE International, Warrendale, PA, 2010-01-1280, Apr. 2010.
[2] B. Tesfa, F. Gu, R. Mishra, and A. Ball, “Emission Characteristics of a CI Engine Running with a Range of Biodiesel Feedstocks,” Energies, vol. 7, no. 1, pp. 334–350, Jan. 2014.
[3] S. M. Aithal, “Modeling of NOx formation in diesel engines using finite-rate chemical kinetics,” Applied Energy, vol. 87, no. 7, pp. 2256–2265, 2010.
[4] C.-Y. Lin and L.-W. Chen, “Engine performance and emission characteristics of three-phase diesel emulsions prepared by an ultrasonic emulsification method,” Fuel, vol. 85, no. 5–6, pp. 593–600, Mar. 2006.
[5] M. N. Nabi and J. E. Hustad, “Influence of Biodiesel Addition to Fischer−Tropsch Fuel on Diesel Engine Performance and Exhaust Emissions,” Energy Fuels, vol. 24, no. 5, pp. 2868–2874, May 2010.
[6] B. Tesfa, R. Mishra, F. Gu, and A. D. Ball, “Water injection effects on the performance and emission characteristics of a CI engine operating with biodiesel,” Renewable Energy, vol. 37, no. 1, pp. 333–344, Jan. 2012.
[7] H. C. Krijnsen, V. Kooten1, W. E. J, H. P. A. Calis, R. P. Verbeek, V. D. Bleek, and C. M, “Evaluation of an artificial neural network for NOX emission prediction from a transient diesel engine as a base for NOX control,” The Canadian Journal of Chemical Engineering, vol. 78, no. 2, pp. 408–417, Mar. 2009.
[8] O. Armas, J. J. Hernández, and M. D. Cárdenas, “Reduction of diesel smoke opacity from vegetable oil methyl esters during transient operation,” Fuel, vol. 85, no. 17–18, pp. 2427–2438, Dec. 2006.
[9] S. Samuel, D. Morrey, D. H. C. Taylor, and M. Fowkes, “Parametric Study into the Effects of Factors Affecting Real-World Vehicle Exhaust Emission Levels,” SAE International, Warrendale, PA, 2007-01-1084, Apr. 2007.
[10] S. H. Chan, Y. He, and J. H. Sun, “Prediction of Transient Nitric Oxide in Diesel Exhaust,” Proceedings of the Institution of Mechanical Engineers, Part D: Journal of Automobile Engineering, vol. 213, no. 4, pp. 327–339, Apr. 1999.
[11] F. Payri, J. M. Luján, J. Martín, and A. Abbad, “Digital signal processing of in-cylinder pressure for combustion diagnosis of internal combustion engines,” Mechanical Systems and Signal Processing, vol. 24, no. 6, pp. 1767–1784, Aug. 2010.
[12] F. Payri, J. M. Luján, J. Martín, and A. Abbad, “Digital signal processing of in-cylinder pressure for combustion diagnosis of internal combustion engines,” Mechanical Systems and Signal Processing, vol. 24, no. 6, pp. 1767–1784, Aug. 2010.
[13] M. F. J. Brunt, H. Rai, and A. L. Emtage, “The Calculation of Heat Release Energy from Engine Cylinder Pressure Data,” SAE International, Warrendale, PA, 981052, Feb. 1998. [14] J. Jiang, F. Gu, R. Gennish, D. J. Moore, G. Harris, and A. D. Ball, “Monitoring of
diesel engine combustions based on the acoustic source characterisation of the exhaust system,” Mechanical Systems and Signal Processing, vol. 22, no. 6, pp. 1465–1480, Aug. 2008.
cylinder pressure from diesel engines using acoustic emission,” Mechanical Systems and Signal Processing, vol. 19, no. 4, pp. 751–765, Jul. 2005.
[16] S. Fernando, C. Hall, and S. Jha, “NOx Reduction from Biodiesel Fuels,” Energy Fuels, vol. 20, no. 1, pp. 376–382, 2005.
[17] I. Fluent, “FLUENT 6.3 User‟s Guide - 20.1.3 Thermal NOx Formation.” [Online]. Available:
http://hpce.iitm.ac.in/website/Manuals/Fluent_6.3/fluent6.3/help/html/ug/node763.htm. [Accessed: 15-May-2012].
[18] A. M. Mellor, J. P. Mello, K. P. Duffy, W. L. Easley, and J. C. Faulkner, “Skeletal Mechanism for NOx Chemistry in Diesel Engines,” SAE International, Warrendale, PA, 981450, May 1998.
[19] B. Tesfa, R. Mishra, C. Zhang, F. Gu, and A. D. Ball, “Combustion and performance characteristics of CI (compression ignition) engine running with biodiesel,” Energy, vol. 51, pp. 101–115, Mar. 2013.
[20] B. Tesfa, R. Mishra, F. Gu, and N. Powles, “Prediction models for density and viscosity of biodiesel and their effects on fuel supply system in CI engines,” Renewable Energy, vol. 35, no. 12, pp. 2752–2760, Dec. 2010.
[21] B. S. Chauhan, N. Kumar, and H. M. Cho, “A study on the performance and emission of a diesel engine fueled with Jatropha biodiesel oil and its blends,” Energy, vol. 37, no. 1, pp. 616–622, Jan. 2012.
[22] A. Monyem and J. H. Van Gerpen, “The effect of biodiesel oxidation on engine
performance and emissions,” Biomass and Bioenergy, vol. 20, no. 4, pp. 317–325, Apr. 2001.
[23] G. Knothe, A. C. Matheaus, and T. W. Ryan III, “Cetane numbers of branched and straight-chain fatty esters determined in an ignition quality tester☆,” Fuel, vol. 82, no. 8, pp. 971–975, May 2003.
[24] Monyem, J. H. Van Gerpen, and M. Canakci, “The effect of timing and oxidation on emissions from biodiesel-fueled engines,” Transactions of the American Society of Agricultural Engineers, vol. 44, no. 1, pp. 35–42, 2001.
[25] G. Labeckas and S. Slavinskas, “The effect of rapeseed oil methyl ester on direct injection Diesel engine performance and exhaust emissions,” Energy Conversion and Management, vol. 47, no. 13–14, pp. 1954–1967, Aug. 2006.
[26] M. Lapuerta, O. Armas, and J. Rodríguez-Fernández, “Effect of biodiesel fuels on diesel engine emissions,” Progress in Energy and Combustion Science, vol. 34, no. 2, pp. 198– 223, Apr. 2008.
[27] J. Xue, T. E. Grift, and A. C. Hansen, “Effect of biodiesel on engine performances and emissions,” Renewable and Sustainable Energy Reviews, vol. 15, no. 2, pp. 1098–1116, Feb. 2011.
![Table 1 Rate constants for thermal NOx formation [3]Rate constants Values [m3/(gmol s)]](https://thumb-us.123doks.com/thumbv2/123dok_us/331515.1034188/4.595.63.295.666.755/table-rate-constants-thermal-formation-rate-constants-values.webp)

![Table 4 Physical and Chemical properties of fuel [20] Property Units Diesel](https://thumb-us.123doks.com/thumbv2/123dok_us/331515.1034188/9.595.72.473.280.408/table-physical-chemical-properties-fuel-property-units-diesel.webp)


