Essays in International Trade and Organisational Economics
Frank Pisch
Thesis submitted to the Department of Economics of the London
School of Economics for the degree of Doctor of Philosophy, London,
I certify that the thesis I have presented for examination for the PhD degree of the London School of Economics and Political Science is solely my own work other than where I have clearly indicated that it is the work of others (in which case the extent of any work carried out jointly by me and any other person is clearly identified in it).
The copyright of this thesis rests with the author. Quotation from it is permitted, provided that full acknowledgement is made. This thesis may not be reproduced without my prior written consent.
I warrant that this authorisation does not, to the best of my belief, infringe the rights of any third party.
I declare that my thesis consists of approximately 36,000 words.
Statement of Conjoint Work
I confirm that Chapter 1 was jointly co-authored with Giuseppe Berlingieri and Claudia Steinwender and I contributed a minimum of 40 percent of this work. I confirm that Chapter 3 was jointly co-authored with Rabah Arezki and Thiemo Fetzer and I contributed a minimum of 30 percent of this work.
This thesis contains three chapters that examine various facets of how the market and technological environment shapes firms – and how firms shape their environments.
The first chapter studies how multinational manufacturing firms organise production in parallel processing supply chains. Using confidential data on international sourcing of French manufacturing firms and an instrumental variables strategy based on self-constructed input-output tables, the chapter shows that inputs that account for a high cost share – i.e. that are more important for technological reasons – are more likely to be produced by a multinational for itself, while unimportant ones are outsourced to third parties. It provides additional empirical evidence that this main finding is consistent with a property rights model of the boundary of the firm.
The second chapter produces empirical facts on how exogenous changes in tariffs on intermediate goods have affected vertical integration patterns in France over the period 1996-2006 and evaluates them in light of the current literature. Using a long differences approach and detailed information on supply relationships, it shows that more protection-ist policies by other countries and by the EU discouraged integrated relationships from shifting towards outsourcing and that initial market structure mattered for the impact of trade policy.
The third chapter provides rare causal evidence for the relevance of endowment driven comparative advantage. It uses the fracking boom in the US following 2006 as a source of exogenous variation in the endowment of natural gas – and therefore in energy: fracking made energy considerably cheaper in the US compared to the rest of the world. The chapter studies factor, output, and international trade responses across sectors. It finds that energy intensive sectors expand along all dimensions and, most importantly, export more, which validates one of the most important neo-classical theories of why countries trade with each other.
I want to thank my supervisor, Gianmarco Ottaviano for his invaluable support throughout our time at LSE. His approach to economic theory and economics in general is impressive and has left just such an impression on my academic work; I will hopefully never lose sight of it. Even more than for his input as it relates to this thesis, I am grateful for countless conversations, discussions, and even arguments – he has shaped me both as an academic and as a person.
I am furthermore highly indebted to Catherine Thomas and Pol Antras, who – perhaps even without noticing – have profoundly changed the way I work, and how I approach life, in academia.
More than any other person in my work life, however, I have to thank my co-authors and dear friends Claudia Steinwender and Giuseppe Berlingieri. Their support from the first day we met in our new office at Lincoln’s Inn Fields to this day has been indispensable and invaluable to me. Even during their busiest periods they have always taken plenty of their time for me, have taught me more than all my professors combined, and have showed me what may be possible, and how to reach it.
In addition, I want to extend a special ”thank you” to Thiemo Fetzer, Hanwei Huang, Fabian Hungerland and Michael Stops – for working very closely with me and making it a pleasure – as well as to Michel Azulai, Jason Garred, and Joao Pessoa. Countless others also deserve my fullest gratitude, among them Steve Pischke, Thomas Sampson, and Daniel Sturm; Stephan Maurer, Alessandro Sforza, Kirill Borusyiak, Jonathan Colmer, Miguel Espinosa, Eddy Tam, and Lisa Windsteiger.
It is unclear to me how I could have managed to finish my PhD without the administra-tive help of Mark Wilbor, Linda Cleavely, Jo Cantley, and Nigel Rogers. The same is true for the financial support I have received from the CEP, the LSE, and most importantly the German Academic Scholarship Foundation.
I want to thank my dear friends Lukas Boettcher, Antonia Allmendinger, and Tobias Buch for their friendship and love. My parents in law have provided me with inestimable appreciation throughout the PhD and have led me to understand my role as an economist
from a biological and a substantive perspective. Their liberal upbringing, focused on responsibility and living up to one’s potential, are the fertile soil upon which this work and my career have grown.
My life, however, revolves around my own family. My son David has improved this thesis – and its author – beyond compare and without my wife, her love, her friendship, and her help, none of thesis would exist. You two are my rock and my purpose.
1 Organizing Supply Chains:
Input Cost Shares and Vertical Integration 13
1.1 Introduction . . . 13
1.2 Empirical Strategy . . . 18
1.3 Data . . . 22
1.3.1 Data Sets and Summary Statistics . . . 22
1.3.2 Instrument: Input-Output Tables . . . 24
1.4 Results . . . 28
1.4.1 Main Specifications . . . 28
1.4.2 The Role of other Supply Chain Characteristics . . . 32
1.5 Theoretical Framework . . . 38
1.5.1 Baseline Model . . . 38
1.5.2 Extensions . . . 42
1.6 Conclusion . . . 47
Appendices 48 1.A Data Appendix . . . 48
1.B Complementary Tables . . . 50
2 Trade Policy and Vertical Integration: Empirical Evidence on Interme-diate Goods 60 2.1 Introduction . . . 60
2.2 Literature and Predictions . . . 68
2.2.1 Tariffs on Intermediates and Vertical Integration . . . 68
2.2.2 Market Structure . . . 70
2.2.3 Summary . . . 71
2.3 Empirical Strategy . . . 72
2.4 Data . . . 75
2.4.1 Data Sources and Variables . . . 75
2.5 Results . . . 82
2.5.1 Aggregate Effects . . . 83
2.5.2 Integrated vs. Outsourced Relationships . . . 86
2.5.3 Market Structure . . . 88
2.5.4 Mechanisms . . . 91
2.6 Conclusion . . . 92
Appendices 94 2.A Lagged Dependent Variable Concerns . . . 94
3 On the Comparative Advantage of U.S. Manufacturing: Evidence from the Shale Gas Revolution 96 3.1 Introduction . . . 96
3.2 Conceptual Framework . . . 103
3.2.1 Set-up and Industry Technology . . . 103
3.2.2 Consumers . . . 104
3.2.3 Firms . . . 104
3.2.4 General Equilibrium and Factor Price Equalization . . . 104
3.3 The Natural Gas Boom: Predictions . . . 105
3.3.1 The Domestic Economy: Factor Intensity and Output Effects . . . . 106
3.3.2 The Open Economy: International Trade . . . 108
3.4 Data . . . 111
3.4.1 Factor Allocation and Output Effects . . . 111
3.4.2 International Trade . . . 112
3.4.3 Energy Intensity . . . 113
3.5 Empirical Specification . . . 115
3.5.1 Factor Allocation and Output Effects . . . 115
3.5.2 International Trade . . . 116
3.6 Results . . . 118
3.6.1 Factor Allocation and Output Effects . . . 118
3.6.2 Trade . . . 122
3.7 Conclusion . . . 130
Appendices 132 3.A Data Appendix . . . 132
3.A.1 The Physics of Natural Gas Transportation . . . 132
3.A.3 Trade Data . . . 135
3.A.4 Energy Intensity from IO Tables . . . 135
3.B Tariffs . . . 137
3.C Theory and Simulation . . . 138
3.C.1 Model Solution . . . 138
3.C.2 Derivations and Proofs . . . 141
3.C.3 Quantitative Analysis . . . 143
3.D Exploiting Within-U.S. Natural Gas Prices . . . 145
1.1 Summary Statistics . . . 23
1.2 Baseline Correlations . . . 29
1.3 Baseline 2SLS . . . 30
1.4 Robustness 2SLS, Fixed Effects . . . 31
1.5 Headquarters Intensity . . . 33
1.6 Contracting Environment . . . 34
1.7 Scale . . . 35
1.8 Relationship Specificity . . . 36
1.9 Transfer Pricing . . . 37
1.10 Baseline 2SLS, First Stage . . . 50
1.11 Baseline 2SLS, Dropping Inputs Produced By Downstream Industry . . . . 50
1.12 Robustness 2SLS, Fixed Effects, First Stage . . . 51
1.13 Robustness 2SLS, Fixed Effects, Dropping Inputs Produced By Down-stream Industry . . . 51
1.14 Robustness 2SLS, Fixed Effects, OLS . . . 52
1.15 Headquarters Intensity, First Stages (1) . . . 53
1.16 Headquarters Intensity, First Stages (2) . . . 54
1.17 Headquarters Intensity, Main Effects . . . 55
1.18 Contracting Environment, First Stages . . . 56
1.19 Contracting Environment, First Stages . . . 57
1.20 Contracting Environment, Main Effects . . . 58
1.21 Contracting Environment, Main Effects . . . 59
2.1 Summary Statistics . . . 79
2.2 Summary Statistics cont’d . . . 80
2.3 Aggregate Effects . . . 84
2.4 Integration Status . . . 86
2.5 Market Structure (1) . . . 89
2.6 Market Structure (2) . . . 90
2.8 Bias in LDV Specification . . . 94
3.1 Energy Intensity and Relative Sector Size of Exporting NAICS3 Sectors according to 2002 IO Table . . . 114 3.2 Effect of natural gas price gap on energy intensive gross manufacturing
output, employment and capital expenditure between 2000 and 2013. . . . 119 3.3 Effect of natural gas price gap on energy intensive export, import values on
the extensive and intensive margin between 1997 and 2012. . . 123 3.4 Effect of Natural Gas Price Gap on Manufacturing Sector Exports:
Het-erogenous Effect by three digit NAICS sectors . . . 127 3.5 Robustness of Export Effect: Controlling for other sector cost shares, trends
and accounting for oil price gaps . . . 128 3.6 World-IO Table Energy Intensity Measures: Effect of natural gas price gap
on energy intensive export, import values on the extensive and intensive margin between 1997 and 2012. . . 130 3.7 IO Table Direct Natural Gas Consumption . . . 135 3.8 Effect of natural gas price gap on energy intensive gross manufacturing
output, employment and capital expenditure between 2000 and 2013. . . . 147 3.9 Effect of natural gas price gap on energy intensive export, import values on
the extensive and intensive margin between 1997 and 2012. . . 148 3.10 Effect of natural gas price gap on energy intensive export, import values on
the extensive and intensive margin between 1997 and 2012. . . 149 3.11 Robustness to removing border countries Canada and Mexico: Effect of
natural gas price gap on energy intensive export, import values on the extensive and intensive margin between 1997 and 2012. . . 150 3.12 Estimating the effect of US natural gas endowment proxied by estimated
recoverable reserves on energy intensive gross manufacturing output, em-ployment and capital expenditure between 2000 and 2013. . . 151 3.13 Estimating the effect of US natural gas endowment proxied by estimated
recoverable reserves on energy intensive export, import values on the ex-tensive and inex-tensive margin between 1997 and 2012. . . 152 3.14 Intensive margin effect of natural gas price gap on energy intensive export
and import values between 1997 and 2012. . . 153
on energy intensive export, import values on the extensive and intensive margin between 1997 and 2012. . . 153 3.16 Effect of natural gas price gap between U.S. states and the OECD Europe
on energy intensive gross employment and capital expenditure between 2000 and 2013. . . 154 3.17 Effect of natural gas price gap between U.S. states and OECD Europe on
energy intensive export, import values on the extensive and intensive margin between 1997 and 2012. . . 155 3.18 Effect of natural gas price gap on energy intensive export, import values
on the extensive and intensive margin between 1997 and 2012 (including agriculture, mining and other service sector trade captured in the trade data.156 3.19 Effect of natural gas price gap on energy intensive export tariffs. . . 157
1.1 The Role of Cost Shares for Vertical Integration . . . 15
1.2 Empirical Density of Input Cost Shares . . . 24
1.3 IO Tables . . . 27
1.4 Empirical Density of Direct Requirements . . . 28
2.1 Number of Active Restrictions (HS 6 digit Classification) . . . 61
2.2 Integration Variation . . . 81
2.3 Tariff (Within) Variation . . . 83
3.1 Evolution of estimated Natural gas reserves and absolute US-OECD Natural Gas Price Gap . . . 98
3.2 Evolution of the energy content of US Exports and absolute US-OECD Natural Gas Price Gap . . . 99
3.3 Evolution of the energy content of US Exports and absolute US-OECD Natural Gas Price Gap . . . 100
3.4 Non-parametric Regressions for National Outcomes . . . 121
3.5 Evolution of Natural Gas Price Gap and Exports . . . 125
3.6 Natural Gas Prices for Industrial use across the OECD Europe and the U.S. over time. . . 158
3.7 U.S. Natural Gas Production, Imports and Exports. . . 159
3.8 Crude Oil Prices for Brent (Europe) and WTI (US) over time. . . 159
3.9 Map of US States and Major US Shale Plays . . . 160
3.10 Simulations: Increase in US Energy Endowment . . . 161
3.11 We increase the relative US energy endowment from 0.5 to 1.5 and plot our variables of interest against the ratio ( ¯NU S/L¯U S)/( ¯NOECD/L¯OECD). . . 161
3.12 Non-parametric Regressions for National Outcomes . . . 162
Chapter 1
Organizing Supply Chains:
Input Cost Shares and Vertical
Integration
1.1
Introduction
Many characteristics shape how firms organize the activities required for producing a certain good or service. One of the most important choices is the firm boundary – whether to perform an activity in-house or procure from a third party – and economists have developed a profound understanding of some of the determinants behind such integration decisions. Financial and contracting institutions1, the degree to which agents are locked into a business relationship2, or the relative contributions of different parties to final output3 have been analyzed formally and shown to affect ”make-or-buy” patterns4. These insights are crucial: organizational choices influence incentives and help overcome frictions, thereby fuelling productivity in an economy.
Spurred by the rapid emergence of increasingly complex and global value chains, recent interest both on the part of researchers and policy makers has turned to understanding howtechnological features of such supply chains affect integration decisions.5 Antras and
1Prominent works include Acemoglu et al. (2009), Macchiavello (2012), Carluccio and Fally (2012), and
recently Eppinger and Kukharskyy (2017), as well as Nunn (2007).
2Relationship specificity is at the heart of incomplete contracting explanations of the firm, see Klein
et al. (1978), Williamson (1985). Review articles by Lafontaine and Slade (2007), Bresnahan and Levin (2012), and Legros and Newman (2014) provide a good overview of theoretical and empirical work.
3
See the original contributions by Grossman and Hart (1986) and Hart and Moore (1990). In the international context, see for example Antras (2003).
4A body of empirical work in organizational economics based on within industry or firm studies has
made points along similar lines, for example Monteverde and Teece (1982), Joskow (1985), Baker and Hubbard (2003), or Forbes and Lederman (2009).
5
Chor (2013) and Alfaro et al. (2015) point out that many (sections of) supply chains are inherently sequential – so that, in a particular order, one activity has to be completed before the next one can begin. This technological feature fundamentally shapes the incen-tives for firms located downstream of such a sequential supply chain to vertically integrate backwards into the chain. Baldwin and Venables (2013) christened such supply chains ”snakes”.
Many (sections of) supply chains, however, involveparallelprocessing. Here, activities are performed approximately simultaneously and in no particular order. For instance, let the observational unit be a car factory. A modern automobile consists of about 500 components,6 which are delivered to a factory and then combined in what is effectively a single production step.7 Clearly, the sequence of activities is no longer a feature that can affect integration incentives – a ”snake” has become a ”spider”.
Instead of relative upstreamness, such a parallel production technology has an in-herently different defining technological characteristic: the relative contribution of the individual activities towards downstream output and for simplicity we call it the ”tech-nological significance” of an input.8 Technologically significant inputs are those whose quality, quantity, or specification determines the value of output more than that of other inputs; they are ”key” inputs. In view of the ubiquity of such (sections of) supply chains – at the very least all assembly stages are parallel – how does technological significance affect a downstream firm’s incentives to vertically integrate its suppliers? Conditional on the ”snakes” that produce components, how do firms organize ”spiders”?
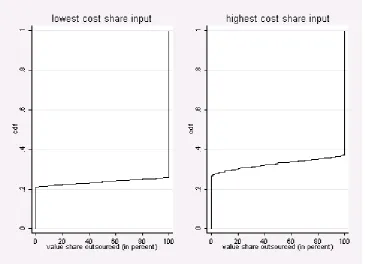
This paper gives an empirical answer to our research question. We use confidential micro data from France to observe the choice between outsourcing and vertical integration in import data that contain intra-firm shipment information (EIIG) for over 3000 firms, more than a hundred origin countries, and, crucially, for more than 1100 detailed inputs. We proxy technological importance by an input’s cost share in total – domestic plus foreign – intermediate expenditure. The vast majority of production functions that capture a ”spider” setting like ours produce a positive correlation between cost shares and the impact of upstream investments on final output, i.e. technological significance – at least conditional on input prices. We compare inputs with different cost shares sourced by the same firm to each other and relate this margin of heterogeneity to observed integration choices. As an illustration using just our raw data, in figure 1.1 we plot the empirical firm
6
The Wikipedia list of ”auto parts” contains a rough enumeration of the different components of an automobile and it has around 500 entries.
7
Of course, within the factory, there is, again, a defined sequence of tasks. When we refer to an economicallyparallelsupply chain, we address a production step that is, for all intents and purposes, too costly to be ”unbundled” any further and hence internal sequence is not relevant for make-or-buy decisions.
8
Figure 1.1: The Role of Cost Shares for Vertical Integration
Source: Manufacturing firm in EIIG, cross section in 1999.
level cdf’s as a function of the propensity to outsource, focusing only on the least and most important input by cost share on the left and right, respectively. While outsourcing is the prevalent sourcing mode overall, significantly more firms produce the most significant input at least partially in-house.
We employ an instrumental variables approach to show that this positive relation-ship between vertical integration and technological significance is in fact causal. Input cost shares are endogenous since (multinational) firms skew their sourcing towards their affiliates, price inputs at non-market value to avoid taxes on trade or profits, and ex-hibit substantial variation of procurement volumes from year to year, causing errors in variables in our cost shares.9 In order to address these concerns, we use self-constructed input-output (IO) coefficients at the industry level as a source of exogenous variation. IO tables capture technological relationships between industries that are stable over time and similar in many countries. We argue that these features allow us to identify the impact of technological significance on vertical integration.
Unfortunately, official IO tables for France, and in fact for most other countries, are only available at a very coarse, aggregate level, so that we would not be able to compare similar inputs to each other with this type of exogenous variation. Moreover, the official French IO tables are calculated on the basis of international trade flows connected to
9From a conceptual point of view, cost shares are only rough proxies of the underlying technological
the firms in our sample, which creates concerns about reverse causality. Consequently, we construct our own (import) IO tables from the universe of customs data for France and from industry information about the near universe of French firms participating in international trade. We can produce such micro IO tables for any feasible level of dis-aggregation and remove our EIIG firms.10
The main result of our work, and indeed of this paper, is a highly significant posi-tive relationship between vertical integration and technological significance in the data. This estimate is surprisingly robust to the inclusion of highly demanding fixed effects that address, among other confounders, the concern that our pattern may be driven by sequentiality within establishments. The role of technological significance is economically important: comparing an input that is at the mean of the cost share distribution to one that is wholly insignificant for production we find that the former is 6 percentage points more likely to be integrated, for an overall baseline share of vertical integration of 27 percent.
Next, using the same approach, we explore effect heterogeneity in cost shares on ver-tical integration with respect to headquarters intensity and the contracting environment. We want to stress that this exercise provides an empirical refinement of our key result that sheds light on the role of vertical linkages for multinational companies, making our findings highly relevant for policy makers. Using various proxies for headquarters intensity like capital, skill, and downstream service intensity, we show that significant inputs are almost twice as likely to be produced in-house in supply relationships with high headquar-ters intensity than those where instead the upstream suppliers hold the key to success. Moreover, technological significance pushes firms towards vertical integration particularly strongly if the upstream supplier resides in a country with capable contracting enforce-ment or if the inputs are easy to contract upon. These empirical findings are very much in line with the predictions of our stylized property rights model.11
We next examine what mechanisms may explain these empirical findings. In the past two decades, the property rights theory (PRT) of the firm has become the workhorse model for researchers in international trade that study the role of multinational firms.12 It is therefore a natural point of departure and we ask: what does a suitably generalized PRT framework predict about the vertical integration decision in a parallel processing setting?
10We intend to make these IO tables available on our web sites and recommend our approach to other
researchers, since the data required are nowadays accessible in many countries of the world.
11We also find strong evidence that larger downstream firms more readily integrate significant upstream
suppliers and that cost shares predict vertical integration for inputs subject to high import tariffs (which give more scope for transfer pricing). As anticipated in section 1.5.2, we find inconclusive evidence regarding the role of relationship specificity.
12
We analyze a stylized property rights model of the boundary of the firm with incomplete contracts in which a downstream firm decides whether or not to in-source any one of a number of upstream inputs it requires for production of a final good.13 Crucially, the inputs differ in how their quality impacts on the value of the final good; this is how we capture the concept of technological significance. We show that the make-or-buy decision weighs two different forces against each other. First, vertical integration distorts the upstream suppliers’ incentives to invest in quality under incomplete contracting, which has more adverse consequences for final output in the case of technologically significant inputs (the ”investment distortion effect”). This force pushes for outsourcing important suppliers and integrating marginal ones. However, suppliers of technologically significant inputs command higher bargaining power since falling out with them during ex post bargaining is very costly for the downstream firm (the ”bargaining power effect”). This force pushes towards integration of important suppliers. Our model’s prediction regarding make-or-buy is consistent with our empirical analysis iff the bargaining power effect dominates.14
Finally, we show that our stylized model delivers predictions that are highly consistent with our additional findings with respect to headquarters intensity and the quality of contracting institutions. First, the relationship between technological significance and vertical integration is particularly strong if the downstream firm has to make an important investment contribution to final output, since investment distortions even of key inputs are less of a concern. Moreover, if the upstream part of the supply relationship is located in a country with better contracting institutions or supplies inputs that are easy to contract upon, we expect a more positive effect of technological significance on integration, again because upstream investment distortions matter less.15
Our research is not only related to the substantial body of theoretical and empirical work that explores determinants of the make-or-buy decision in both organizational and international economics – where we directly contribute to a recent research effort to under-stand how supply chain characteristics shape organizational choice. We furthermore make progress regarding the anatomy of intra-firm trade. In particular, we draw attention to the fact that there is not only a skewed distribution of intra-firm sourcingacrossfirms,16 but also within: multinationals produce only the technologically most significant inputs in-house. Moreover, we complement the findings of Alfaro and Charlton (2009), who show that a large share of FDI is undertaken in vertical supply relationships.
13
In line with our research question, we omit the individual supply chains (potentially ”snakes”) that lead up to these inputs.
14
Our model is a natural reduced form generalization of the model by Antras (2003) and most property rights models would feature the same forces.
15
We also discuss informally how scale differences up- and downstream, relationship specificity, and transfer pricing considerations affect our relationship of interest, see section 1.5.2.
We are, in fact, not the first to notice that cost shares have a role to play in the context of vertical integration: Acemoglu et al. (2010) use direct requirements as measures for relative importance of upstream to downstream investment and show that they amplify the effect of RnD intensity on vertical integration in the UK. Their estimates of the
level effect of the direct requirement is consistent with our finding, but the focus of their research is on the interaction. Alfaro et al. (2015), using worldwide data on firms, include total requirements as a control in their regressions and also find a positive estimate of the coefficient. They focus, however, on the impact of relative upstreamness rather than cost shares. The fact that the broad idea behind our main finding appears to be relevant even in data sets from countries other than France (UK, worldwide) lends further support to our results.
We explain our empirical strategy in section 1.2, describe our data in section 1.3, and discuss our results in section 1.4. We then outline our conceptual framework and derive the predictions in section 1.5. We conclude with section 1.6.
1.2
Empirical Strategy
We compare the integration decisions of different inputs within a firm and therefore our regressions are all at the firm by input level. Our inputs are classified at the HS 4 digit level (roughly 1100 categories).
For a given HS 4 digit inputpwe relate the share of imports that a firmithat operates in industry j acquires from its (international) related parties in overall imports of that input from country c, intrashareijpc, to this input’s cost share across all intermediate
inputsinputsharejp.1718 We use the latter to capture the concept of technological
signifi-cance and while cost shares are certainly imperfect measures, we argue that they are good proxies that embody relative technological significance across inputs in a robust way for a wide range of production functions (conditional on input prices).
The baseline structural equation we estimate is
17
We have checked that the results are fully robust to using various other dependent variables. In particular, we define three binary variables. First, we define an integrated (as opposed to outsourced) flow as intrashareijpc ≥ 0.5. Second, we follow Corcos et al. (2013) in that a flow is within firm iff
intrashareijpc ≥ 0.8 and outside iff intrashareijpc ≤ 0.2. Finally, we count as fully integrated only
observations that haveintrashareijpc= 1, while observations withintrashareijpc= 0 count as outsourced.
It is not surprising to find very similar results with all these dummy variables, since few products at a highly disaggregated level are sourced with a mix of outsourcing and integration. This is in itself an interesting feature of the data: make-AND-buy strategies appear to be more prevalent at the firm, rather than at the product level in the cross section, see Loertscher and Riordan (2016) for a theoretical treatment of make-and-buy.
18
intrashareijpc=β1 inputshareip+αc+γi+φp+εijpc (1.1)
We include downstream firm i, input p, and sourcing country c fixed effects in our main specification. These specific intercepts ensure that we do not mistake any other input, country, or downstream firm specific characteristics that increase the likelihood of in-trafirm sourcing for the effect of the significance of inputs in a firm’s production function. In particular, we control for headquarters intensity of the downstream firm’s industry (in the literature often captured by capital or skill intensity) and the relationship specificity associated with, and the codifiability of, tasks required for the production of a particu-lar input. Moreover, we address all concerns about country specific gravity factors that influence the patterns of FDI, like distance, market size, multilateral resistance etc. The parameter of interest isβ1.
The key challenge to identification of β1 is that input cost shares are econometrically endogenous for at least four reasons. First, the denominator (the intrafirm trade share) of the dependent variable enters the numerator of the explanatory variable (the cost shares) and this may create mechanical correlation. Second, firms may substitute towards inputs produced by their foreign affiliates, for example to trigger increasing returns for them and maximize global profits, or because information frictions are less severe. Secondly, multi-national firms frequently engage in transfer pricing,19 which distorts input cost shares selectively in integrated relationships. In our setting, firms in relatively high tax France may charge inflated prices for inputs produced by foreign affiliates in order to artificially reduce their taxable income. Alternatively, transfer pricing is a way of alleviating the burden of tariffs. Finally, it is very likely that we measure input cost shares with con-siderable error in the sense that the values recorded in our data do not reflect the actual cost structures of our firms. Inventories may fluctuate significantly as a consequence of demand or supply shocks and as we estimate our regressions in a single cross section, inventory states distort input cost shares. Moreover, (international) trade is a relatively lumpy business due to fixed costs of ordering.20 Consequently, the cost shares we calcu-late from international trade data are subject to variation due to shipments arriving early or late with respect to a given accounting year. Finally, cost shares reflect technological input-output relationship only to some extent and depend on many other characteristics as well. In other words, cost shares are proxies for the concept we are interested in and consequently further attenuation over and above actual errors in variables is likely.
19
There is a substantial body of research that explores the nature and consequences of transfer pricing. For recent examples see Davies et al. (2017), Flaaen (2017), and the citations therein.
20
To address these challenges, we employ an instrumental variables strategy. In partic-ular, we use information from self constructed IO tables – which are closely related to industry level input cost shares – to instrument for the firm level cost shares. The details of how we construct them are given below in section 1.3. Industry level IO information needs to be excluded for identification, i.e. IO relationships affect organizational choice only through their effects on input cost shares. We argue that this assumption is likely to hold, since IO tables capture broad features of the underlying production technology and are, in particular, not affected by individual (French) firms.
We estimate equation (1.1) with two stage least squares (2SLS) and allow the error term to be correlated across all observations belonging to the same downstream industry and across all observations belonging to the same upstream input category (HS4).
We explore the robustness of our 2SLS results – and therefore the exclusion restriction – and consecutively introduce
• origin country by downstream industry cj fixed effects to rule out any effects that
stem from the interaction between financial development of the origin country and financial constraints.21
• origin country by input cp fixed effects to clean our estimates of country-specific
input price related factors that drive integration decisions.22
• highly disaggregated upstream by downstream industry interacted fixed effects23 in order to address concerns about
– relative upstreamness, so that we do not mistake sequential for parallel supply chains
– vertical spill-overs.
This changes the structural equation to
intrashareijpc=β1 inputshareip+αjc+γjp0+φpc+εijpc, (1.2)
wherep0 indicates inputs classified by more aggregate classifications than HS4.24
21See Acemoglu et al. (2009) and Eppinger and Kukharskyy (2017). 22
See Alfaro et al. (2016).
23
Note that we choose the resolution of these interacted fixed effects such that there is still some variation left in the instrument.
24
The interacted upstream by downstream industry fixed effects merit some more de-tailed discussion. Suppose we fix a particular downstream firm and compare the cost shares and integration decisions for HS4 inputs sourced by that firm. If we compare in-puts that are produced by the same 4 digit ISIC industry upstream, we ensure that relative upstreamness across the inputs is virtually identical with respect to the downstream firm or production stage. Even in a case where there are small differences left, we can still interpret the change in our estimate as indicative: if the coefficients remain unchanged, it is unlikely that sequentiality plays an important role.
We next investigate key aspects of supply chains that provide additional empirical evidence a) as to which parts of supply chains are most susceptible to a strong influence of technological significance on make-or-buy decisions (a more descriptive point) and b) about which model of the boundary of the firm could potentially explain the relationship between cost shares and vertical integration. To do so, we interact our variable of interest,
inputshare, with proxies for the determinants we are interested in, generically denoted by
characteristicijpc. The structural equation for these exercises is
intrashareijpc=β1 inputshareip+β2 inputshareip×characteristicijpc
+αc+γi+φp+εijpc. (1.3)
We study five different groups of determinants and give more detail in the data section 1.3 below. Most importantly we study the impact of headquarters intensity – assuming that the downstream firm makes relationship specific investments that affect output – and the role of the quality of contracting institutions. Moreover, we are interested in fixed cost explanations for the relationships we find and study proxies for downstream firm scale. Finally, we investigate relationship specificity and transfer pricing.
At this point, we also want to highlight that all measures vary, alternatively, at the firm, downstream industry, upstream industry, origin country, or origin country by product level. Consequently, we can capture the main effects characteristicijpc by appropriate
fixed effects and omit them in equation (1.2). In all specifications we instrument both the main effect of inputshare and its interaction with the supply chain characteristic. Finally, characteristicijpc is always an indicator variable that takes the value one iff the
1.3
Data
In this section we introduce the data that we use to estimate our empirical models. We proceed by giving details on the main data sets we use and showing a range of summary statistics. We then turn to our instrumental variable and the construction of our own import IO tables.
1.3.1 Data Sets and Summary Statistics
First, we use the Enquete Echanges Internationaux Intragroupe (EIIG) (a single cross section in 1999) to obtain information about intra-firm trade of French firms.25 The targeted survey population included every French firm whose annual trade volume is at least one million Euros and who is owned by a manufacturing group that controls at least 50% of a foreign firm. Out of this target population (8,236 businesses) roughly half of all firms responded. These 4,305 firms account for about 80% of French trade conducted by French multinational entities.
Corcos et al. (2013) point to the fact that the EIIG survey suffered slightly from non-response. They also show that this poses a significant problem since their results change meaningfully when they apply a selection correction. Fortunately, our estimates are unaffected by this concern because we use within firm variation.
For each responding firm, the EIIG has information about the value share of imports from related parties for each HS 4 digit product that the firm imports, by country of origin. In our final sample we focus on imports by the EIIG manufacturing firms (ISIC Rev. 3 codes 15 to 37).26
We supplement these trade data with information from the Enquete annuelle d’Entreprise (EAE), which provides us with balance sheet data on all French firms with more than 20 employees and a random sample of smaller firms. We use these data to obtain total ex-penditure on intermediate inputs and to construct empirical measures of supply chain characteristics.
Table 2.1 reports summary statistics for the firms in our data. There are about 3,000 firms in the final sample. The first row reports the unweighted import share from affiliated parties across all products and destinations: The average firm in our sample carries out 27% of its transactions across products and destinations inside the boundary of the firm.
25Other work that uses this data set includes, notably, Carluccio and Fally (2012), Corcos et al. (2013),
Defever and Toubal (2013), and Carluccio and Bas (2015).
26The EIIG survey data were amended with official international trade data by the administrators of
However, the distribution of intra-firm trade is rather skewed towards few, large companies reporting a larger share of intra-firm transactions: The median firm imports only 9% of its transactions from affiliated parties.27 Moreover, it can be seen that the typical firm will contribute to our estimates since it sources a significant number of different inputs.
Finally, consistent with the target population of the EIIG, our firms are relatively big. Selection of only the biggest, most productive companies into multinational activity is a well known fact. In this paper we use firm fixed effects throughout to address sample selection bias that may arise. Given the data we use, our results have to be interpreted as conditional on international sourcing and internalization decisions: since we only observe trade flows associated with firms that are already multinational companies, our findings are silent about the extensive margin of FDI and, indeed, domestic sourcing behavior. At the same time, multinationals account for a vastly disproportionate amount of economic activity, including international trade, and therefore we are convinced that this research is an important contribution.
An ANOVA shows that the overall variation in intra-firm trade shares is largely ex-plained by across firm differences (48 % of partial sum of squares), while the product (3 %) and country (1 %) margins do not contribute very much. The residual is consequently relatively large and even with our baseline fixed effects, we are hopeful to obtain precise and widely applicable estimates.
Table 1.1: Summary Statistics
mean median sd count
Average Intra-Firm Trade Share 0.27 0.09 0.34 3157
Average Number of Products 10 7 12 3157
Employment 467 198 1,186 3107
Sales 160.1k 38.8k 1,136.7k 3155
Capital Intensity 900 450 7100 3103
Intangible Cap. Int. 105.7 17.5 1020.7 2971
Skill Intensity 184.8 171.9 71.4 3103
TFP Wooldridge (ln) 1.53 1.24 1.16 3003
The second key ingredient of this paper is a proxy for technological significance and we have chosen to use intermediate input cost shares. More important inputs are therefore those on which a firm spends more. We calculate inputcostshareip as
inputshareip= P
cimportsipc totcosti
whereimportsipc is the total value of all imports by firm iof inputp from country c and totcosti is total expenditure on intermediate goods by firmitaken from the EAE. Figure
Figure 1.2: Empirical Density of Input Cost Shares
1.2 shows the empirical density of the input cost shares at the firm-by-input level. For this main regressor, an ANOVA shows that about 29 % of the total sum of squares can be attributed to firm differences, while only 14 % can be traced to across product differences.
One may be worried that our results suffer from the fact that we use a selection of sourcing transactions, namely those from international trade partners. The ramifications could either be loss of external validity or genuine bias. To address these concerns we use several different normalizations for our input cost share that take account of different import propensities of firm-input pairs. We check that our results are fully robust to using either spending on foreign sourced intermediates or total costs (value added plus intermediate spending) instead of total intermediate costs in the calculation of the input cost shares. Moreover, we argue that, even if our results apply only to international sourcing, we still capture interesting patterns for multinational firms (as well as FDI and intra-firm trade flows).
1.3.2 Instrument: Input-Output Tables
In principle, IO tables are readily available for most countries and France is no ex-ception. However, arguably the most commonly used and familiar one, the official 2 digit ISIC Rev. 3 domestic French table for the year 1999 satisfies neither of our requirements. For the purpose of this paper, ”domestic” refers to an IO table that contains domestic transactions alongside international trade. It is therefore the standard IO table most re-searchers use and we call it ”domestic” in order to differentiate it from those tables that contain only (import) trade flows. Clearly, the domestic IO table captures mostly domes-tic transactions and, together with a high level of aggregation, makes for a weak(er) first stage. Unfortunately, there are no disaggregate tables available for France (unlike for the U.S.).
We therefore construct our own IO tables for the year 1999 from transaction level import data for the whole of France.28 For 4 digit NAF 199329industry codes of all trading firms we rely on the FICUS database, which contains balance sheet and administrative information for the near universe of French enterprises. The customs data are matched to this firm information with a success rate of 91%. Finally, we use balance sheet information to obtain gross output by NAF industry and compute the import direct requirements at the NAF - HS 4 digit level.30, 31 Since these tables are constructed directly from micro data, we name them ”micro” tables.
We perform two additional modifications to improve our instrument further. First, when computing the industry level intermediate costs, we leave out a firm’s own trade flows, effectively creating firm specific IO tables.32 Second, we compute the table for 1996: to the extent that import IO tables capture mostly the underlying technological substitution patterns across inputs (and hence their technological significance), the 1996 direct requirements are good predictors of 1999 input cost shares, while arguably being less suspicious of causing reverse causality or other problems.
Figure 1.3 illustrates the variation in four of our IO tables. The upper left graph is well known: at the 2 digit level, by far most of the transaction volume takes place on the main diagonal, while only few, usually proximate sectors are connected off the main diagonal. Our 2 digit table constructed from micro data replicates this pattern very well – an observation we interpret as validation for our approach. As expected, we do find a few differences between the first two tables, which relate to the fact that we do not make
28We plan to make our French import IO tables available on our websites for the future use of researchers. 29
NAF is the French industry classification and slightly more disaggregate than ISIC or NACE.
30More detailed information can be found in Appendix 1.A. 31
For robustness we also use domestic 2002 benchmark IO tables from the US, which we convert from 6 digit US IO classification to 4 digit ISIC. Such a conversion has certain limitations and hence we only use them sparingly.
32
any strong assumptions regarding tradability and simply let the actual trade transactions speak.
Constructing the tables at a more disaggregate level has two effects. First, the diag-onal becomes relatively ”thinner”. Secondly, the elements off the diagdiag-onal exhibit more ”contrast”. In other words, the cells now have clear borders and stand out properly from the background. Econometrically, we reduce measurement error and bring the relevant variation to the fore.
1
27
Figure 1.4: Empirical Density of Direct Requirements
The actual instrument we use below is not the direct requirement itself, but a categor-ical variable indicating quantiles of the direct requirement distribution. Figure 1.4 shows the empirical density of our self constructed import requirements. It is very skewed to the left and even the median is relatively small (remember that we normalize by gross output). The vertical lines indicate quintiles and our preferred instrument is a variable that takes the value 5 whenever the direct requirement of downstream industry j with respect to upstream input p falls into the segment V, value 4 if it falls into IV, and so on. In this way we semi-parametrically capture the skewed distribution of the requirements and make the instrument more robust to both measurement error and endogeneity concerns.
When assessing the variation in the instrument, a large part (about 22 %) is explained by input differences, while only a small part comes from downstream industry ones (about 5 %).
1.4
Results
1.4.1 Main Specifications
difference grows to 43 percent for the most crucial input, always over a baseline probability of 27 percent.
Table 1.2: Baseline Correlations
(1) (2) (3) (4) (5)
VARIABLES intra-firm intra-firm intra-firm intra-firm intra-firm
share share share share share
inputshare 3.730*** 3.865*** 2.973*** 4.174*** 2.771*** (0.494) (0.501) (0.351) (0.468) (0.312)
Country FE YES YES
Firm FE YES YES
HS4 product FE YES YES
Observations 84,643 84,643 84,643 84,643 84,643
R-squared 0.017 0.036 0.542 0.096 0.580
The dependent variable is the input by firm level share of intra-firm import value in total import value. The regressor is the firm by input level cost share in total expenditure on intermediates. Standard errors in parentheses are two-way clustered at the downstream NAF industry and at the upstream HS input level. ***p <0.01, **p <0.05, *p <0.1.
As discussed above, however, these estimates suffer from endogeneity and we proceed by instrumenting the input cost share with our quintile instrument. Table 1.3 reports the 2SLS results and the first stage table 1.10 can be found in Appendix 1.B.33 To illustrate the rationale for our instrument, we start by instrumenting the input cost share with a quintile variable based on the official 2 digit import IO tables for France in 1999 – the corresponding result is reported in column (1). We then use our self constructed IO table in column (2), the same table for 1996 in column (3), and the 1996 self-constructed table without any EIIG trade flows in column (4). Finally, in column (5), we report the 2SLS estimate with an instrument for which we first predict our self-constructed 1999 French IO table with the 2002 domestic U.S. benchmark IO tables provided by the BEA and then calculate the quintile variable.
The key result from these regressions – and indeed of this paper – is that, irrespective of the IO table and hence variation used, we obtain almost identical 2SLS estimates that are highly significant and positive. Our (weakly) preferred instrument is the one used in column (3), since it provides a good balance between a strong first stage and plausibly exogenous variation for identification of β1. Using this preferred specification and comparing a wholly insignificant input to one that lies at the median of the cost share distribution we find that the latter is roughly half a percentage point more likely to be produced in-house, while the most important input overall is a staggering 141 percent
33
Table 1.3: Baseline 2SLS
(1) (2) (3) (4) (5)
VARIABLES intra-firm intra-firm intra-firm intra-firm intra-firm
share share share share share
inputshare 8.664*** 8.696*** 9.087*** 9.236*** 8.832***
(1.914) (1.144) (1.254) (1.183) (1.573)
Country FE YES YES YES YES YES
Firm FE YES YES YES YES YES
HS4 product FE YES YES YES YES YES
Instrument Official Micro Micro Micro Micro
import 1999 1996 1996 1996
2dig excl own firm excl own firm excl EIIG U.S. predicted
Observations 78,237 78,237 78,237 78,237 78,237
R-squared 0.561 0.560 0.558 0.557 0.560
F-stat 1st stage 67.53 253 219.9 149.1 92.07
The dependent variable is the input by firm level share of intra-firm import value in total import value. The regressor is the firm by input level cost share in total expenditure on intermediates. The instrument is a categorical variable that indexes quintile bins of the direct requirements distribution of the respective IO table. Standard errors in parentheses are two-way clustered at the downstream NAF industry and at the upstream HS input level. ***p <0.01, **p <0.05, *p <0.1.
more likely to be integrated.34
We next show that these estimates are highly robust to a range of very demanding fixed effects by estimating specification (1.2). We are particularly interested in the stability of
ˆ
β1, because it gives an insight as to a) the variation used for estimation and b) the exclusion restriction. Using different kinds of variation to estimateβ1sheds light on the generality of our findings, while accounting for more and more unobserved factors through flexible fixed effects regressions, we test whether there are immediate concerns regarding the exclusion restriction in the benchmark specification.
Table 1.4 reports the results.35 Column (1) repeats the baseline regression for a com-mon sample across columns (1) to (3), while column (2) contains the results when we add the interacted downstream industry by country and upstream input by country ef-fects. Columns (3) and (4) are the most demanding baseline specifications we run. First, we fix a particular HS 4 digit input and compare its cost shares and integration choices
34
We implement one further robustness check on these baseline results: we estimate the baseline speci-fication with Logit IV, rather than the linear probability model, to take into account that our dependent variable is largely a binary variable. The results are remarkably robust. Moreover, we either drop final goods according to the UN classification based on BEC or remove firms that report more than 5 percent of their total sales in the ”wholesale” industry category according to the EAE. In both cases, we find slightly stronger results, which alleviates concerns regarding mere importing of final goods and carry-along trade. Finally, one may be worried that ownership decisions have been made according to the total requirement of an upstream product for downstream production and that the sourcing decisions we observe reflect these, rather than cost shares. To alleviate this concern, we include total requirements directly in our regressions as a control. The point estimates are slightly smaller throughout, but not significantly so, and the first stages become somewhat weaker.
35
across firms in the same NAF downstream industry. Secondly, we fix a particular firm and compare cost shares and integration patterns across all inputs produced by a particular 4 digit ISIC industry. Remarkably, the estimates in columns (2), (3), and (4) are virtually indistinguishable from our preferred baseline result, even if we restrict the identifying vari-ation to be within highly detailed input-output relvari-ationships. Most notably, conditioning on roughly equivalent relative upstreamness of the inputs relative to the downstream in-dustry leaves the results unchanged and hence addresses concerns that our pattern may be caused by sequentiality rather than technological significance in parallel processing settings.
Table 1.4: Robustness 2SLS, Fixed Effects
(1) (2) (3) (4)
VARIABLES intra-firm intra-firm intra-firm intra-firm
share share share share
inputshare 11.191*** 12.754*** 8.376*** 8.260***
(1.336) (1.389) (2.893) (2.593)
Country FE YES
Firm FE YES YES YES
HS4 product FE YES
Country*HS4 product FE YES YES YES
Country*Ind 4dig FE YES YES YES
Firm*Up Ind 4 dig YES
Ind 4dig * HS4 product FE YES
Instrument Micro Micro Micro Micro
1996 1996 1996 1996
excl own firm excl own firm excl own firm excl own firm
Observations 71,999 71,999 71,999 67,002
R-squared 0.553 0.642 0.740 0.821
F-stat 1st stage 210.6 233 49.55 51.01
The dependent variable is the input by firm level share of intra-firm import value in total import value. The regressor is the firm by input level cost share in total expenditure on intermediates. The instrument is a categorical variable that indexes quintile bins of the direct requirements distribution of our self constructed 1996 import IO table. Standard errors in parentheses are two-way clustered at the downstream NAF industry and at the upstream HS input level. ***p <0.01, **p <0.05, *p <0.1.
1.4.2 The Role of other Supply Chain Characteristics
We now turn to analyzing empirically how five characteristics of supply chains affect the relationship between technological significance and vertical integration. We ask: in which supply chains do we expect our mechanism to be strongest? What model of the firm is likely to be consistent with empirical firm behavior?
In doing so, we emphasize our results on headquarters intensity and the contracting environment, since these are particularly germane to distinguishing between mechanisms related to property rights models and since they play an important role in the global supply chains of multinational firms.
Headquarters Intensity
We implement an empirical test by estimating equation (1.3). As is common in the literature, we proxy headquarters intensity alternatively by physical or intangible capital intensity, skill intensity, or service intensity at the downstream firm, which we directly call HQ intensity for short. The details of how we construct these variables can be found in the data Appendix 1.A. Since all measures are at the firm level, we compute the median dummies within NAF industries.
The results are reported in table 1.5.36 All interactions are significant and positive.37 Consequently, we argue that supply relationships where the downstream party contributes a lot to output are those where high cost shares more strongly increase the likelihood of intra-firm sourcing. These typically include bottleneck industries as well as those that manufacture components from raw materials.
As in all our exercises in this subsection we use a dummy for whether a given down-stream firm’s characteristic is above or below the median in an appropriate category, in the case of table 1.5 a four digit industry. In addition to making the estimates more robust to functional form mis-specification, this addresses concerns of reverse causality. We have conducted two robustness exercises. First, one may still be concerned about endogeneity and we have repeated the exercise at the industry level with co-variates from 1996, i.e. with dummies equal to one if a four digit industry’s characteristic was above the within 2 digit industry median in 1996. The results are less strong due to the loss in variation, but remain at least weakly significant throughout. Moreover, one may be concerned that our proxies for headquarters intensity may reflect productivity or firm size rather than headquarters intensity. To alleviate this worry we have included (and instrumented) an
36
The first stage results, a table including the main effects of the supply chain characteristics, and the OLS estimates can be found in Appendix 1.B. The same applies to the contracting environment results below. Complementary tables for the remaining three exercises are available upon request.
37
Table 1.5: Headquarters Intensity
(1) (2) (3) (4) (5)
VARIABLES intra-firm intra-firm intra-firm intra-firm intra-firm
share share share share share
inputshare 8.198*** 8.140*** 7.966*** 8.389*** 4.970***
(1.271) (1.372) (1.108) (1.143) (1.485)
×1(Capital Intensity)i 2.523* 2.126
(1.442) (1.428)
×1(Intangible Cap. Int.)i 3.345** 2.900*
(1.597) (1.614)
×1(Skill Intensity)i 3.228** 2.097
(1.608) (1.591)
×1(Service Intensity)i 2.289 2.026
(1.453) (1.439)
Country FE YES YES YES YES YES
Firm FE YES YES YES YES YES
HS4 product FE YES YES YES YES YES
Observations 79,995 79,995 79,995 79,995 79,995
R-squared 0.550 0.550 0.549 0.551 0.549
KP-stat 1st stage 132.7 133.6 106.5 133.7 34.94
Instruments Micro 1996 excl own firm and interactions
The dependent variable is the input by firm level share of intra-firm import value in total import value. The regressors are the firm by input level cost share in total expenditure on intermediates and its interaction with an indicator equal to one if the respective measure of headquarters intensity is above the within NAF industry median. The instruments are a categorical variable that indexes quintile bins of the direct requirements distribution of our 1996 micro import IO table and its interaction with an indicator equal to one if the respective measure of headquarters intensity is above the within NAF industry median. Standard errors in parentheses are two-way clustered at the downstream NAF industry and at the upstream HS input level. ***p <0.01, **p <0.05, *p <0.1.
interaction of a median employment dummy as a measure of firm size with the cost share variable. Again, the results are slightly weaker, but remain strongly positive and at least significant.
Contract Intensity
We again work with the empirical model in equation (1.3) and choose two country level variables, a rule of law index and an index of intellectual property rights protection. Moreover, we compute a measure of contract intensity at the downstream firm level and two such measures at the downstream industry level, the former of which is similar to the firm level one, while the latter is routineness of the tasks performed upstream to produce the input. All details can be found in the data Appendix 1.A. We highlight that these variables capture different sources of contract incompleteness and that, if all have similar effects, these results are particularly convincing.
[image:34.595.137.523.306.575.2]Table 1.6 reports our estimates. It is noteworthy that all effects are positive and strongly statistically significant. Moreover, these impacts are big: a high quality of con-tracting institutions or low contract intensity almost doubles the effect of input cost shares.
Table 1.6: Contracting Environment
(1) (2) (3) (4) (5) (6)
VARIABLES intra-firm intra-firm intra-firm intra-firm intra-firm intra-firm
share share share share share share
inputshare 5.608*** 5.143** 7.868*** 7.699*** 7.067*** -1.470 (1.831) (2.075) (1.177) (1.491) (1.561) (2.523)
×1(Rule of Law)c 4.318** 2.057
(1.884) (2.142)
×1(IPR Protect.)c 4.886** 2.889
(2.138) (2.488)
×1(Contr. Int. Firm)i 3.794** 3.601**
(1.609) (1.611)
×1(Contr. Int. Industry)j 5.175** 5.285**
(2.133) (2.152)
×1(Upstr. Routineness)p 4.349** 4.288**
(2.089) (2.051)
Country FE YES YES YES YES YES YES
Firm FE YES YES YES YES YES YES
HS4 product FE YES YES YES YES YES YES
Observations 82,950 82,950 82,950 82,950 82,950 82,950
R-squared 0.552 0.552 0.550 0.551 0.549 0.547
KP-Stat 1st stage 139.7 141.2 118.7 144.9 105.4 32.58
Instruments Micro 1996 excl own firm and interactions
The dependent variable is the input by firm level share of intra-firm import value in total import value. The regressors are the firm by input level cost share in total expenditure on intermediates and its interaction with an indicator equal to one if the respective measure of contracting institutions or contract intensity is above the country, within NAF industry, or across NAF industry median. The instruments are a categorical variable that indexes quintile bins of the direct requirements distribution of our 1996 micro import IO table and its interaction with an indicator equal to one if the respective measure of contracting institutions or contract intensity is above the country, within NAF industry, or across NAF industry median. Standard errors in parentheses are two-way clustered at the downstream NAF industry and at the upstream HS input level. ***p <0.01, **p <0.05, *p <0.1.
Fixed Costs, Relationship Specificity, Transfer Pricing
level that allows for comparing the set-up costs of affiliates to the costs of outsourcing in the same country. However, our data readily supply us with firm size measures, namely productivity, employment, and total revenues, so that we can gauge how they interact with technological significance.
[image:35.595.179.477.327.568.2]The results from estimating (1.3) with these measures are reported in table 1.7. While the relationship between technological significance and vertical integration is statistically significantly stronger for large firms, column (4) suggests that even among relatively smaller and less productive firms still manage to maintain subsidiaries in other coun-tries to produce inputs by themselves. In the light of the sample we use this may not come as a surprise, since we condition on multinational firms, which have already selected into both trading and FDI. Consequently, the difference between fixed costs of outsourcing and integration is likely to be manageable even by relatively smaller firms.
Table 1.7: Scale
(1) (2) (3) (4)
VARIABLES intra-firm intra-firm intra-firm intra-firm
share share share share
inputshare 8.182*** 6.519*** 6.781*** 5.527***
(1.294) (1.118) (1.137) (1.238)
×1(Wooldridge TFP)i 3.026** 1.967
(1.482) (1.560)
×1(Employment)i 4.978*** 3.664*
(1.476) (1.913)
×1(Sales)i 4.408*** 1.227
(1.471) (1.885)
Country FE YES YES YES YES
Firm FE YES YES YES YES
HS4 product FE YES YES YES YES
Observations 82,950 82,950 82,950 82,950
R-squared 0.551 0.552 0.551 0.552
KP-stat 1st stage 115.4 132.6 132.5 56.23
Instruments Micro 1996 excl own firm and interactions The dependent variable is the input by firm level share of intra-firm import value in total import value. The regressors are the firm by input level cost share in total expenditure on intermediates and its interaction with an indicator equal to one if the respective measure of scale is above the within NAF industry median. The instruments are a categorical variable that indexes quintile bins of the direct requirements distribution of our 1996 micro import IO table and its interaction with an indicator equal to one if the respective measure of scale is above the within NAF industry median. Standard errors in parentheses are two-way clustered at the downstream NAF industry and at the upstream HS input level. ***p <0.01, **p <0.05, *p <0.1.
and intricate and thereby less valuable in other relationships – we include a measure of input complexity.
[image:36.595.176.482.266.503.2]Table 1.8 reports the results from estimating (1.3) with the slight deviation that we do not compute above or below median indicators for the input specific measure of relationship specificity; it is already a dummy variable. While all point estimates are slightly positive, none of them are significant due to relatively large standard errors.38 The explanation may partially be that the relationship specificity variables based on the Rauch measure are highly skewed towards differentiated products, so that there is little variation on the right hand side.
Table 1.8: Relationship Specificity
(1) (2) (3)
VARIABLES intra-firm intra-firm intra-firm
share share share
inputshare 9.475*** 9.044*** 8.351***
(1.526) (1.993) (1.749) ×1(Rauch Differentiated)p 0.399
(1.875)
×1(Upstr. Rel. Specificity)p 0.961 (2.250)
×1(Harvard Complexity)p 1.869
(2.072)
Country FE YES YES YES
Firm FE YES YES YES
HS4 product FE YES YES YES
Observations 82,950 82,950 82,950
R-squared 0.551 0.552 0.551
KP-stat 1st stage 70.39 49.01 117.8
Instruments Micro 1996 excl own firm and interactions The dependent variable is the input by firm level share of intra-firm import value in total import value. The regressors are the firm by input level cost share in total expenditure on intermediates and its interaction with an indicator equal to one if the respective measure of relationship specificity is above the across downstream NAF industry or across upstream ISIC industry median (note: the Rauch measure is already a dummy). The instruments are a categorical variable that indexes quintile bins of the direct requirements distribution of our 1996 micro import IO table and its interaction with an indicator equal to one if the respective measure of relationship specificity is above the across downstream NAF industry or across upstream ISIC industry median (note: the Rauch measure is already a dummy). Standard errors in parentheses are two-way clustered at the downstream NAF industry and at the upstream HS input level. ***p <0.01, **p <0.05, *p <0.1.
Finally, we are interested in the role of input cost shares in the face of tariffs and hence the potential to price intra-firm transactions at non-market values. This wide-spread practice is relevant for global supply chains in that tariffs are obvious choice variables for governments if they want to attract – or repulse – multinational companies.
38
We use effectively applied ad valorem import tariffs imposed by the European Union whose customs union France is a member country of. Effectively applied tariffs are MFN tariffs towards WTO member countries unless preferential agreements stipulate a lower rate towards a given country. Table 1.9 contains the estimates from equation (1.3), where we rely on both the maximum tariff charged within an HS code and a simple average over several tariff lines across all lines in a given HS code. We aggregate up to the 4 digit level using French import data from 1996. The estimates are at least marginally statistically significant and positive.
Table 1.9: Transfer Pricing
(1) (2) (3)
VARIABLES intra-firm intra-firm intra-firm
share share share
inputshare 9.802*** 9.920*** 9.642***
(1.532) (1.677) (1.663)
×1(Eff. Appl. Tariff (Max))cp 3.876* 2.830
(2.066) (3.192)
×1(Eff. Appl. Tariff (Average))cp 3.555 1.319 (2.199) (3.426)
Country*HS4 product FE YES YES YES
Country*Ind 4dig FE YES YES YES
Firm FE YES YES YES
Observations 76,359 76,359 76,359
R-squared 0.632 0.632 0.632
KP-stat 1st stage 145.9 146 101.9
Instruments Micro 1996 excl own firm and interactions The dependent variable is the input by firm level share of intra-firm import value in total import value. The regressors are the firm by input level cost share in total expenditure on intermediates and its interaction with an indicator equal to one if the respective measure transfer pricing poten-tial is above the across country by input median. The instruments are a categorical variable that indexes quintile bins of the direct requirements distribution of our 1996 micro import IO table and its interaction with an indicator equal to one if the respective measure transfer pricing potential is above the across country by input median. Standard errors in parentheses are two-way clustered at the downstream NAF industry and at the upstream HS input level. ***p <0.01, **p <0.05, *p <0.1.
Summary of the Empirical Findings
Our empirical findings suggest that there is a robust, and economically large, positive relationship between cost shares of an input and the probability that this input is made as opposed to bought. In other words, in parallel processing supply chain segments, (multinational) firms integrate vertically those inputs that contribute a lot to output – in other words, the technologically important ones – and tends to outsource production of marginal inputs.
plays an important role, the contracting environment is good, the downstream firm is big, and whenever EU import tariffs are high. There is no convincing evidence that relationship specificity plays a role.
1.5
Theoretical Framework
Having outlined the main contribution of this paper, we want to go one step further and explore what mechanisms may be behind, or consistent with, our findings. Any candidate framework will have to be able to replicate the empirical patterns we have provided in the previous sections. We can conceive of at least three candidate models of the boundary of the firm – a transaction cost model of supply assurance, a more general transaction cost framework with fixed costs, and a property rights model. As discussed in the introduction, there is a substantial body of empirical research belonging to the international trade literature on multinational firms that provides evidence at least consistent with, but most likely supportive of, the property rights framework. Consequently, it is natural to start with such a model and see if its predictions are consistent with our findings. This is the task we undertake in this section.
We want to stress that we do not a