R E S E A R C H A R T I C L E
Open Access
Depression and Anxiety in Patients with
Rheumatoid Arthritis: Prevalence rates based on a
comparison of the Depression, Anxiety and Stress
Scale (DASS) and the Hospital, Anxiety and
Depression Scale (HADS)
Tanya Covic
1,4*, Steven R Cumming
2, Julie F Pallant
3, Nick Manolios
4, Paul Emery
5, Philip G Conaghan
5and
Alan Tennant
5Abstract
Background:While it is recognised that depression is prevalent in Rheumatoid Arthritis (RA), recent studies have also highlighted significant levels of anxiety in RA patients. This study compared two commonly used scales, the Depression Anxiety and Stress Scale (DASS) and the Hospital Anxiety and Depression Scale (HADS), in relation to their measurement range and cut points to consider the relative prevalence of both constructs, and if prevalence rates may be due to scale-specific case definition.
Methods:Patients meeting the criteria for RA were recruited in Leeds, UK and Sydney, Australia and asked to complete a survey that included both scales. The data was analysed using the Rasch measurement model.
Results:A total of 169 RA patients were assessed, with a repeat subsample, resulting in 323 cases for analysis. Both scales met Rasch model expectations. Using the‘possible+probable’cut point from the HADS, 58.3% had neither anxiety nor depression; 13.5% had anxiety only; 6.4% depression only and 21.8% had both‘possible+probable’ anxiety and depression. Cut points for depression were comparable across the two scales while a lower cut point for anxiety in the DASS was required to equate prevalence.
Conclusions:This study provides further support for high prevalence of depression and anxiety in RA. It also shows that while these two scales provide a good indication of possible depression and anxiety, the estimates of prevalence so derived could vary, particularly for anxiety. These findings are discussed in terms of comparisons across studies and selection of scales for clinical use.
Background
Rheumatoid Arthritis (RA) is a multifactorial, chronic, inflammatory disease affecting primarily the joints with prevalence of between 0.5%-1% [1]. Pain, fatigue and disability, which may be considered as stress factors [2], are common challenges that may subsequently lead to psychological distress [3]. Depression commonly co-occurs with RA, in the range of 13% to 20% [4] and above [5] based on clinical assessments. Studies using
self report measures of depressive symptoms suggest considerably higher rates (i.e. 40%), although the levels of symptomatology may be subclinical [6]. Longitudinal studies suggest cumulative risk for depression and inter-mittent recurrence over time [i.e. 40% over 9 years; [7]]. The prevalence rates of depression in RA are well above those reported in the general community or primary care [8] but similar to other chronic conditions [9]. Depression in RA is associated with higher levels of dis-ease activity, pain, fatigue, work disability, health service use but lower treatment compliance [7,10] and increased suicide risk [11,12] and mortality [7,13].
* Correspondence: t.covic@uws.edu.au
1School of Psychology, University of Western Sydney, Australia
Full list of author information is available at the end of the article
Recent studies have also highlighted significant levels (21% to 70%) of anxiety in RA [5]. While there is a con-siderable overlap (i.e., 69% shared variance) between anxiety and depression and the levels of anxiety are higher when depression is present [14], the two are con-sidered to be distinctly separate constructs [15]. Some studies report higher prevalence of anxiety than depres-sion in RA [2,16], whereas others do not [5,17]. It is likely that depression and anxiety influence RA via dif-ferent mechanisms. A recent study found both to have a direct effect on pain, although the direct effect of anxi-ety was significantly higher than that of depression [18]. While anxiety appeared to increase exposure to stress, only depression influenced pain via stress. According to a tripartite model [15] it is possible that anxiety mani-fests through physical arousal, increased sensitivity to pain and/or interpretation of sensations as painful. Depression, through the absence of pleasure, may increase vulnerability to pain at times of stress [18] par-ticularly amongst those with repeated episodes of major depression [19]. This explanation is also consistent with a stress process model which suggests that vulnerability factors (such as anxiety and depression) may influence exposure or reaction to stress [20]. Thus, while closely linked, depression, anxiety and stress are proposed to be distinct.
Given the importance of effective screening for depression and anxiety in RA, it is essential to ensure that they are being appropriately measured with avail-able scales. Furthermore, it has been noted that the rates of depression and anxiety vary considerably across studies partly due to differences in assessment scales [5]. Those differences create difficulties in comparing results across studies and, for clinicians, in interpreting with confidence to what degree various scales may identify those who are at risk for depression or anxiety and require referral for further assessment [21].
To examine the degree to which measurements distin-guish depression, anxiety and stress, the current study sets out to co-calibrate two commonly used scales. The Depression, Anxiety and Stress Scale [DASS; [22]] and Hospital Anxiety and Depression Scale [HADS; [23]] will be statistically mapped and compared in terms of their construct independence and cut points. The DASS was developed in response to concerns about the poten-tial overlap between depression and anxiety [24], and to independently measure a third factor, stress, which is common to both of those constructs. The depression and anxiety subscales of the DASS are reported to be consistent with Clark and Watson’s [15] constructs of low positive affect and physiological hyper-arousal, although the correspondence of stressto their negative affect construct is unclear [25]. Psychometric studies, however, suggest that the DASS measures general
psychological distress while still maintaining some dis-tinction between the three separate constructs [26]. A number of factor analytic studies have examined the structure of the DASS, and in general confirmed a three-factor solution [e.g. [27]]. More recently however those traditional methods have been supplemented with modern techniques such as the Rasch measurement model [28]. A recent study used Rasch analysis to assess the short 21-item version of the DASS and found that three items needed to be removed and two subscales, anxiety and stress, appear to measure a single underly-ing construct [29].
The HADS has been extensively evaluated across various somatic, psychiatric and primary care popula-tions [30] and more recently, musculoskeletal [31], cancer [32], end stage renal disease [33] and RA [21] and found to distinctly measure depression and anxiety with two, seven-item subscales. The HADS was specifi-cally developed for use in primary or secondary health settings to exclude somatic items that may be reflective of the context (i.e. physical condition). It provides a well-established, valid and reliable measure for com-parison to the DASS. Both scales have been tested in terms of their screening ability and cut points against commonly accepted diagnostic gold standard such as the Diagnostic and Statistical Manual [33-35]. It is, however, recognised that detection of psychiatric con-ditions such as depression and anxiety is complicated by the comorbidity of physical conditions even when using diagnostic interviews based on DSM or ICD, unless modified [36,37]. For the purpose of this study HADS will be considered as an interim gold standard as it has been extensively validated across somatic and psychiatric populations in primary care and the general community [30] and is recommended for use in the physically ill [37].
By co-calibrating the items from both scales onto a single metric the three constructs, depression, anxiety and stress, will be mapped to: (a) compare the range of DASS depression and anxiety to that of the HADS scales; and (b) compare the two scales’cut points for depression and anxiety to determine if any variability may be due to scale-specific case definition.
Methods
Patients and setting
Participants’written consent was obtained in accordance with the Declaration of Helsinki.
Measurements
In addition to demographic data, the following scales were included in the study:
Depression Anxiety Stress Scales (DASS)
The Depression Anxiety Stress Scales (DASS) is a 42-item self-report measure of depression, anxiety and stress [22]. It consists of three 14-item subscales with each item scored on a 4-point Likert scale, ranging from 0 (did not apply to me at all) to 3 (applied to me very much, or most of the time). Total scores are calculated by summing the items on each subscale, giving a score range of 0-42 on each subscale. Scores above 20, 14 and 25 on the depression, anxiety and stress subscales respectively are indicative of severe levels [22]. The DASS shows good convergent and discriminant validity, and high internal consistency and reliability, with Cron-bach’s alpha reported at 0.94 for Depression, 0.87 for Anxiety and 0.91 for Stress [34].
Hospital Anxiety and Depression Scale (HADS)
The Hospital Anxiety and Depression Scale [HADS; [23]] is designed to measure both anxiety and depres-sion in out-patient populations. Each subscale comprises seven items which are rated on a four-point scale and scored from 0-3 with total scores therefore ranging from 0-21 for each subscale. Scores between 0 and 7 represent ‘no case’; 8 to 10 indicate‘possible case’ and 11 to 21 suggest a‘probable case of anxiety/depression’. These cut points have been validated against clinical interviews with sensitivity and specificity around 0.80 [30]. Recent studies have reported good internal consis-tency for both anxiety (0.89) and depression (0.86) sub-scales [38].
Rasch Analysis
Rasch analysis is a process to test if a set of data intended to be summated to give a total score satisfies the rules for constructing interval scale measurement [39]. The process involves a number of tests to see if the data meet the Rasch model assumptions. These include a probabilistic relationship between items (sto-chastic ordering); local independence and unidimension-ality. The analytical framework also enables checking to see if the scale works in the same way across groups (invariance as determined by Differential Item Function-ing-DIF) and examining the reliability and targeting of the scale to the sample. In the context of health out-come measurement the process is described in detail elsewhere [31,40,41].
The process of Rasch analysis is essentially one of test-ing the above assumptions. Briefly, fit (stochastic order-ing) to the Rasch model is achieved when summary and
individual item chi-square statistics are non-significant, showing no deviation from model expectation (Bonfer-roni adjusted); where item and person summary fit sta-tistics show a mean of zero and standard deviation of 1, and where individual item and person residuals are within the range of +/- 2.5.
The assumption of local independence of the item set is verified by the absence of correlations above 0.3 among the residuals of the items tests. Where this assumption is violated and local dependency is found, items can be grouped together in the form of ‘testlets’, which absorbs the impact of local dependency [42]. The items within each subscale (e.g. depression) can also be grouped together as a testlet and treated as a ‘super item’or‘higher order item’[43]. This enables a detailed examination of the relationships between subscales, including the unique component of each scale, the sum-mary correlation between subscales, corrected for attenuation, and the common variance of the total score (adding together all domains assuming unidimensional-ity) relative to the common and unique variance (i.e. total variance). A high common variance (e.g. 0.9 and above) would indicate that the various subscales were, in general, mapping onto a higher order construct and were correlated sufficiently highly that the total score obtained by summating all subscales together sum-marizes the profile of the majority of persons [43]. This co-calibration approach also enables a comparison of the operational range of the various subscales, which is one of the aims of the current study.
The test for the assumption of unidimensionality is that described by Smith [44]. Here two estimates are derived from different subsets of items identified by their loading on the first principal component of the residuals. The estimates are compared and when less than 5% are significantly different this supports unidimensionality.
In addition, the scale is expected to show invariance across key groups (e.g. gender or age), as indicated by a non-significant two-way ANOVA of the residuals where group is one factor, and (in this case) the level of psy-chological distress, a second factor. The latter is deter-mined by simply grouping respondents by their level of distress using the raw score. Reliability indices are also calculated, namely, Cronbach’s Alpha and the Person Separation Index (PSI).
The Rasch analysis was conducted using RUMM2030 software [45].
Results Descriptive
designed to give different patterns of disease duration, with the UK data (n = 89) representing early RA (dura-tion < 2 years), and the Australian data (n = 80) more established disease, (mean duration = 13.36, SD = 11.17). However, there were no significant differences in age between the two samples (mean age = 58.3 years, SD = 15.1, p >.05), nor a difference in gender (Chi Square 0.059; p = 0.86). For analytical purposes these data were separated into two samples, the initial baseline data of 169 assessments (73% of whom were female), and follow-up data from the UK of 154 repeated assess-ments (based on two further data collection points).
The mean scores and proportions according to cut points for depression, anxiety and stress (DASS) and depression and anxiety (HADS) are shown in Table 1. While overall mean scores were low across the three subscales on the DASS, 8.3% of the sample recorded scores in the ‘severe’ or ‘extremely severe’ range for depression, 7.8% for anxiety and 9.8% for stress. On the HADS, 9.4% of the sample were classified as a‘probable case’of depression (scores 11+) and 18.6% as a‘probable case’of anxiety (scores 11+). Using the ‘ possible+prob-able’cut point (scores 8+) from the HADS, 58.3% had neither anxiety nor depression; 13.5% had anxiety only; 6.4% depression only, and 21.8% had both ‘possible +probable’anxiety and depression.
Rasch Analysis
Generally all subscales were consistent with Rasch model expectations, Fit of the baseline data of the indi-vidual subscales of the DASS and the HADS, and the various combinations, including the final testlet based version are shown in Tables 2 &3. The DASS-Anxiety subscale showed initial fit to the model (Table 2, Analy-sis 1), but improved further after some items were rescored (Analysis 2), and local dependency was adjusted by testlets (Analysis 3). The HADS-Anxiety subscale showed good fit at the outset (Analysis 4). All solutions showed strict unidimensionality and local independence. All were free of DIF by age, gender and
country. When both the DASS and HADS anxiety items were combined some misfit was observed, and some multidimensionality (Analysis 5). Although creating test-lets to accommodate local dependency improved fit (analysis 6), two locally dependent items from the HADS required removal to obtain a strictly unidimen-sional solution (Analysis 7).
The depression subscales showed good fit to the Rasch model, and only the DASS set of items needed adjustment for local dependency (Table 3, Analyses 8 and 9), whereas the HADS-Depression subscale satisfied model expectations from the outset (Analysis 10). All solutions were free of DIF, strictly unidimensional and locally independent. When all items were pooled together, some slight misfit was observed (Analysis 11), but this resolved after creating testlets to accommodate local dependency (Analysis 12). The DASS-Stress sub-scale also satisfied model expectations at the outset (Analysis 13).
When all subscales were treated as testlets (making five super or higher order items in total), fit to the Rasch model supported unidimensionality of the com-mon latent construct (Analysis 14). The ratio of unique to total non-error variance was high (0.97). Replication was then conducted on the repeated assessment sample (n = 153, UK only) to confirm this interpretation (Ana-lysis 15). The ratio of unique to total variance on this occasion was 0.93, supporting the interpretation that all subscales map on to a common underlying higher-order construct.
The five testlets (i.e. the three DASS subscales and the two HADS subscales, consisting of all items and in their original scoring version) were then mapped, allowing comparison of their operational ranges (Figure 1).
[image:4.595.58.538.592.712.2]This logit based metric has been rescaled from 0-25 for ease of interpretation, the width of which was deter-mined by a combination of the HADS-Anxiety subscale, which had the lowest level on the common metric (so giving a score of zero), and the DASS-Anxiety subscale which had the highest level on the metric (so giving a
Table 1 Prevalence of Stress, Anxiety and Depression according to HADS and DASS (n = 169)
Scale Mean SD Possible (H)/Mild & Moderate (D)
(%)
Probable(H)/
Severe & Extremely Severe (D)
(%)
Poss/Prob(H)
Mild, Moderate, Severe/Extremely Severe (D)
(%)
Depression (DASS)
6.94 9.22 17.2 8.3 25.5
Depression (HADS)
5.10 4.00 18.9 9.4 28.3
Anxiety (DASS) 5.32 8.01 19.5 7.8 27.3
Anxiety (HADS) 5.97 4.82 16.7 18.6 35.3
Stress (DASS) 9.17 10.49 8.5 9.8 18.3
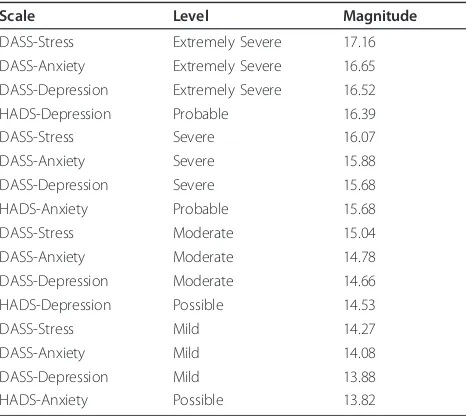
score of 25). Both the ‘possible’ and ‘probable’ cuts points of the HADS subscales are shown, along with the ‘mild’ to‘extremely severe’ cuts points for the DASS. The HADS-Anxiety subscale has the widest operational range (22.18 on the common metric), and the DASS-Depression subscale the narrowest range (10.61 on the common metric). The cut point for ‘extremely severe’ on the DASS-Stress subscale is the highest on the con-struct (so giving the lowest prevalence), followed by the ‘extremely severe’ cut point for the DASS-Anxiety sub-scale (Table 4). The HADS-Anxiety ‘possible’cut point is the lowest on the common underlying metric, and thus associated with the highest prevalence, giving 35.3% of patients falling above this cut (including the ‘probable’patients).
The HADS-Depression ‘probable’cut point and the DASS-Depression ‘severe’ and ‘extremely severe’ cut point gave levels of prevalence for depression of a simi-lar magnitude, and are closely located on the underlying metric. However, there is considerable difference in
terms of HADS-Anxiety‘probable’when contrasted with the DASS-Anxiety ‘severe’ and ‘extremely severe’ cut points, with the prevalence on the HADS-Anxiety more than double that of the prevalence on DASS-Anxiety. This is consistent with the ‘probable’cut point on the HADS-Anxiety being lower on the common metric than the DASS-Anxiety‘severe’cut point, thus generating a higher prevalence. However, if the DASS-Anxiety ‘mild’ cut point is included, then prevalence is similar, with the ‘mild’DASS-Anxiety cut point being at a similar location to the HADS-Anxiety ‘possible’cut point (Fig-ure 1).
Given the metric, it is possible to provide‘exchange’ rates between the respective subscales of the two scales. For example, the ‘probable’ cut point of the HADS-Depression subscale of 11 points is equivalent to 27 points on the DASS-Depression subscale, which is the highest score within its‘moderate’range (Figure 2).
[image:5.595.57.538.100.248.2]Likewise the HADS-Anxiety ‘probable’cut point of 11 is equivalent to a score of 14 on the DASS-Anxiety
Table 2 Fit of the DASS-Anxiety and HADS-Anxiety items to the Rasch model
Analysis Subscale Item Fit Residual Person Fit Residual Chi-Square Interaction PSI Uni-dimensionality
Mean SD Mean SD Value DF P % tests CI
Anxiety
1 DASS-A -0.464 1.385 -0.308 0.945 48.21 28 0.010 0.863 6.63 3.3-9.9
2 DASS-A -0.371 1.352 -0.272 0.970 36.90 28 0.121 0.860 5.42 2.1-8.7
3 DASS-A -0.219 0.790 -0.267 1.016 16.48 20 0.686 0.839 1.81 -1.5-5.1
4 HADS-A -0.026 1.509 -0.296 1.088 23.09 14 0.588 0.838 2.41 -0.1-5.7
Anxiety Combined
5 D+H-A -0.301 1.418 -0.287 1.067 79.648 42 0.0004 0.892 8.38 5.1-11.7
6 D+H-A -0.152 1.084 -0.296 1.107 42.17 34 0.158 0.880 9.58 6.3-12.9
7 D+H-A -0.218 1.019 -0.305 1.046 37.11 32 0.245 0.871 4.79 1.5-8.1
Ideal Fit 0.0 1.0 0.0 1.0 > 0.05* > 0.7 < 5.0 Lower CI below 5
*Bonferroni adjusted
Table 3 Fit of the DASS and HADS items and all subscales (testlets) to the Rasch model
Analysis Subscale Item Fit Residual Person Fit Residual Chi-Square Interaction PSI Uni-dimensionality
Mean SD Mean SD Value DF P % tests CI
Depression
8 DASS-D -0.396 1.541 -0.431 1.244 49.69 28 0.007 0.945 6.59 3.3-9.9
9 DASS-D -0.276 1.567 -0.354 1.132 39.34 22 0.013 0.940 4.79 1.5-8.1
10 HADS-D -0.263 0.872 -0.382 0.899 25.16 28 0.619 0.856 3.01 0.0-6.3
Depression Combined
11 D+H-D -0.560 1.422 -0.442 1.133 68.82 42 0.005 0.920 12.05 8.7-15.4
12 D+H-D -0.423 1.248 -0.373 1.084 57.31 34 0.007 0.912 7.23 3.9-10.5
Stress
13 DASS-S -0.025 1.383 -0.425 1.575 41.18 28 0.052 0.949 7.19 3.9-10.5
All Scales combined as testlets
14 All -0.400 0.729 -0.353 0.842 10.73 10 0.378 0.900 2.52 0.0-5.9
15 All -0.123 0.749 -0.378 0.968 10.12 10 0.430 0.870 2.00 -1.5-5.5
Ideal Fit 0.0 1.0 0.0 1.0 > 0.05* > 0.7 < 5.0 Lower CI below 5
[image:5.595.58.538.538.722.2]subscale, which is the highest score on DASS‘moderate’ level. A score of 20 on the DASS-Anxiety subscale (extremely severe) is equivalent to a score of 13 (’prob-able’) on the HADS-Anxiety subscale.
Finally, irrespective of the differential raw scores asso-ciated with the various severity-specific cut points on the DASS subscales (e.g. at extremely severe) all sever-ity-specific cut points are shown to map onto a similar point on the underlying metric. That is, the DASS ‘extremely severe’cut points for anxiety and depression mark the same location on the underlying metric, as do the ‘severe’cut points. It follows from this that the pre-valence of the two constructs as defined by the DASS do not vary greatly. The ‘extremely severe’cut point for the DASS-Stress subscale is the highest on the metric, as is its ‘mild’ cut point, compared with the other DASS’s subscales, so giving a lower prevalence asso-ciated with each cut point.
Discussion
Depression and anxiety frequently occur in RA. This study compared two commonly used screening scales, HADS and DASS, in relation to their measurement range and cut points to consider if prevalence rates may be due to scale-specific case definition.
[image:6.595.59.542.88.367.2]The individual subscales of depression and anxiety (HADS and DASS) and stress (DASS only) showed a good fit to Rasch model expectations. After some adjustments to the ordering of thresholds and for local dependency for the DASS Anxiety and Depression sub-scales, interval scale transformation was achieved for all
Figure 1Operational ranges and cut points of the DASS/HADS subscales.
Table 4 Hierarchy of various cut points on the common metric*
Scale Level Magnitude
DASS-Stress Extremely Severe 17.16
DASS-Anxiety Extremely Severe 16.65
DASS-Depression Extremely Severe 16.52
HADS-Depression Probable 16.39
DASS-Stress Severe 16.07
DASS-Anxiety Severe 15.88
DASS-Depression Severe 15.68
HADS-Anxiety Probable 15.68
DASS-Stress Moderate 15.04
DASS-Anxiety Moderate 14.78
DASS-Depression Moderate 14.66
HADS-Depression Possible 14.53
DASS-Stress Mild 14.27
DASS-Anxiety Mild 14.08
DASS-Depression Mild 13.88
HADS-Anxiety Possible 13.82
[image:6.595.57.290.505.713.2]subscales. When pooled together, DASS Anxiety and HADS Anxiety subscales required some modifications to create a unidimensional scale whereas only minor changes were necessary to merge DASS Depression and HADS Depression. This suggests that the anxiety sub-scales across the two sub-scales may measure different aspects of this construct. This finding has implications for interpretation of anxiety rates across studies and the selection of anxiety scales. It is important to further investigate the clinical relevance of those scales.
When, however, all subscales were mapped together as testlets, they were found to measure a common underly-ing trait. This is consistent with the testlet design, when used in this fashion, being equivalent to the bi-factor model, where all sub-domains load onto one common domain, while unique components load on to secondary domains [46]. In this instance it was found that the unique variance was low, and that the majority of var-iance was shared by the five subscales. This finding may be due to the use of testlets, as in removing local depen-dency those testlets may also remove some discrete uniqueness within each subscale (which when individu-ally tested all met Rasch analysis expectations). It may also be due to an overlap between the two constructs, depression and anxiety, either as a result of their
measures assessing general distress [14] to a degree, or that they may in fact be demonstrating their share com-mon causal factors [47]. Nonetheless, the two constructs are seen as distinctly different, anxiety being motivated by fear while depression by sadness [48]. Finally, the commonality detected may also be due to a high level of comorbidity of depression and anxiety in this study’s sample. This comorbidity is particularly significant given its occurrence in the context of a physical comorbidity (RA). It highlights the clinical complexity and associated implications for the treatment of both depression and anxiety in the presence of the physical manifestations of RA. It is also important that further research explores the structure of depression and anxiety constructs in relation to their common underlying construct of psy-chological distress.
[image:7.595.59.539.89.382.2]Irrespective of the derivation of the cut points, it was possible through the common metric provided by Rasch analysis, to compare DASS cut points with those of the HADS. Depending upon which cut points were chosen, prevalence estimates could be similar. For example, the HADS‘probable’and DASS ‘extremely severe’cut points for depression were found to be closely matched. For anxiety, however, comparable cut points were only found at a lower end. That is, the DASS-Anxiety‘mild’
cut point and above matched the HADS-Anxiety ‘possi-ble’ and above cut point. The DASS-Anxiety‘extremely severe’ cut point was higher on the construct than the HADS-Anxiety‘probable’cut point. This may be due to the difference in focus of the anxiety items, with the DASS reflecting feelings of panic and physical symptoms (e.g. dryness of mouth) while the HADS subscale was developed to exclude somatic symptoms and is closely aligned with the generalised anxiety disorder [38]. This is an important finding suggesting that these anxiety scales need further clinical verification to determine which aspects of anxiety they measure, and their con-cordance with clinical diagnostic assessments.
As such, these findings have important implications for screening and interpretation of research findings across studies. First, this study supports previous find-ings that elevated levels of both depression and anxiety occur in RA [i.e. [5]]. Second, it permits a direct com-parison of the ability of these two measures to distin-guish between depression and anxiety, and their derived estimates of prevalence. The operational ranges of mea-surement between the scales were found to vary and the cut points needed combined calibration in order to determine appropriate comparability.
The DASS cut points were originally determined by distributional difference of their norming sample, later confirmed in clinical populations [34,49,50]. However, in the current study an interesting observation is that the severity-specific DASS cut points for the anxiety and depression subscales all appeared to measure the same point on the underlying metric, irrespective of the speci-fic construct they represent, giving almost identical pre-valence for depression and anxiety. In contrast, this was not the case for the HADS. This similarity for DASS cut points requires further investigation.
The study has a number of limitations. Although both scales have previously been evaluated against clinical diagnostic assessment [34,51] it is not possible to deter-mine which one may do so with more specificity/sensi-tivity in this study. The study was also restricted to RA population, and it would be useful to see if the same results were to be found in other rheumatic diseases given that it is not clear to what degree depression and anxiety presentation and severity may vary across other rheumatic conditions. While the study was not designed to look at responsiveness of these scales, it has shown that their structures are invariant across countries (UK and Australia) and time (examined in UK only). This is an essential requirement for future studies to assess responsiveness of those scales.
In conclusion, the current study highlights the comor-bidity of anxiety and depression with RA. It also high-lights the challenges of measuring depression and anxiety given the limitations of assessment measures,
and the complexity of those conditions. However, this study shows that at least some confusion can be addressed with a co-calibration of depression and anxi-ety screening scales to enable the comparison of the estimates across scales and studies. That is, the results for the two scales compared in this study suggest that for depression a comparison between the ‘probable’ category on the HADS and ‘extremely severe’on the DASS may be made, but that for anxiety, a comparison of DASS ‘mild’and HADS ‘possible’ is better aligned. This study also highlights the importance of developing a common metric upon which all scales, and their cut points, may be calibrated.
Conclusions
The authors envisage three key implications from these findings. First, researchers investigating the prevalence of psychological distress amongst people with RA need to be mindful of the lack of concordance of the cut points across scales, and the impact this may have on prevalence estimates and meta-analytic studies. Second, this study reasserts the high rates of depression in RA patients and the need for regular assessment in both early and established RA. This is pertinent given the close association between depression and pain [52] and health outcomes in RA. Third, this study further sub-stantiates converging evidence of the high rates of symp-toms of anxiety amongst people with RA. Risk factors for anxiety, unlike for depression, are yet to be systema-tically examined in relation to RA [53].
In terms of immediate clinical application, screening scales such as HADS and DASS provide a good indica-tion of possible depression and anxiety and may be used for regular screening of psychological distress. It is how-ever, important to understand that those scales may not measure quite the same levels or aspects of that psycho-logical distress, particularly so in relation to anxiety.
Acknowledgements and funding
The authors thank Dr Maria Ban for assistance with data presentation and Ms Lisa Hallab for assistance with the preparation of this manuscript for submission.
The Australian part of the study was supported by the Arthritis NSW Branches Scholarship Grant to T.C., N.M. and S.R.C. The publishing costs were supported by the University of Leeds.
Author details
1
School of Psychology, University of Western Sydney, Australia.2Faculty of Health Sciences, University of Sydney, Australia.3Rural Health Academic
Centre, University of Melbourne, Australia.4School of Medicine, University of Sydney, Australia.5Leeds Institute of Molecular Medicine, Section of
Musculoskeletal Disease, Faculty of Medicine and Health, University of Leeds, UK.
Authors’contributions
data. TC, AT, SC and JFP drafted the manuscript. All authors read and approved the final manuscript.
Competing interests
The authors declare that they have no competing interests.
Received: 25 July 2011 Accepted: 24 January 2012 Published: 24 January 2012
References
1. Alamanos Y, Drosos A:Epidemiology of adult rheumatoid arthritis. Autoimmun Rev2005,4:130-136.
2. El-Miedany YM, El Rasheed AH:Is anxiety a more common disorder than depression in rheumatoid arthritis?Joint Bone Spine2002,69:300-306. 3. Gettings L:Psychological well being in rheumatoid arthritis: a review of
the literature.Musculoskeletal Care2010,8:99-106.
4. Dickens C, McGowan L, Clark-Carter D, Creed F:Depression in rheumatoid arthritis: a systematic review of the literature with meta-analysis. Psychosom Med2002,64:52.
5. Uguz F, Akman C, Kucuksarac S, Tufekci O:Anti tumor necrosis factor therapy is associated with less frequent mood and anxiety disorders in patients with rheumatoid arthritis.Psychiatry Clin Neurosci2009,63:50-55. 6. Covic T, Tyson G, Spencer D, Howe G:Depression in rheumatoid arthritis
patients: demographic, clinical, and psychological predictors.J Psychosom Res2006,60:469-476.
7. Wolfe F, Michaud K:Predicting depression in rheumatoid arthritis: The signal importance of pain extent and fatigue, and comorbidity.Arthritis Care Res2009,61:667-673.
8. Bijl R, Ravelli A, Van Zessen G:Prevalence of psychiatric disorder in the general population: results of the Netherlands Mental Health Survey and Incidence Study (NEMESIS).Soc Psychiatry Psychiatr Epidemiol1998, 33:587-595.
9. Robinson RG, Spalletta G:Poststroke Depression: A Review.Can J Psychiatry2010,55:341-349.
10. Sheehy C, Murphy E, Barry M:Depression in rheumatoid arthritis– underscoring the problem.Rheumatology2006,45:1325. 11. Timonen M, Viilo K, Hakko H, Sarkioja T, Ylikulju M, Meyer-Rochow V,
Vaisanen E, Rasanen P:Suicides in persons suffering from rheumatoid arthritis.Rheumatology2003,42:287-291.
12. Treharne G, Lyons A, Kitas G, Collinge T, Shah A:Suicidal ideation in patients with rheumatoid arthritis.Br Med J2000,321:1290. 13. Ang D, Choi H, Kroenke K, Wolfe F:Comorbid depression is an
independent risk factor for mortality in patients with rheumatoid arthritis.J Rheumatol2005,32:1013-1019.
14. VanDyke M, Parker J, Smarr K, Hewett J, Johnson G, Slaughter J, Walker S: Anxiety in rheumatoid arthritis.Arthritis Care Res2004,51:408-412. 15. Clark L, Watson D:Tripartite model of anxiety and depression:
Psychometric evidence and taxonomic implications.J Abnorm Psychol 1991,100:316-336.
16. Odegard S, Finset A, Mowinckel P, Kvien T, Uhlig T:Pain and psychological health status over a 10-year period in patients with recent onset rheumatoid arthritis.Ann Rheum Dis2007,66:1195-1201.
17. Isik A, Koca S, Ozturk A, Mermi O:Anxiety and depression in patients with rheumatoid arthritis.Clin Rheumatol2007,26:872-878.
18. Smith B, Zautra A:The effects of anxiety and depression on weekly pain in women with arthritis.Pain2008,138:354-361.
19. Zautra A, Parrish B, Van Puymbroeck C, Tennen H, Davis M, Reich J, Irwin M: Depression history, stress, and pain in rheumatoid arthritis patients.J Behav Med2007,30:187-197.
20. Bolger N, Zuckerman A:Personality processes an individual differences: A framework for studying personality in the stress process.J Pers Soc Psychol1995,69:890-902.
21. Covic T, Pallant J, Tennant A, Cox S, Emery P, Conaghan P:Variability in depression prevalence in early rheumatoid arthritis: a comparison of the CES-D and HAD-D Scales.BMC Musculoskelet Disord2009,10:18. 22. Lovibond SH, Lovibond PF:Manual for the depression anxiety stress scales.2
edition. Sydney: Psychology Foundation; 1995.
23. Zigmond A, Snaith R:The hospital anxiety and depression scale.Acta Psychiatr Scand1983,67:361-370.
24. Norton P:Depression Anxiety and Stress Scales (DASS-21): Psychometric analysis across four racial groups.Anxiety Stress Coping2007,20:253-265.
25. Lovibond PF:Long-term stability of depression, anxiety, and stress syndromes.J Abnorm Psychol1998,107:520-526.
26. Henry J, Crawford J:The short-form version of the Depression Anxiety Stress Scales (DASS-21): construct validity and normative data in a large non-clinical sample.Br J Clin Psychol2005,44:227-239.
27. Clara I, Cox B, Enns M:Confirmatory factor analysis of the Depression-Anxiety-Stress Scales in depressed and anxious patients.J Psychopathol Behav Assess2001,23:61-67.
28. Rasch G:Probabilistic models for some intelligence and attainment tests Chicago: University of Chicago Press; 1960.
29. Shea T, Tennant A, Pallant J:Rasch model analysis of the Depression, Anxiety and Stress Scales(DASS).BMC Psychiatry2009,9:21. 30. Bjelland I, Dahl A, Haug T, Neckelmann D:The validity of the Hospital
Anxiety and Depression Scale:: An updated literature review.J Psychosom Res2002,52:69-77.
31. Pallant J, Tennant A:An introduction to the Rasch measurement model: an example using the Hospital Anxiety and Depression Scale (HADS).Br J Clin Psychol2007,46:1-18.
32. Smith A, Wright E, Rush R, Stark D, Velikova G, Selby P:Rasch analysis of the dimensional structure of the Hospital Anxiety and Depression Scale. Psychooncology2006,15:817-827.
33. Loosman WL, Siegert CEH, Korzec A, Honig A:Validity of the Hospital Anxiety and Depression Scale and the Beck Depression Inventory for use in end-stage renal disease patients.Br J Clin Psychol2010,49:507-516. 34. Antony M, Bieling P, Cox B, Enns M, Swinson R:Psychometric properties of
the 42-item and 21-item versions of the Depression Anxiety Stress Scales in clinical groups and a community sample.Psychol Assess1998, 10:176.
35. American Psychiatric Association:Diagnostic and statistical manual of mental disorders.4 edition. Washington DC: American Psychiatric Association; 2000. 36. Rao M:Depression in the physically ill.Prim Psychiatr2008,15:44-50. 37. Goldberg D:The detection and treatment of depression in the physically
ill.World Psychiatr2010,9:16-20.
38. Olsson I, Mykletun A, Dahl A:The Hospital Anxiety and Depression Rating Scale: a cross-sectional study of psychometrics and case finding abilities in general practice.BMC Psychiatry2005,5:46.
39. Luce R, Tukey J:Simultaneous conjoint measurement: A new type of fundamental measurement.J Math Psychol1964,1:1-27.
40. Tennant A, Conaghan P:The Rasch measurement model in
rheumatology: What is it and why use it? When should it be applied, and what should one look for in a Rasch paper?Arthritis Care Res2007, 57:1358-1362.
41. Hagquist C, Bruce M, Gustavsson J:Using the Rasch model in nursing research: An introduction and illustrative example.Int J Nurs Stud2009, 46:380-393.
42. Wainer H, Kiely G:Item clusters and computerized adaptive testing: A case for testlets.Journal of Educational Measurement1987,24:185-201. 43. Andrich D:Cronbach’s alpha in the presence of subscales.International
Conference on Outcomes Measurement; September; Bethesda, Maryland2010. 44. Smith E Jr:Understanding Rasch Measurement: Detecting and Evaluating
the Impact of Multidimensionality Using Item Fit Statistics and Principal Components Analysis of Residuals.J Appl Meas2002,3:205-231. 45. Andrich D, Sheridan BE, Luo G:RUMM2030: Rasch unidimensional models for
measurementPerth, Western Australia: RUMM Laboratory; 2009. 46. Gibbons RD, Hedeker DR:Full-information item bi-factor analysis.
Psychometrika1992,57:423-436.
47. Burns D, Eidelson R:Why Are Depression and Anxiety Correlated? A Test of the Tripartite Model.J Consult Clin Psychol1998,66:461-473. 48. Watson D, Weber K, Smith Assenheimer J, Clark L, Strauss M, McCormick R:
Testing a tripartite model: I. Evaluating the convergent and discriminant validity of anxiety and depression symptom scales.J Abnorm Psychol 1995,104:3-14.
49. Ng F, Trauer T, Dodd S, Callaly T, Campbell S, Berk M:The validity of the 21-item version of the Depression Anxiety Stress Scales as a routine clinical outcome measure.Acta Neuropsychiatr2007,19:304-310. 50. Brown T, Chorpita B, Korotitsch W, Barlow D:Psychometric properties of
the Depression Anxiety Stress Scales (DASS) in clinical samples.Behav Res Ther1997,35:79-89.
52. Covic T, Adamson B, Spencer D, Howe G:A biopsychosocial model of pain and depression in rheumatoid arthritis: a 12-month longitudinal study.Rheumatology2003,42:1287-1294.
53. Clarke DM, Currie KC:Depression, anxiety and their relationship with chronic diseases: a review of the epidemiology, risk and treatment evidence.Med J Aust2009,190:S54-S60.
Pre-publication history
The pre-publication history for this paper can be accessed here: http://www.biomedcentral.com/1471-244X/12/6/prepub
doi:10.1186/1471-244X-12-6
Cite this article as:Covicet al.:Depression and Anxiety in Patients with Rheumatoid Arthritis: Prevalence rates based on a comparison of the Depression, Anxiety and Stress Scale (DASS) and the Hospital, Anxiety and Depression Scale (HADS).BMC Psychiatry201212:6.
Submit your next manuscript to BioMed Central and take full advantage of:
• Convenient online submission
• Thorough peer review
• No space constraints or color figure charges
• Immediate publication on acceptance
• Inclusion in PubMed, CAS, Scopus and Google Scholar
• Research which is freely available for redistribution