Training basic visual attention leads to changes in responsiveness to social communicative cues in 9-month-olds
Linda Forssman1* & Sam V. Wass2
1School of Medicine, University of Tampere, Finland 2University of East London, London, UK
* Corresponding author Current address:
Linda Forssman
Department of Psychology, Uppsala Child & Baby Lab, Uppsala University, Uppsala, Sweden
E-mail: [email protected] Phone: +46 (0)184712142
Author contribution
All authors contributed to the study design. Forssman performed testing and data collection. Forssman and Wass performed the data analysis. Forssman drafted the first versions of the manuscript, and Wass provided critical revisions. All authors approved the final version of the manuscript for submission.
Acknowledgements
We gratefully acknowledge the efforts of the families who participated in the study. We would like to thank Dr Jukka Leppänen from the Infant Cognition Lab, University of
Training basic visual attention leads to changes in responsiveness to social communicative cues in 9-month-olds
Abstract
Training basic visual attention leads to changes in responsiveness to social communicative cues in 9-month-olds
Cognitive development is traditionally viewed as a hierarchical process, in which early-developing skills lay a foundation for subsequent attainments(Heckman, 2006;
Karmiloff-Smith, 1992). Visual attention control is among the first cognitive skills to develop during infancy and proposed to be a necessary “building block” for more complex cognitive skills (Rose, Feldman & Jankowski, 2003). Thus for example, the brain networks involved in voluntary orienting of attention (frontal eye fields, intraparietal sulcus, superior parietal lobe), which are known to undergo intense development during the first year of life (Colombo & Cheatham, 2006) are crucial for the involuntary and voluntary control of attention to sensory inputs (Petersen & Posner, 2012).
In line with the hypothesis of attention control as a “building block” for more complex cognitive skills, Rose and colleagues have shown, across a number of studies, that early precursors of visual attention control predict later-developing capacities for language and learning in academic settings (Rose, Feldman & Jankowski, 2009). Further, infants who perform better on experimental measures of attention pay more attention to faces during free viewing (Frank, Amso & Johnson, 2014), are better at regulating their emotions in distressing situations (Sheese, Rothbart, Posner, White & Fraundorf, 2008), and perform better on
assessments of social cognition (Wellman, Lopez-Duran, LaBounty & Hamilton, 2008). These findings suggest that visual attention control is involved in regulating social attention. Research also suggests that early developmental atypicalities in aspects of attention may lead to subsequent patterns of impaired learning in other areas in conditions such as autism spectrum disorders (Keehn, Müller & Townsend, 2012), attention deficit hyperactivity disorder (Lawson & Ruff, 2004), as well as other conditions such as preterm birth (Voigt et al., 2012) (see also Johnson et al., 2016; Johnson, 2012). Yet, correlational studies like these do not directly support the hypothesis that basic sensory and attention process may play a causal role in infancy in the acquisition of more complex social and cognitive skills (Wass, 2014). Like any correlation, the observed relationship may be attributable to some additional, third factor – such as the child’s general, cognitive developmental level.
attention requires flexibly shifting of attention in the face of new conditions. The paradigms were therefore designed to train voluntary attention control in a variety of different contexts. They were administered on a screen and an eye tracker was used to track the participants’ gaze. The paradigms were designed so that different events took place contingent on where on-screen the infant was looking. To motivate optimal performance, audio-visual rewarding stimuli were used and the difficulty level of the paradigms automatically adapt to the infants’ level of performance. Previous research has shown that training using these paradigms leads to robust transfer to non-trained aspects of attention control in infants, although the transfer of training effects to tasks involving social attention in more real-world settings has not been analyzed (Ballieux et al., 2016; Powell, Wass, Erichsen & Leekam, 2016; Wass, Porayska-Pomsta & Johnson, 2011).
Thus, in the current study we examined, for the first time, whether training of basic attentional functions in infancy transferred to improved responsiveness on social attention tasks. Seventy typically developing 9-month-olds were assigned to either four sessions of non-social attention training with gaze-interactive stimuli (n = 35) or four active control sessions (n = 35). To assess the effects of training, an identical pre-post testing battery was administered on three occasions: first, before the start of the training/control sessions; second, shortly (within a few days) after the last training or control session; and, third, six weeks following end of the intervention.
Second, to assess whether training non-social attention transferred to improvements at social attention tasks, we investigated whether the training would lead to an increase in the infants’ ability to follow gaze on a screen-based task and also in their ability to respond to and initiate social communication on structured observation tasks. Given previous
correlational links between endogenous control of attention and social attention (e.g., Frank et al., 2014; Sheese et al., 2008; Wellman et al., 2008), it is plausible that training gains in attention control would lead to improvements on tasks involving social attention. However, it is also possible that tasks requiring orienting and maintaining attention to events in a social setting has different demands, e.g., social motivational demands, that would mask or overrule potential training gains in attention control.
Methods Participants and Design
The participants were seventy typically developing infants (training group = 35; 19 females, 16 males; control group = 35; 18 females, 17 males). All infants were born full-term, had a birth weight of >2500 g, and were recruited from a population-based database of births in the Tampere area in Finland. Three additional participants enrolled in the study, but dropped out in the beginning of their study participation (2 infants because of illness; 1 infant because eye tracking calibration was not possible). The attrition rate for the task in the pre-post test battery varied between tasks and is described in detail under each task
average effect size (Cohen’s d) of .69 (Wass et al, 2011). The final sample size varied between 60-70 infants in individual analyses according to the specific task inclusion criteria as explained below.
Before the start of the study the infants were, prior to their first contact with the experimenters, pseudo-randomly allocated into a training or control group, i.e., each control infant was paired with a training infant on a participant by participant basis and we controlled for the number of minutes of screen exposure they received. The study involved seven lab visits and the infants came in for the first visit when they were 9 months of age (training group: 280.63 days, SD = 7.81; control group: 281.00 days, SD = 6.41). Visit 1 was pre-assessment; visits 2-5 were training or control sessions; visit 6 was first post-pre-assessment; and visit 7 was second post-assessment. The post-assessments were identical to the
pre-assessment. The first six visits took place on average within 14.24 days (SD = 3.50; training group: 14.06 days, SD = 3.56; control group 14.43 days, SD = 3.49) and the 7th visit took place 6 weeks after the training intervention (days from first visit: M = 57.87 days; SD = 4.37; training group: 57.97 days, SD = 4.64; control group: 57.77 days, SD = 4.15). All screened-based stimuli were presented on a 23-inch monitor that was part of a corneal-reflection eye tracker (Tobii TX300, Tobii Technology, Stockholm, Sweden).
The parents were blind to the specific aims of the study and to their infant’s group assignments. Ethical permission for the study was obtained from the Ethical Committee of the local University and a written informed consent was given by the parents of the
participants before the start of the study. The study was conducted in accordance with the Declaration of Helsinki.
Training Protocol
interference control; see Fig 1 and Table 1). The games were designed to keep the infants at their maximum difficulty threshold by the use of visual and auditory rewards. The difficulty level increased or decreased as a function of performance. The training tasks used were similar, with a few small modifications, to those used by Wass and colleagues (2011). Following an eye tracking calibration procedure, the training games were presented in rotation until the infants became tired or lost interest in the tasks. Each game was typically played more than once during a training session. The average time spent on training in each session was 22.34 min and the total training time over the four training sessions was on average 89.36 min (SD = 15.41). The length of the training and control sessions was closely matched, see Fig 2.
---INSERT FIG 1 ABOUT HERE---
Task 1 (Stars). One target, a cartoon character within a brightly colored star, was presented on a night sky background together with eight distractors (e.g., planets, smaller stars). The infant was given an audiovisual reward if he or she looked to the target within 3000 ms. The target changed from trial to trial (location and type of cartoon character) and the salience of the distractors changed adaptively, contingent on performance. At lower difficulty levels the eight distractors were smaller, static, identical to each other and
dissimilar to the target, whereas at higher difficulty levels the distractors were more varied, moving, and more brightly colored. This task targets attention shifting and flexible search for changing targets, whilst ignoring distractors.
time was greater than 12 seconds it decreased by 1, down to a minimum of 1. The difficulty level was used as the dependent variable to assess within-task training performance.
Task 2 (Windows). Infants were presented with a target (a cartoon animal) that upon fixation disappeared behind curtains in one of several windows. After the target disappeared an attention grabber (rotating yellow flower) was shown elsewhere on the screen. When the infants fixated the attention grabber it disappeared after a delay. If the infants subsequently looked back to the window where the target had disappeared they were given an audiovisual reward. The number of windows and the complexity of the visual array in which each window was presented changed adaptively as a function of performance. In addition, the delay length increased or decreased in 200 ms increments for every correct or incorrect trial. This task targeted visuospatial short-term memory and required acting on stored information about objects embedded in complex scenes.
The difficulty level (which determined the number of search locations and the
complexity of the background of the visual array) started for each training session at 1. This difficulty level was reassessed every 3 trials. If the previous 3 trials were all correct, the difficulty level increased by 1, up to a maximum of 5. If none of the previous 3 trials were correct the difficulty level decreased by 1, down to a minimum of 1. The difficulty level was used as the dependent variable to assess within-task training performance.
target changed non-adaptively from elephant to chicken (or reversed). This task targeted attention shifting, and flexible search for changing targets, whilst ignoring distractors.
The difficulty level (which determined the number of search locations) started for each training session at 1. This difficulty level was reassessed every 4 trials. If the child had successfully located the target within the time limit on each of the 4 previous trials the difficulty level increased by 1, up to a maximum of 6. If they had failed to locate the target within the limit on 2 or more of the previous 4 trials the difficulty level decreased by 1, down to a minimum of 1. The difficulty level was used as the dependent variable to assess within-task performance.
Task 4 (Butterfly). When the child fixated the target, the butterfly ‘flew’ across the screen, and distractors (a house, a tree, clouds) scrolled in the opposite direction. When the child looked to any of the distractors they disappeared and only the target, now static, remained on screen. On fixating the target it commenced moving and the distractors re-appeared and continued scrolling. When the target had across the screen, from the left- to the right-hand side, it disappeared and the trial reset. The salience of the distractors changed adaptively, including faster, larger and more densely packed objects. This task rewards a child for maintaining their fixation on one target, and suppressing the prepotent response to look towards moving distractors in the periphery.
A trial was defined as the time taken for the target to move from the left to the right hand side of the screen. As described above the target was gaze-contingent, and only moved when the child was looking directly at it. Within-task performance was calculated by
measuring the percentage of each trial that the infant spent looking at the target, relative to looking at the distractors. The maximum possible score is 100, and the minimum 0. This measure was used as the dependent variable to assess within-task performance.
Control Protocol
A matched number of infants participated in the same number, spacing, and duration of lab sessions, using the same equipment and with the same experimenters, as the trained infants. In lieu of training the infants watched non-contingent, child-appropriate animations and television clips (Wass, Porayska-Pomsta & Johnson, 2011). Just as for the training tasks, no clips featured human faces. The duration of screen exposure during each control session was equivalent to during the training sessions (M = 89.89 min; SD = 15.52, see Fig 2). Pre-Post Assessment
The test battery at pre-post assessment consisted of three screen-based eye tracking tasks, a Sustained Attention task, an Attention Disengagement task and a Gaze Following
task, and two structured observation tasks assessing the ability to initiate and respond to social communication (see Fig 3 and Table 1).
During the assessments, the pre-post test battery was presented in three blocks. The
Attention Disengagement task was presented in block 1, the structured observation tasks were presented in block 2, the Gaze Following, and Sustained Attention tasks were presented in block 3. The three blocks were pseudo-randomized across participants and visits before the start of the study, wherein the structured observation was always administrated in the second block. The purpose of this design was to allow for a break from the eye tracking assessment, while still continuing with the testing, as infants are limited in their ability to sit still and stay focused on one task. In addition, EEG was recorded during the Attention Disengagement task and ECG was recorded during the Sustained Attention and Gaze Following tasks, these results will be published at a later date.
Sustained attention (screen task). This task assessed the infants’ ability to sustain the focus of their visual attention to a targeted stimulus. Different still images were presented in the center of the screen and remained on-screen until 10s of accumulated looking time had been collected. The time it took to accomplish this served as our outcome measure. (A shorter time therefore indexes greater sustained attention.) Six images, three face images and three non-face images, were presented. Two sets of three images were presented at two different times of the assessment (a set of the Gaze following taskwas presented in between). The stimuli were pseudorandomized so that a face or non-face image was never presented more than two trials in a row. The face stimuli consisted of color images of affectively neutral female faces (from the Karolinska Directed Emotional Faces database (Lundqvist, Flykt & Öhman, 1998). The non-face stimuli consisted of color images of houses. One infant (control) failed to complete this task on all three visits and was left out from the analyses. One independent coder who was blind to the infants’ group coded the infants’ time to accomplish 10 s of looking and achieved sound inter-rater reliability on 17% of the data (Pearsons’ r = .99).
Attention disengagement (screen task). The attention disengagement task assessed the ability to disengage from a centrally presented stimulus, an emotional face or a control stimulus, to a lateral stimulus. The task used an overlap design, i.e., the central stimulus was first presented, and then the lateral stimulus was presented while the central stimulus
retained the amplitude and color spectra as well as the contour of the face, but was not identifiable as a face stimulus). The lateral stimulus consisted of a colorful animated movie. The trials were presented in a pseudo-randomized order in which neither the condition (fearful, happy, or non-face) nor the same target side (left or right) was repeated more than three times in a row. The participants were presented with a total of 48 trials (16
trials/condition).
Similar to previous studies (e.g., Leppänen et al., 2014), a trial was considered invalid if the infant did not look at the central stimulus for at least 70 % during the initial 1000 ms presentation, if the infant made an anticipatory eye movement (i.e., eye movement
commenced < 150 ms after the onset of the lateral stimulus), or an eye movement toward an incorrect location (i.e., not toward the lateral stimulus). Of the scorable trials, we calculated the proportion of disengagement from the centrally presented emotional faces and non-faces (i.e., eye movement toward the lateral stimulus during a time window from 150 to 1000 ms after the onset of the lateral stimulus) and this served as our outcome measure. Data were excluded from infants who failed to provide at least 3 valid trials/condition at all three assessments (n = 6; 4 training participants, 2 control participants).
direction of the model’s gaze was pseudorandomized, in which the direction of gaze was in an equal number toward the left or right object and never in the same direction more than two trials in a row. We calculated the proportion of correct first looks to the gaze-cued object (i.e., correct looks – incorrect looks / nr of valid trials) and this served as our outcome measure. Three infants (1 training participant, 2 control participants) failed to complete this task on all three visits and were therefor left out from the analysis.i
Structured observation tasks. Infants’ ability to respond to social communication and to initiate social communication was based on two tasks from the Early Social
Communication Scale (ESCS; Mundy et al., 2003). During this assessment, the infants were seated on their caregiver’s lap, at a table, facing the experimenter.
Responding to social communication was assessed using the Poster Task from the
ESCS. In this task, four posters were located on the wall located to the left, left-behind, right, and right-behind the infant. The infants were presented with a total of eight trials, consisting of two sets of four trials presented at different times during the assessment. In each trial, the tester first established eye contact with the child. Then she turned her entire torso (not just her head and arm) and visually oriented to a poster while pointing at it, and at the same time she said the child’s name (one time). After 3 s the experiment leader briefly looked back at the child and then at the poster again for 3 s., hence, each pointing episode was maintained for at least 6 s. The outcome measure was coded as the proportion of trials in which the infants looked to the correct poster during this 6 s window. One infant (control) failed to complete this taskon all three visits and was therefore left out from subsequent analysis.
Initiating social communication was judged using the Object Spectacle Task from the
then allowed to manipulate the toy briefly. The tester remained silent but attentive to the child while the toy was active to allow the child to initiate joint attention bids vis-à-vis the spectacle. However, if the child initiated a bid (e.g., alternates eye contact between the active object and tester), the tester provided a natural but brief response (e.g., by smiling and
nodding or by saying “mmm hmmm”, or "Yes, I see!"). In this task the infants were presented with a total number of nine trials, including the presentation of three toys at
different times during the assessment. Each toy was presented three times in a row. Initiating social communication was coded as number of times the infants’ initiated joint attention by alternating their gaze between the activated toy (6 s time period) and the experimenter’s line of gaze. Proportion of alternating gazes across the nine trials was calculated as the outcome measure.
Results
There were no significant differences between the two groups in terms of birth
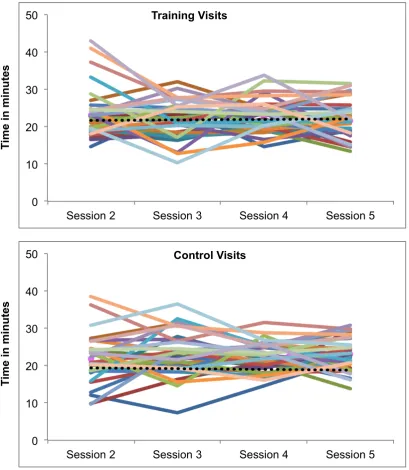
weight, parents’ age, parental educational level, or pre-intervention performance levels in any of the measured abilities (p-values = .13 -.74). Further, there were no significant differences between the two groups in time spent on screening viewing in the training and control sessions (p >.250; see Fig 2).
Analysis of changes in behaviour at the training tasks
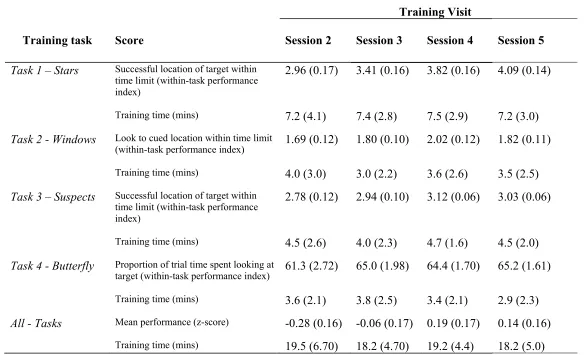
Table 2 shows the raw scores obtained from the training tasks. The dependent variables presented are described in the Methods section above. In addition, a composite z-score was calculated. This was done by converting each of the performance measures described above into a z-score on a per-task basis, and then averaging the z-scores into a single composite measure to index average performance across all four training tasks.
---INSERT TABLE 2 ABOUT HERE---
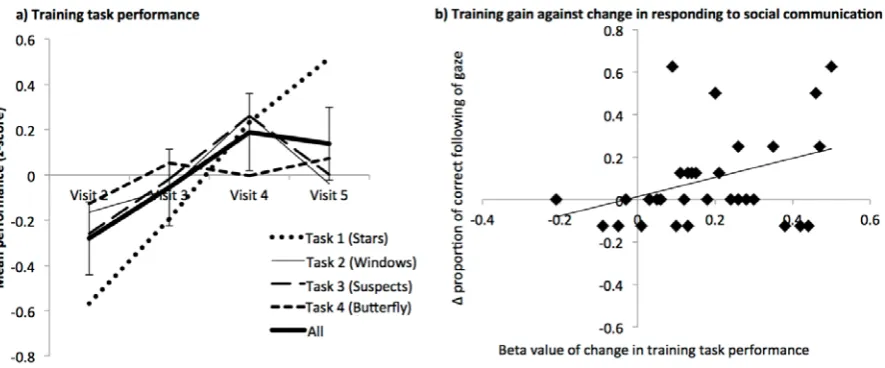
First we wished to examine whether training improvements were observed over the four training sessions. To do this we conducted a repeated-measure ANOVA with the single composite measure of task performance as the dependent variable and the main effect of Visit. A significant main effect of Visit was observed (F(3,99)=7.32, p<.001; see Fig 5a). This suggests that average performance at the training tasks improved significantly over the four visits, consistent with previous results (Wass, Porayska-Pomsta & Johnson, 2011).
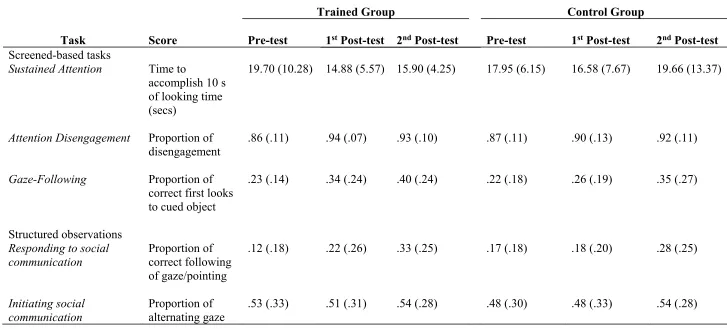
Table 3 shows the raw scores obtained from the pre-post assessment battery. Our planned main analyses were to compare performance between the pre- and post-test batteries, in order to assess whether greater changes in behaviour were observed between pre- and post-test in the trained than in the control group. To examine this we conducted a set of repeated-measure ANOVAs with group (trained and control) and post-assessment (first and second) as between- and within-subjects variables, respectively. The participants’ pre-assessment score was controlled for in all the analysis by adding pre-assessment score as a covariate
(Klingberg et al., 2005; Wass et al., 2011). In addition, prior to running the ANOVAs, the normalcy of the dependent variables was tested. Where pre-test and post-test scores were not normally distributed (as indicated by a Kolmogorov-Smirnov test), a log-transformed version of the difference scores was used instead. If normal distribution of both pre- and post-test scores could not be achieved with log-transformation, the difference scores were used (Dimitrov & Rumrill, 2003; Jamieson, 2004).
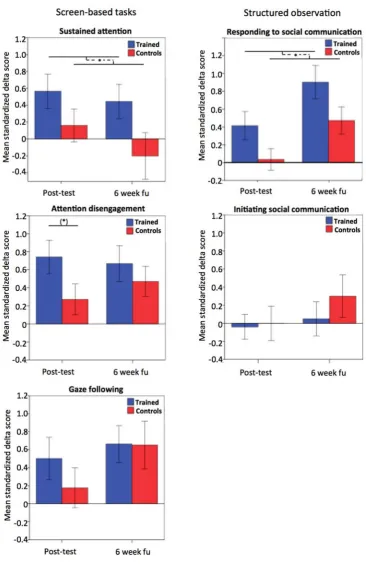
Effect sizes are given as partial 2, reflecting the proportion of explained variance in the dependent measure. Fig 4 illustrates standardized change in performance in the trained and control group on the post-assessments tasks relative to pre-assessment.
---INSERT TABLE 3 ABOUT HERE---
---INSERT FIG 4 ABOUT HERE---
Training effects on screen-based tests
time to reach 10 s accumulated looking) in the trained group as compared to the control group’s performance (see Figure 4). There was no significant interaction between group and post-assessment, F(1, 65) = .00, p >.250, partial2 = .00, indicating that the training gain in sustained attention did not significantly differ between the two post-assessments. As a complementary analysis we explored whether the group effects would be different or similar for social and non-social stimuli. Adding stimulus type (faces and houses) as a within-subject variable to the analysis did not reveal a significant interaction between group x stimulus (F(1, 64) = 1.20, p >.250,) or between group x stimulus x post-assessment (F(1, 64) = .05, p
>.250). This suggests that training gains were equivalent for social and non-social stimuli. For the attention disengagement task, our analysis showed no significant effect of group on the ability to disengage from a centrally presented stimuli to a lateral target, F(1, 62) = 1.75, p = .191, partial2 = .03, but a trend-significant interaction between group and
post-assessment, F(1, 62) = 3.36, p = .071, partial2 = .05. Post-hoc tests revealed a tendency for an increased ability to disengage in the trained group on the first
post-assessment, t(62) = 1.92, p = .060, but no significant difference between the two groups on the second post-assessment, t(62) = .62, p >.250, suggesting that the tendency for training-related improvements was only observed immediately following the intervention for this task. As a complementary analysis we explored whether the group effects would be different or similar for social and social stimuli. Adding stimulus type (emotional faces and non-face) as a within-subject variable to the analysis did not reveal a significant interaction between group x stimulus (F(2, 62) = .71, p >.250,) or between group x stimulus x post-assessment (F(2, 62) = 1.02, p >.250).
.03, and no interaction between group and post-assessment, F(1, 56) = .49 , p >.250, partial 2 = .01.
Training effects on the social communication assessments
From the structured observation assessment, we analyzed infants’ abilities to respond to and initiate non-verbal social communication (i.e., joint attention behaviors). We found a significant effect for an increase in proportion of response to social cues (i.e., following pointing and gaze) in the trained group compared to the control group, F(1, 66) = 4.24, p = .044, partial2 = .06. No significant interaction was found between post-assessment and
group, F(1, 66) = 0.00, p = .985, partial2 = .00, indicating that the training gain in the ability to respond to pointing and gaze cues did not significantly differ between the two post-assessments.
For the ability to initiate social communication (i.e., sharing attention by alternating gaze between an object and another person) we found no significant training effect, F(1, 67) = .01, p >.250, partial2 = .00, and no interaction between post-assessment and group, F(1,
67) = .22, p >.250, partial2 = .00.
communication in the structured observation task on the first post-assessment, r(33) = .38, p
Discussion
Consistent with previous studies (Ballieux et al., 2016; Wass et al, 2011), our results demonstrated that attention training in infancy leads to changes in performance at screen-based assessments of sustained attention. The trained group showed increased visual sustained attention immediately following training and at 6-week follow-up. Also in line with previous studies (Powell et al., 2016; Wass et al., 2011), the trained group showed a trend-significant increase in their ability to disengage (shift) attention, but only immediately following training and not at the 6-week follow-up. Interestingly, the significant training effect on sustained attention and trend-significant effect on attention disengagement were similar for non-social (e.g., houses) and social (i.e., faces) test stimuli, suggesting that the training paradigms may primarily target domain-general attention mechanisms that mediate the basic processes of attention holding and shifting in infants (Cohen, 1972). The sustained attention and attention disengagement tasks were both cognitively similar to elements of the training battery (see Table 1), but the screen layout (see Figures 1 and 3) and all of the details of the design (timing, structuring of the trials etc) were substantially different – suggesting that performance in a specific cognitive domain had been strengthened, and that transfer to a different, untrained measure of a similar cognitive domain was being observed.
However, no training effects were found on the infants’ ability to initiate social communication (i.e., sharing attention - alternating gaze between an object and the experiment leader). Although we can only speculate, it may be that the trained attention skills have weak transfer effects to tasks assessing the ability to initiate social
communication, because of the difference in tasks demands. It has been suggested that individual differences in initiating social communication behaviors may reflect to a larger extent social motivation aspects and temperament-like features, whereas responding to social communication has been proposed to involve more reflexive aspects of social attention orienting (Moore & Corkum, 1994). Research has also shown that the development of
initiating and responding to social communication behaviors follows different developmental trajectories. Whereas the latter behavior (responding) shows a linear increase in frequency between 9- and 18-months of age, this linear age-related change is not found in initiating social communication in this age group (Mundy et al., 2007).
The specific mechanisms mediating the training effects remain open, but given that the training gains were most evident for the paradigm designed to train visual search and
interference control (i.e., Task 1 Stars), it seems plausible that the gaze-interactive paradigms may primarily target networks involved in attention orienting (i.e., frontal eye fields,
homogenous training battery is applied. The current training battery contained a mixture of different types of non-social voluntary attention, ranging from visual search through to focused/sustained attention, making it hard to infer which aspect of the training battery is responsible for the training effects observed.
One of few studies examining the association between attention training and brain activity in relatively young children (Rueda, Checa & Cómbita, 2012) found that attention training leads to more efficient activation of attention network in 5-year-olds. So far, no study has investigated this topic in infants. If supported by further data (i.e., analyses of neural correlates), such a mechanism would provide direct support for models emphasizing a significant role of basic attention networks in human social behavior and social learning (Mundy & Newell, 2007).
A potential inconsistency in our results is that we found no significant effects of training on the screen-based gaze following task – despite that this task putatively tested similar cognitive functions as the tasks assessing infants’ response to naturalistic
In sum, our results support hierarchical models of cognitive development and the idea of basic visual attention as an important “building block” for more complex socio-cognitive skills. They show that training basic, non-social attention processes in infancy leads to increases in infants’ responsiveness to social communicative cues. This finding is of interest not only for modeling the dynamics of early cognitive development, but also as a proof-of-principle for developing novel intervention methods. However, it should also be noted that even the tabletop tasks we used were still simplified, and reductionist, relative to the
References
Ballieux, H., Wass, S. V., Tomalski, P., Kushnerenko, E., Karmiloff-Smith, A., Johnson, M. H., & Moore, D. G. (in press). Training attention control outside the lab: applying gaze-contingent training to infants from diverse SES backgrounds. Journal of Applied Developmental Psychology 43, 8-17.
Bryck, R. L., & Fisher, P. A. (2012). Training the brain: practical applications of neural plasticity from the intersection of cognitive neuroscience, developmental psychology, and prevention science. American Psychologist, 67, 87-100.
Carpenter, M., Nagell, K., & Tomasello, M. (1998). Social cognition, joint attention, and communicative competence from 9 to 15 months of age. Monographs of the Society for Research in Child Development, 63(4), V-143.
Cohen, L. B. (1972). Attention-getting and attention-holding processes of infant visual preferences. Child Development, 43, 869–879.
Colombo, J., & Cheatham, C. L. (2006). The emergence and basis of endogenous attention in infancy and early childhood. Advances in child development and behavior, 34, 283-322.
Dawson, G., Munson, J., Estes, A., Osterling, J., McPartland, J., Toth, K., . . . Abbott, R. (2002). Neurocognitive function and joint attention ability in young children with autism spectrum disorder versus developmental delay. Child Development, 73(2), 345-358.
Diamond, A., & Lee, K. (2011). Interventions shown to aid executive function development in children 4 to 12 years old. Science, 333, 959-964.
Forssman, L., Ashorn, P., Ashorn, U., Maleta, K., Matchado, A., Kortekangas, E., & Leppänen, J. M. (2016). Eye-tracking-based assessment of cognitive function in low-resource settings. Archives of Disease in Childhood. doi:10.1136/archdischild-2016-310525
Forssman, L., Peltola, M., Yrttiaho, S., Puura, K., Mononen, N., Lehtimäki, T., & Leppänen, J. (2014). Regulatory variant of the TPH2 gene and early life stress are associated with heightened attention to social signals of fear in infants. Journal of Child Psychology & Psychiatry, 55, 793-801. doi: 10.1111/jcpp.12181
Frank, M. C., Amso D., & Johnson, S. P. (2014). Visual search and attention to faces during early infancy. Journal of Experimental Child Psychology, 118, 13-26.
Frischen, A., Bayliss, A. P., & Tipper, S. P. (2007). Gaze cueing of attention: Visual attention, social cognition, and individual differences. Psychological bulletin, 133(4), 694-724.
Heckman, J. J. (2006). Skill formation and the economics of investing in disadvantaged children. Science, 312(5782), 1900-1902. doi: 10.1126/science.1128898
Jamieson, J. (2004). Analysis of covariance (ANCOVA) with difference scores. International Journal of Psychophysiology, 52(3), 277–283.
Johnson, M. H. (2012). Executive function and developmental disorders: the flip side of the coin. Trends in Cognitive Sciences, 16(9), 454-457.
Johnson, M. H., Gliga, T., Jones, E. J. H., & Charman, T. (2015). Annual Research Review: Infant development, autism, and ADHD – early pathways to emerging disorders.
Journal of Child Psychology and Psychiatry, 56(3), 228-247.
Keehn, B., Müller, R.-A., & Townsend, J. (2012). Atypical attentional networks and the emergence of autism. Neuroscience & Biobehavioral Reviews, 37(2), 164-183. Klingberg, T., Fernell, E., Olesen, P. J., Johnson, M., Gustafsson, P., Dahlstrom, K., et al
(2005). Computerized training of working memory in children with ADHD – A randomized, controlled trial. Journal of the American Academy of Child and Adolescent Psychiatry, 44(2), 177–186.
Lawson, K. R., & Ruff, H. A. (2004). Early attention and negative emotionality predict later cognitive and behavioural function. International Journal of Behavioral Development, 28(2), 157-165. doi: 10.1080/01650250344000361
Leekam, S. R., Lopez, B., & Moore, C. (2000). Attention and joint attention in preschool children with autism. Developmental Psychology, 36(2), 261-273.
Leppänen, J. M., Forssman, L., Kaatiala, J., Yrttiaho, S., & Wass, S. (2014). Widely applicable MATLAB routines for automated analysis of saccadic reaction times.
Behavior Research Methods, 47(2), 1-11. doi:10.3758/s13428-014-0473-z
Lundqvist, D., Flykt, A., & Öhman, A. (1998). The Karolinska Directed Emotional Faces - KDEF, CD ROM from Department of Clinical Neuroscience, Psychology section, Karolinska Institutet, ISBN 91-630-7164-9.
Moore C., & Corkum, V. (1994). Social understanding at the end of the first year of life.
Developmental Review, 14, 349-372.
Mundy, P., Block, J., Delgado, C., Pomare, Y., Vaughan Van Hecke, A., & Venezia Parlade, M. (2007). Individual differences and the development of joint attention in infancy.
Child Development, 78, 938-954.
Mundy, P., & Newell, L. (2007). Attention, joint attention, and social cognition. Current Directions in Psychological Science, 16, 269-274.
Petersen, S. E., & Posner, M. I. (2012). The attention system of the human brain: 20 years after. Annual review of neuroscience, 35, 73.
Powell, G., Wass, S. V., Erichsen, K., & Leekam, S. R. (2016). First evidence of the
feasibility of gaze-contingent attention training for school children with autism. Autism. doi: 1362361315617880.
Rose, S. A., Feldman, J., & Janokowski, J. (2003). The building blocks of cognition. The Journal of Pediatrics, 157, 662-667.
Rose, S. A., Feldman, J. F., & Jankowski, J. J. (2009). A Cognitive Approach to the Development of Early Language. Child Development, 80(1), 134-150. doi: 10.1111/j.1467-8624.2008.01250.x
Rueda, M. R., Checa, P., & Cómbita, L. M. (2012). Enhanced efficiency of the executive attention network after training in preschool children: Immediate changes and effects after two months. Developmental Cognitive Neuroscience, 2, 192-204.
Ruff, H. A., & Rothbart, M. K. (1996). Attention in early development: Themes and variations. New York, NY: Oxford University Press.
Senju, A., & Csibra, G. (2008). Gaze following in human infants depends on communicative signals. Current Biology, 18, 668-671
Sheese, B. E., Rothbart, M. K., Posner, M. I., White, L. K., & Fraundorf, S. H. (2008). Executive attention and self-regulation in infancy. Infant Behavior and Development,
31(3), 501-510.
doi:10.1016/j.earlhumdev.2011.09.001
Wass, S. V. (2014a). Applying cognitive training to target executive functions during early development. Child Neuropsychology. doi:DOI 10.1080/09297049.2014.882888. Wass, S. V. (2014b). Comparing methods for measuring peak look duration: are individual
differences observed on screen-based tasks also found in more ecologically valid contexts? . Infant Behavior and Development., 37(3), 315-325.
Wass, S., Porayska-Pomsta, K., & Johnson, M. H. (2011). Training attentional control in infancy. Current Biology, 21, 1543-1547.
Figures
Figure 2. Illustrates the participants’ time spent on spent on screen viewing in the four training (upper panel) and control (lower panel) sessions (visit 2-5). The solid lines represent individual participants time spent in each session and the dotted lines represent the averaged time for the trained and control groups, respectively.
0 10 20 30 40 50
Session 2 Session 3 Session 4 Session 5
0 10 20 30 40 50
Session 2 Session 3 Session 4 Session 5
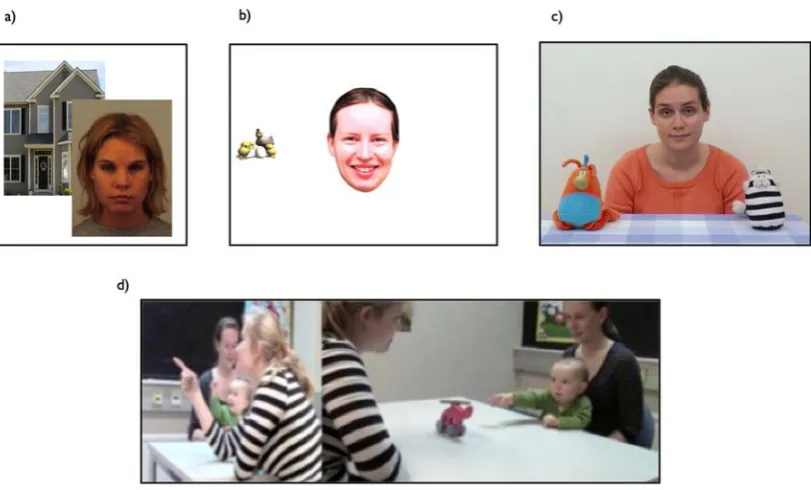
Figure 3.Illustration of the pre-post test battery a) Sustained Attention (screen task): A single central image (house or face) was presented on the screen and the time required to
accumulate a total of 10 s looking time was recorded; b) Attention Disengagement (screen task): A central image (emotional face or control image – scrambled face) was presented, followed by a lateral stimulus after 1000ms. The likelihood of disengaging from the central stimulus was calculated; c) Gaze Following (screen task): An actress looked directly to camera, then down at one of two objects on a table. The proportion of trials in which infants followed the actress’ gaze was calculated; and d) Social Communication (structured
observation assessment): To assess responsiveness to social communication (left) an
experimenter pointed to one of a series of 4 posters on the wall. The likelihood of the infant responding to the experimenter’s cue was calculated. To assess initiation of social
Figure 4. Illustrates mean standardized change (delta) scores in performance, i.e.,
Figure 5. a) Changes in performance within the training task. Individual lines show changes in performance across the four training sessions for the individual training tasks administered.
[image:35.595.79.522.97.281.2]Table 1.
Summary descriptions of training tasks and pre-post assessment tasks.
Task Description and construct
Training tasks
Task 1 – Stars A target was presented on-screen along with a number of static and moving distractors. If the child looked to the target within a time window, they received a reward. Construct: attention shifting and flexible search for changing targets
Task 2 – Windows A target was presented in one location on screen. All four windows then closed and a fixation target appeared for a variable inter-stimulus interval. After the fixation target disappeared, a look back to the cued window triggered a reward.
Construct: visuospatial short-term memory
Task 3 – Suspects A target was presented along with a range of distractors. If the child looked to the target within a time window, they received a reward. Once per block of 12 trials the target changed. Targets from the previous block were presented concurrently with the current target, as distractors.
Construct: attention shifting, and flexible search for changing targets
Task 4 – Butterfly The target scrolled from left to right only when the child looked directly at it, with static and moving distractors presented in the child’s peripheral visual field. If the child looked to any of the distractors, they disappeared and the target stopped moving.
Construct: suppressing the prepotent response to look towards moving distractors
Pre-post assessment tasks Screen-based tasks
Sustained attention A single central image (image of house or face) was presented in the center of the screen and remained on-screen until 10s of accumulated looking time had been collected.
Construct: Visual sustained attention.
stimulus was presented centrally followed by an attractive moving target laterally. The time taken to disengage from the central stimulus was recorded. Construct: Attentional disengagement.
Gaze following An actress was filmed looking directly at the camera, then down at one of two objects. The proportion of correct to incorrect looks to the gaze-cued object was recorded.
Construct: Gaze following. Structured observations
Responding to social
communication Experimenter established contact with the child then looked and pointed to one of a series of 4 posters on the wall. The proportion of trials in which the infant looked at the cued poster was recorded.
Construct: Responsiveness to social communicative cues (i.e., responding to joint attention).
Initiating social
communication The experimenter presented a toy to the child. The number of times in which the infant alternated their gaze between the toy and the experimenter’s line of gaze was recorded.
Table 2.
Mean (SD) raw performance scores for participants in the trained group on the training tasks. Exact descriptions of how performance measures were calculated for each task are given in the Results section. In addition, a summary score of performance measures across all tasks is given. This is derived from a composite of Z-scores calculated on a per-task basis.
Training Visit
Training task Score Session 2 Session 3 Session 4 Session 5
Task 1 – Stars Successful location of target within time limit (within-task performance index)
2.96 (0.17) 3.41 (0.16) 3.82 (0.16) 4.09 (0.14)
Training time (mins) 7.2 (4.1) 7.4 (2.8) 7.5 (2.9) 7.2 (3.0)
Task 2 - Windows Look to cued location within time limit
(within-task performance index) 1.69 (0.12) 1.80 (0.10) 2.02 (0.12) 1.82 (0.11)
Training time (mins) 4.0 (3.0) 3.0 (2.2) 3.6 (2.6) 3.5 (2.5)
Task 3 – Suspects Successful location of target within time limit (within-task performance index)
2.78 (0.12) 2.94 (0.10) 3.12 (0.06) 3.03 (0.06)
Training time (mins) 4.5 (2.6) 4.0 (2.3) 4.7 (1.6) 4.5 (2.0)
Task 4 - Butterfly Proportion of trial time spent looking at
target (within-task performance index) 61.3 (2.72) 65.0 (1.98) 64.4 (1.70) 65.2 (1.61)
Training time (mins) 3.6 (2.1) 3.8 (2.5) 3.4 (2.1) 2.9 (2.3)
All - Tasks Mean performance (z-score) -0.28 (0.16) -0.06 (0.17) 0.19 (0.17) 0.14 (0.16)
Table 3
Mean (SD) raw pre- and post-assessment scores for the participants in the trained and control groups on the screen-based tasks and the structured observation
Trained Group Control Group
Task Score Pre-test 1st Post-test 2nd Post-test Pre-test 1st Post-test 2nd Post-test
Screened-based tasks
Sustained Attention Time to
accomplish 10 s of looking time (secs)
19.70 (10.28) 14.88 (5.57) 15.90 (4.25) 17.95 (6.15) 16.58 (7.67) 19.66 (13.37)
Attention Disengagement Proportion of
disengagement .86 (.11) .94 (.07) .93 (.10) .87 (.11) .90 (.13) .92 (.11)
Gaze-Following Proportion of
correct first looks to cued object
.23 (.14) .34 (.24) .40 (.24) .22 (.18) .26 (.19) .35 (.27)
Structured observations
Responding to social
communication Proportion of correct following of gaze/pointing
.12 (.18) .22 (.26) .33 (.25) .17 (.18) .18 (.20) .28 (.25)
Initiating social
Footnote
i In addition to these three eye tracking tasks, a fourth screen-based task was administered, a