Muhamedsalih, Hussam, Jiang, Xiang and Gao, F.
Acceleration computing process in wavelength scanning interferometry
Original Citation
Muhamedsalih, Hussam, Jiang, Xiang and Gao, F. (2011) Acceleration computing process in
wavelength scanning interferometry. In: 10th International Symposium on Measurement
Technology and Intelligent Instruments (ISMTII2011), 29th June 2nd July 2011, Daejeon, S.
Korea. (Unpublished)
This version is available at http://eprints.hud.ac.uk/id/eprint/15369/
The University Repository is a digital collection of the research output of the
University, available on Open Access. Copyright and Moral Rights for the items
on this site are retained by the individual author and/or other copyright owners.
Users may access full items free of charge; copies of full text items generally
can be reproduced, displayed or performed and given to third parties in any
format or medium for personal research or study, educational or notforprofit
purposes without prior permission or charge, provided:
•
The authors, title and full bibliographic details is credited in any copy;
•
A hyperlink and/or URL is included for the original metadata page; and
•
The content is not changed in any way.
For more information, including our policy and submission procedure, please
contact the Repository Team at: [email protected].
NOMENCLATURE
FN = Total Captured Frame Number, FW = Frame Width OPD=optical path difference, FH=Frame Height WSI=Wavelength Scanning Interferometry AOTF = acousto-optic tunable filter
1. Introduction
Optical interferometry devices are widely used in metrology for surface inspection because of the non-contact measurement methodology, high measurement resolution and high throughput inspection. Various interferometry methods of surface inspection have been developed for different applications such as Phase shift interferomtery, white light interferomtry and wavelength scanning interferometry (WSI) (Jiang X. et al., 2010). The phase shift interferometry is typically used for two dimensional profiles, areal topographies, and for measurements that requires high resolution and throughput. The main limitation of this type of interferometry is the phase ambiguity that occurs when measuring discontinuous surfaces with heights exceed a half of the illumination wavelength. Therefore, the application of this kind of interferomtry is limited to non rough
and highly polished surfaces inspections (Caber, 1993). This limitation was overcome by developing a white light interferometry. Measuring the coherence of white light is used to indicate the zero optical path difference position (i.e OPD=0) for each measurement point (Schwider, 1994). Typically, the coherence measurement is measured by performing mechanical scanning using a piezo-electric transducer. Nevertheless, the mechanical scanning might cause measurement error due to some of piezo-mechanical performance such as hysteresis and creep. An alternative method of measuring large discontinuous surfaces, using wavelength scanning technique, was reported by many researchers worldwide in the field of areal surface measurement such as (Kuwamura S. et al., 1997). This technique can measure areal topography for large step discontinuous surfaces with a nano-meter resolution without any mechanical scanning. Nevertheless, the WSI system needs to capture a large amount of data during wavelength scanning process. This mechanism can reduce the inspection throughput which is an important demand in the industry. This paper describe WSI method for measuring large step height discontinuous surfaces and focus on a solution to accelerate the computing process in order to increase the inspection throughput. A CUDA C program is proposed to achieve data parallelism for accelerating a computing analysis of the captured data.
ACCELERATION COMPUTING PROCESS IN
WAVELENGTH SCANNING
INTERFEROMETRY
H. Muhamedsalih*, X. Jiang and F.Gao
Centre for precision Technologies, University of Huddersfield, Huddersfield, HD1 3DH, The U.K Corresponding author: Email: [email protected] (Hussam Muhamedsalih)
Tel.: +44 1484 472769; fax: +44 1484 472161.
KEYWORDS : Wavelength Scanning Interferometry, Optical Metrology, AOTF, CUDA programming
The optical interferometry has been widely explored for surface measurement due to the advantages of non-contact and high accuracy interrogation. Eventually, some interferometers are used to measure both rough and smooth surfaces such as white light interferometry and wavelength scanning interferometry (WSI). The WSI can be used to measure large discontinuous surface profiles without the phase ambiguity problems. However, the WSI usually needs to capture hundreds of interferograms at different wavelength in order to evaluate the surface finish for a sample. The evaluating process for this large amount of data needs long processing time if CPUs traditional programming is used. This paper presents a parallel programming model to achieve the data parallelism for accelerating the computing analysis of the captured data. This parallel programming is based on CUDATM C program structure that developed by NVIDIA. Additionally, this paper explains the mathematical algorithm that has been used for evaluating the surface profiles. The computing time and accuracy obtained from CUDA program, using GeForce GTX 280 graphics processing unit (GPU), were compared to those obtained from sequential execution Matlab program, using Intel® Core™2 Duo CPU. The results of measuring a step height sample shows that the parallel programming capability of the GPU can highly accelerate the floating point calculation throughput compared to multicore CPU.
This computing architecture manipulates the data in a parallel manner opposed to traditional programs which manipulate data sequentially.
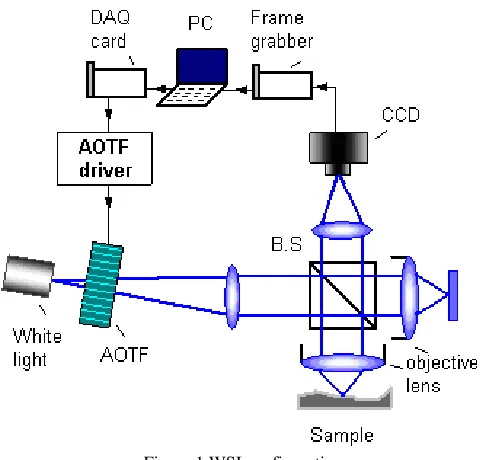
2. The WSI System
The interferometry system, shown in figure 1, is composed of a Linnik interferometer, a halogen white light source and acousto-optic tunable filter (AOTF). The interface cards (i.e. DAQ and frame grabber) are used to communicate the PC with the optical environment. The AOTF is key feature of this experimental setup. It is placed after a halogen white light to diffract a specific wavelength and pass to a Linnik interferometer. The wavelength diffraction depends on the AOTF driving frequency. Thus by changing the driving frequency, wavelength scanning process is achieved. In this experiment, the wavelength is scanned from 682.8nm to 552.8nm with less than 1.5nm bandwidth resolution for each wavelength.
[image:3.595.44.285.268.498.2]\
Figure 1 WSI configuration
Different wavelengths of light are diffracted from the AOTF in sequence so that a series of interferograms are detected via a two dimensional CCD. The absolute optical path difference can be determined by analyzing these interferograms. During wavelength scanning process, 128 frames are captured by the CCD hence each frame is captured at a specific wavelength. Every pixel in a captured frame represents a specific point upon the surface of a measured sample. Therefore, the intensity values captured by each CCD pixel are gathered and analyzed individually. Since the optical path difference is fixed at each pixel, a sinusoidal intensity distribution is obtained from the wavelength scanning process as shown in figure 2.a. Each point in this distribution has it own scanned wavelength. Equation 1 describes the mathematical expression of the intensity distribution (Hariharan, 2003).
(i)) xy cos( xy b xy a (i) xy
I = +
ϕ
(1)I is an intensity value captured by a CCD pixel. i is the iteration of the captured frame number (1,2,..,FN). x and y are the pixel numbers in horizontal and vertical directions of the CCD respectively. a and b are constant values. These constant values are function of the light intensities that reflect from interferometer arms. φ is the phase shift caused by altering wavelength of the broadband light. The phase of the intensity distribution depends on the scanned wavelength and the
optical path difference (i.e. height of the measured sample), as described in equation 2.
h 2 * 2 (i) i λ π
ϕ = (2)
λi is the scanning wavelength and h is the sample step height. A
standard 4.707µm step height sample is measured by the proposed system to verify the analysis methods. Fourier transform algorithm (FFT) is used to manipulate the captured intensity pattern and determine the surface structure.
3. Mathematical Description
The captured frames obtained from WSI, are analyzed using FFT algorithm. The intensity values of each pixel need to be gathered and analyzed individually from other pixels. This section describes a mathematical approach to evaluate the data captured by one of the CCD pixels. The mathematical expression of equation 1 can be rewritten in form of equation 3 for the convenience of explanation.
(i) xy j e xy b 2 1 (i) xy j e xy b 2 1 (i) xy a xy(i) I ϕ ϕ − − + = (3)
Equation 3 can be simplified by considering the following notations. ϕ j e b 2 1
c= and * be j
2 1
c = ϕ
Then, Ixy(i)=a+c+c* (4)
FFT is applied to equation 4 to find the spectrum of the intensity distribution. The spectrum contains three main terms as stated in equation 5. The first term is constant amplitude that related to the light intensity in each interferometer arm, the second and third terms are related to the fringe frequency recorded by the pixel.
The purpose of FFT is to distinguish between the useful information which is induced by the phase change (i.e. c or c* term) and the unwanted information of constant amplitude (i.e. A). The spectrum of equation 5 can be rewritten in a matrices form as shown in equation 6. The fo is a spatial frequency corresponded to the wavelength scanning and it is function of the optical path difference.
) f (f C ) f C(f A(f)
FFT[I(i)]= + − o + * + o (5)
xy o * o xy . ) f (f C . . ) f C(f . A(f) I(n) . . . . I(2) I(1) FFT + − = (6)
The unwanted spectrum A and C* are filtered out by replace their values to zeros as shown matrix 7.
The inverse FFT is applied to matrix 7 to reconstruct the c value in equation 4. Then, natural logarithm is applied to separate the phase φ from the unwanted amplitude variation b, as illustrated in equation 8 and 9.
ϕ
ϕ b] j
2 1 In[ ] e b 2 1 In[
I'= j = + (8)
xy xy o xy ' ' ' j(n ) ln(0.5b(n) . . . . j(2 ) ln(0.5b(2) j(1 ) ln(0.5b(1) ) 0 0 0 . ) f C(f . 0 ln(ifft (n) I . . . . (2) I (1) I = = ∓ ∓ ∓ (9)
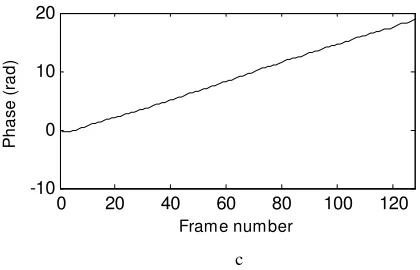
Each determined values in equation 9 consists of real and imaginary parts. The phase shifts are extracted from the imaginary parts as shown in Figure 2.b. This figure suffers from discontinuities because the computed phase is limited with range of –π to π. These discontinuities are corrected by adding 2π to the discontinuous parts in order to obtain a continuous phase distribution as shown figure 2.c.
Finally, the optical path difference (OPD) is determined from the slop of the phase as stated in equation 10.
− ∆ = n m λ λ π ϕ 1 1 2 OPD (10)
∆φ is the change in phase between any two points in figure 4. λm and λn are the correspondence wavelengths of phase difference (∆φ). In order to obtain areal topography for the captured sample, the described analysis steps should be applied to the entire pixels. As example, to find the areal topography of a sample viewed by 640x480 CCD pixels, the data analysis needs to be executed 307200 times in a sequential manner if a tradition C program is used with multicore CPUs. This evaluation strategy can significantly reduce the measurement throughput. Therefore, a parallel programming model is proposed to accelerate the computing process using GTX280 GPUs as explained in the following sections.
a
b
0 20 40 60 80 100 120
[image:4.595.309.519.64.199.2]-10 0 10 20 Frame number P h a s e ( ra d ) c
Figure 2 Measured Interference fringe and retrived phase distribution: (a) intensity distribution of 128 frames for one pixel (b) retrived phase discontinuity distribution (c) phase continuity distribution.
4 Acceleration of Computing Process
The evaluating process for areal topograpgy needs long processing time if CPUs traditional sequential execution programs are used. The CUDA C program is used to achieve the data parallelism, hence increasing the measurement throughput. Typically, in a sequential programming model, the program generates a main thread that executes functions in a sequential manner. In contrast, the CUDA parallel programming model generates thousands to millions number of thread to execute data-parallel functions, know as kernels, in a parallel manner. The CUDA program structure consists of a host (CPU) code and a device (GPU) code (Kirk D. et al., 2010). The host code launches the kernels, declares the threads organization and manipulates the data that needs no data parallelism. The device executes the kernels by using the generated threads. In this paper, the device code is written in form of kernels, in addition to FFT parallel functions provided by NVIDIA® CUDA™ Fast Fourier Transform library.
4.1 The Proposed CUDA structure
The proposed program consists of host code that executes on CPU and device code that executes on GPU as shown in figure 5. The host code is written to arrange the captured data in a form suitable for WSI analysis procedure that described in section 3. After that, the host code launches API CUDA memory arrangement functions to copy the organized data into the GPU memory spaces. Then, the host declares the configuration of thread organization. Finally, the host invokes NVIDIA FFT library functions as well as written kernels in sequence to evaluate the data according to the WSI analysis steps.
The invoked device code (e.g. kernel) is executed on the GPU by the generated threads. The results of the device code are stored in the GPU memory.
4.1.1 Data arrangement
The demonstrated WSI measurement is based on capturing 128 frames during the wavelength scanning process. The captured frames are stored in the CPU main memory in a successive manner. Thus, the first frame is placed in a linear memory followed by the second frame and so on till the last frame. Since gathering of intensity values for each pixel is essential in the described analysis procedure, the host code is used to achieve the gathering and place all the pixels values into a linear array. This array is presented as (aHost). The aHost consists of data segments. The number of segments is equal to the
0 20 40 60 80 100 120
20 30 40 50 60 70 Frame number In te n s ity ( a rb -u n it)
0 20 40 60 80 100 120
number of CCD pixels (i.e. 640x480). Each segment contains the intensity values of a correspondence pixel, so each segment has length equal to the number of captured frames (i.e. FN=28). The data segments are placed in a successive manner. That is, the segment of the first pixel is placed first followed by segment of the second pixel and so on till segment of the last pixel. The organized form is shown in figure 3.
[image:5.595.49.274.153.194.2]
Figure 3 Data structure of aHost.
4.1.2 Data Transfer
The Data transaction is essential in CUDA programming because the GPU has separate memory spaces from the CPU. The aHost is transferred from the CPU main memory to GPU global memory. This kind of memory can be viewed by the entire grid. As a result, all the grid threads can access the global memory to read or write data. The transferring process consists of two parts. The first part is to allocate fraction of the global memory to receive the transferred data. This allocated fraction of memory is presented as (aDevice). The size of aDevice is equal to the size of aHost in the main memory. The allocation is achieved by using CUDA API function cudaMalloc(). The second part is to copy aHost from the CPU to aDevice in the GPU. This is achieved by CUDA API function cudaMemcpy() (NVIDIA, 2008).
4.2.2 Thread Organisation
The proposed kernels generate threads equal to the number of CCD pixels. Thus, each thread manipulates its correspondence data segment. These threads are organised in a grid. The grid consists of (40x30) array of blocks. Each block consists of (16x16) threads as shown in figure 4.
Figure 4 Thread Organisation. Developed from (Kirk D et al., 2010)
The gird organisation parameters are stored as struct variables. The dimension of a grid in terms of blocks is given as dimGrid and the dimension of a block in terms of threads is given as dimBlock. This thread hierarchy provides the capability to designate each thread to its own data segment. The designation is achieved by using indices
of both blocks and threads. Each block in a grid has its unique index that is introduced as a two dimensional variable (NVIDIA, 2008). The block index is generated by CUDA runtime system and introduced as blockIdx.x and blockIdx.y. The same is applied for each thread in a block. As a result, each thread can be identified also by two variables threadIdx.x and threadIdx.y. As example, the index of the last block in figure 4 is (blockIdx.x=29, blockIdx.y=39) and the index of the first thread in this block is (threadIdx.x=0, threa dIdx.x=0).
4.2.3 Kernel Invocation and Execution
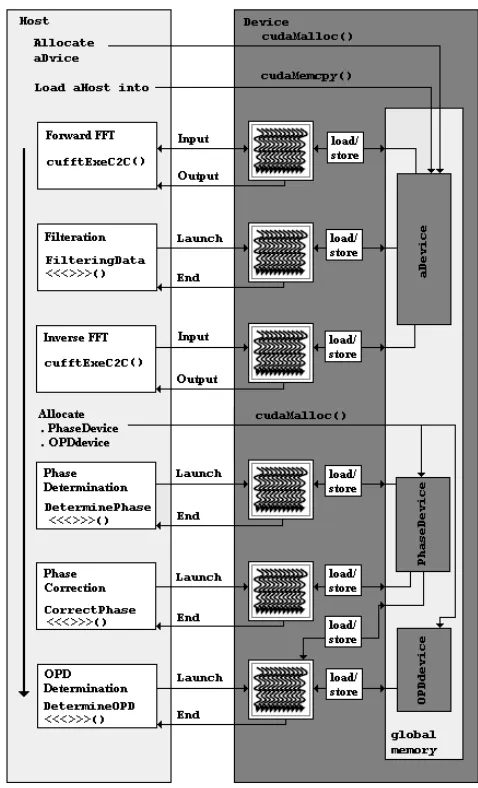
[image:5.595.321.560.284.678.2]After the data transaction and thread generation, the NVIDIA® CUDA™ Fast Fourier Transform (FFT) library functions and four written kernels are invoked in a sequence that explained in section 3. The kernels invocation are synchronised with GPU execution. Thus, each kernel is invoked from the host after getting a response from the device acknowledges that the execution process of a previous operation is finished as shown in figure 5.
Figure 5 The proposed CUDA program structure.
[image:5.595.52.210.506.709.2]captured frame (i.e FW*FH). Then the configured plan is handled to cufftExecC2C() function to execute the FFT according to the configuration. The last parameter of cufftExecC2C() function decides whether the function should perform forward or inverse FFT. The result of this operation is stored as float2 type on the same data array aDevice. Thus aDevice.x and aDevice.y are used to store the real and imaginary parts respectively.
The unwanted information is filtered out from all data segments of the pixels in a parallel manner by a written kernel called Filtering Data<<< dimGrid,dimBlock >>>(). The FilteringData kernel is invoked from the host code and executed on the device. This kernel is mainly consists of two parts. The first part is written to determine the offset addresses of data segments for their generated threads. Although the form of data that illustrated in figure 3 is placed in linear memory, this form can be considered as a two dimensional array in order to fit with the thread organisation that shown in figure 4. So, each data segment is manipulated by a correspondence thread in the generated grid. For example, the data segment of the first pixel in the CCD is manipulated by thread(0,0) in block(0,0), and the data segments of the last pixel in the CCD is manipulated by thread(15,15) in block (39,29). Since each data segment contains FN number of elements, each thread determines the offset address of its data segment by using equation 11.
DataSegmentOffSet=(row*FW*FN)+(col*FN) (11) The row and col represent the row and column addresses of the correspondence thread respectively. These addresses are calculated by using equation 12 and 13 respectively.
row = dimBlock*blockIdx.y + threadIdx.y (12) col = dimBlock*blockIdx.x + threadIdx.x (13)
Equation 12 and 13 show that the block and thread indices are used to guide each thread to its own data segment. Each thread has a dedicated memory space called register. These registers can be viewed and accessed by its thread only. So, the determined offset address values of data segments are stored in these threads’ registers. The second part of FilteringData kernelis written to perform the filtering process by using equation 14 and 15. The generated threads execute these equations in a parallel manner. Each thread calls its offset data segment from the register. The i value in these equations refers to the data segment element. For example, to set the first element of all data segments in aDevice to zero, the i value in these equations should be set to zero.
aDevice[DataSegmentOffSet+i].x=0 (14) aDevice[DataSegmentOffSet+i].y=0 (15)
Equations 14 and 15 are placed in for–loop statement to perform the filtering process for the unwanted elements as described in equation 7.
Then the filtered aDevice array is processed by the inverse of FFT, as discussed in equation 9, in a parallel manner using CUFFT library. The same cufftExecC2C function is used with same plan configuration but the last parameter is replaced by CUFFT_INVERSE instead of CUFFT_FORWAR.
The inversed FFT aDevice array is processed with the remained three kernels. New two arrays are allocated in the device global memory to store and load the results obtained from the kernels. These
arrays are PhaseDevice and OPDdevice. The DeterminePhase < < < > > > ( ) kernel is written to apply the natural logarithm to aDevice and store the result in PhaseDevice. The CorrectPhase <<<>>>() kernel is written to correct the discontinuity in the phase by adding 2π. The last kerrnel DetermineOPD<<<>>>() is written to determine the optical path differences for the entire surface. This
kernel load data from PhaseDevice array and store the result in OPDdevice array. These three kernels are written in the same manner
of the FilteringData kernel.
5. Result and Discussion
The effectiveness of the parallel programming performance for the proposed system has been investigated by measuring the processing time of evaluation for different amounts of captured data. A measurement of 4.707µm sample was repeated four times with frames sets (64, 128, 256 and 512) respectively. The captured frames size is (640x480) pixels. The computing time and accuracy obtained from CUDA program, using GeForce GTX 280, were compared to those obtained from sequential execution Matlab simulation, using Intel® Core™2 Duo CPU.
Table 1 shows that the proposed program has accelerated the computing process compared to a sequential execution programming. Nevertheless, the acceleration factor is reduced when the captured frame number is increased. This is typically because of the memory limitation of the GTX 285 according to the proposed measurement method. The reduction in the acceleration factor can be enhanced by using up-to-date GPUs which are continuously improved in terms of the number of processing cores and the size of memory spaces. Table 1 Parallel programming performance versus sequential programming.
The accuracy of the results was examined by calculating the absolute maximum difference of several points obtained from CUDA program and Matlab simulation. Table 2 shows that the absolute differences are in sub of a nano-meter and this satisfies the requirements of the WSI system.
Table 2 Accuracy of CUDA program with respect to Matlab
Frame Number 64 128 256 512
Absolute maximum difference (nm)
0.00312 0.00626 0.00295 0.00435
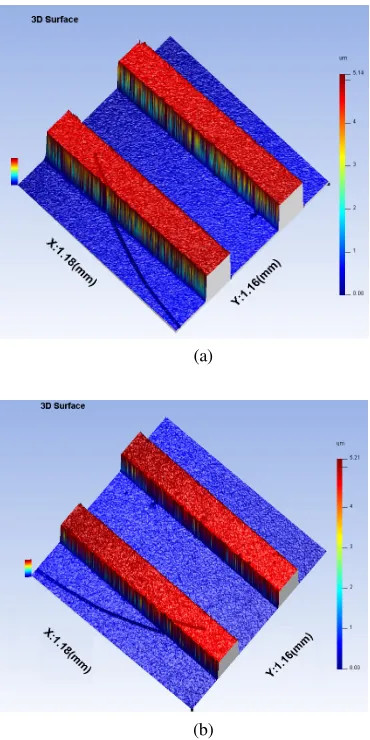
Figure 6 demonstrates the measurement of 4.707µm standard sample using WSI system. Figure 6.a is the result obtained from CUDA C program and Figure 6.b is the result obtained from Matlab simulation.
Frame Number 64 128 256 512
Matlab Processing Time (msec)
12036.9 20711.6 31990.3 61222.5
CUDA C Processing time (msec)
182 422 1159 2845
Accelerating Factor
(a)
[image:7.595.64.249.68.438.2](b)
Figure 6 The measurement of 4.707µm sample (a) using CUDA C (b) using Matlab.
6. Conclusions
Large steps height samples can be measured using wavelength scanning technique with a nano-meter accuracy. A 4.707µm step standard sample was measured with 1nm resolution. The measurement throughput for the proposed WSI system can be improved by using parallel programming on GPUs. The proposed CUDA C parallel programming is used with GPU type GTX285 to accelerate the computing process up to 49 times approximately for 128 captured frames. The floating point calculation accuracy of CUDA program satisfies the WSI precision requirement.
ACKNOWLEDGEMENT
The authors gratefully acknowledge the Engineering and Physical Sciences Research Council (EPSRC) UK for supporting this research work under its IKC programme. The author X. Jiang gratefully acknowledges the Royal Society under a Wolfson-Royal Society Research Merit Award and the European Research Council under its programme ERC-2008-AdG 228117-Surfund.
REFERENCES
1. Jiang X. et al., “Fast Surface Measurement Using Wavelength Scanning Interferometry with Compensation of Environmental Noise”, Applied Optics, Vol. 49, No. 15, 2010.
2. Caber P., “Interferometric profiler for rough surfaces”, Applied Optics, Vol. 32, No. 19, 1993.
3. Schwider J., Zhou L, “Dispersive Interferometric Profilometer“, Optics Letters, Vol.19, No.13, 1994.
4. Kuwamura S., Yamaguchi I., “Wavelength scanning profilometry for real-time surface shape measurement microscope,” Applied Optics 36, 4473–4482 (1997).
5. Kirk D., Hwu W., “Programming Massively Parallel Processors“, Elsevier, 2010.
6. NVIDIA,” NVIDIA CUDA Compute Unified Device Architecture: programming guide 2.0”, 2008, available on: [http://developer.download.nvidia.com/compute/cuda/2_0/docs/N VIDIA_CUDA_Programming_Guide_2.0.pdf].