The London School of Economics and Political Science
Trade in Raw Materials and
Economic Development
Jason Garred
A thesis submitted to the Department of Economics of the
London School of Economics for the degree of Doctor of Philosophy
Declaration
I certify that the thesis I have presented for examination for the PhD degree of the
London School of Economics and Political Science is solely my own work other than
where I have clearly indicated that it is the work of others (in which case the extent
of any work carried out jointly by me and any other person is clearly identified in
it).
The copyright of this thesis rests with the author. Quotation from it is permitted,
provided that full acknowledgement is made. This thesis may not be reproduced
without my prior written consent.
I warrant that this authorisation does not, to the best of my belief, infringe the
rights of any third party.
I declare that my thesis consists of 28856 words.
Statement of conjoint work
I confirm that Chapter 2 was jointly co-authored with Francisco JM Costa and Jo˜ao
Paulo Pessoa and I contributed a minimum of one-third of this work. I played a
major role in almost all aspects of the project, especially in developing our empirical
strategy and concording the various datasets we used. I also drafted the text.
I confirm that Chapter 3 was jointly co-authored with David Atkin, Dave
Don-aldson and Amit Khandelwal and I contributed a minimum of 90% of this work. I
collected background information, collected and cleaned data, developed the
Acknowledgments
This document is the product of the time and thoughtfulness of many people.
My advisors Robin Burgess, Daniel Sturm and Thomas Sampson made an
im-measurable contribution to this thesis through years of advice and support.
Emanuel Ornelas was there for me with his thoughts and encouragement at key
moments of my PhD.
Stephen Redding helped get me started on the long road to this point, and
provided much advice along the way.
Collaboration with my coauthors on these and other projects – David Atkin,
Francisco Costa, Dave Donaldson, Mirko Draca, Amit Khandelwal, Jo˜ao Pessoa and
Nele Warrinnier – was essential to my own progress as a researcher. This document
began to take shape only once I started working with Francisco.
My classmates, including Michael Best, Johannes Boehm, Esther Ann Bøler, Ben
Faber, R´eka Juh´asz, Sam Marden, Frank Pisch, Daniel Osorio Rodriguez, Claudia
Steinwender, Mohammad Vesal and many others, helped to pull me through the
PhD by allowing me to enjoy the good times and make it through the difficult ones.
The Bank of England, SSHRC and the LSE Asia Research Centre provided
invaluable funding, while Nansen Village and Hua and Matthew Ryan helped me to
stay in a comfortable home.
I owe thanks to Margaret Bray for bringing me to LSE, Ronny Razin for helping
me stay a little bit longer and Mark Wilbor for his help throughout the process.
Many others at LSE, especially in the trade and development groups, advised and
encouraged me over these several years.
Abstract
This thesis considers three cases in which trade in natural resources and other raw
materials can inform us about wider questions of economic development.
The first chapter, “Capturing the Value Chain: The Persistence of Trade Policy
in China After WTO Accession”, considers whether in the GATT/WTO era,
devel-oping countries are still able to actively conduct trade policy. In this study, I show
that after China’s entry into WTO, required import tariff reductions on downstream
sectors have been partly offset by an alternative policy with similar effects: export
restrictions on raw materials. I also find that larger rises in Chinese raw materials
export taxes after WTO accession have been associated with greater downstream
export growth.
The second chapter, “Winners and Losers from a Commodities-for-Manufactures
Trade Boom”, examines two contrasting outcomes of the ‘de-industrialization’
asso-ciated with rising trade between China and other developing countries. In particular,
this chapter compares changes in labour market outcomes in Brazilian regions
stim-ulated by rising demand from China for raw materials, with Brazilian regions whose
manufacturing sectors have been harmed by Chinese import competition. While
there was slower growth in manufacturing wages and greater rises in local wage
in-equality in ‘loser’ regions between 2000 and 2010, ‘winner’ regions experienced higher
wage growth, lower takeup of cash transfers and positive effects on job quality.
The third chapter,“Access to Raw Materials and Local Comparative Advantage:
The Effects of India’s Freight Equalization Policy”, considers the importance of
access to raw materials for industrial development. It does so by looking at the
effects of a Indian policy that aimed to remove regional comparative advantages
associated with proximity to raw materials, by equalizing prices of steel across India.
The results suggest that in practice, this policy may have had only a limited effect
Contents
1 Capturing the Value Chain: The Persistence of Trade Policy in
China After WTO Accession 11
1.1 Introduction . . . 11
1.2 Theoretical framework . . . 17
1.3 Background and data . . . 23
1.3.1 China’s WTO accession . . . 23
1.3.2 Export taxes in China . . . 24
1.4 Export taxes and import tariffs: protection through the back door? . 27 1.4.1 Export taxes, pre-WTO import tariffs and stage of production 27 1.4.2 Additional results . . . 35
1.4.3 Extent of substitution . . . 38
1.5 Export taxes and exports: capturing the value chain? . . . 40
1.5.1 Effects on exports as a share of sales . . . 40
1.5.2 Effects on exports . . . 41
1.6 Conclusion . . . 46
1.A Data appendix . . . 48
1.B Figures . . . 59
1.C Tables . . . 63
2 Winners and Losers from a Commodities-for-Manufactures Trade Boom 78 2.1 Introduction . . . 78
2.2 Data and empirical strategy . . . 82
2.2.1 Data sources . . . 82
2.2.2 Baseline specification . . . 84
2.3 Results . . . 92
2.3.1 Wages and wage inequality . . . 92
2.3.2 Migration and employment . . . 94
2.3.3 Job quality . . . 96
2.4 Conclusion . . . 97
2.A Figures . . . 99
2.B Tables . . . 103
3 Access to Raw Materials and Local Comparative Advantage: The Effects of India’s Freight Equalization Policy 115 3.1 Introduction . . . 115
3.2 Background . . . 117
3.3 Empirical analysis . . . 119
3.3.1 Iron and steel input prices . . . 119
3.3.2 Internal trade in iron and steel . . . 123
3.3.3 Output of steel-intensive industries . . . 126
3.4 Conclusion . . . 129
3.A Figures . . . 131
3.B Tables . . . 133
List of Figures
1.1 Standard deviation of China’s applied import tariffs and export tax
equivalents of China’s export VAT rebate policies and export duties
across nonagricultural products, 1997 to 2012 . . . 59
1.2 Mean of export tax equivalents of China’s export VAT rebate
poli-cies and export duties across nonagricultural products by stage of
production, 1997 to 2012 . . . 59
1.3 Mean and standard deviation of China’s applied import tariffs across
nonagricultural products, 1997 to 2012 . . . 60
1.4 Mean and standard deviation of export tax equivalents of China’s
export VAT rebate policies across nonagricultural products, 1994 to
2012 . . . 60
1.5 Mean and standard deviation of export tax equivalents of China’s
export VAT rebate policies and export duties across nonagricultural
products, 1997 to 2012 . . . 61
1.6 Scatter plots of 2002 and 2012 export tax equivalents of China’s VAT
rebate policies and export duties and 1999 applied tariffs by industry 61
1.7 Coefficients of annual industry-level regressions of export tax
equiva-lents of China’s export VAT rebate policies and export duties on 1999
applied tariffs, 1997 to 2012 . . . 62
1.8 Product-level coordination between export tax rises and changes in
other export policies, 2002 to 2012 . . . 62
2.1 Evolution of the share of agricultural and extractive sectors in the
exports and imports of non-high-income countries . . . 99
2.2 Evolution of the share of China in the imports and exports of
2.3 Evolution of the share of agricultural and extractive sectors in the
exports and imports of Brazil . . . 100
2.4 Distributions of import supply and export demand measures . . . 100
2.5 Import supply vs export demand measures . . . 101
2.6 Geographical distributions of top quintile of import supply and export
demand measures . . . 101
2.7 Raw measures vs instrumental variables measures . . . 102
3.1 Coefficients from regressions of unit values of steel plates, sheets and
strips on distance from nearest integrated steel mill, 1951 to 1958 . . 131
3.2 Share of Bihar and West Bengal in engineering and other
manufac-turing output, 1950 to 1970 . . . 132
3.3 Share of Bihar, Madhya Pradesh, Orissa and West Bengal in
List of Tables
1.1 Summary statistics of Chinese trade policies . . . 63
1.2 Export taxes and pre-WTO import tariffs by year . . . 64
1.3 Changes in export taxes and pre-WTO tariffs by instrument . . . 65
1.4 Large changes in export taxes and 1999 tariffs by stage of production 65 1.5 Changes in export taxes and pre-WTO tariffs by stage of production 66 1.6 Changes in export taxes and pre-WTO tariffs within stage of production 67 1.7 Changes in export taxes, stage of production and pre-WTO tariffs . . 67
1.8 Changes in raw materials export taxes and downstream pre-WTO tariffs . . . 68
1.9 Robustness to including share of Chinese exports in world trade . . . 69
1.10 Export taxes, import tariffs and non-tariff barriers to imports . . . . 70
1.11 Offsetting changes in effective rates of protection . . . 71
1.12 Export taxes and share of exports in total sales . . . 72
1.13 Export taxes and share of exports in total sales - long-difference IV regressions . . . 73
1.14 Export taxes and exports - panel regressions using HS descriptions . . 74
1.15 Export taxes and exports - robustness checks . . . 75
1.16 Export taxes and exports - long-difference IV regressions using HS descriptions . . . 76
1.17 Export taxes and exports - panel regressions using input-output table 77 2.1 List of sectors and additional summary statistics . . . 103
2.2 Brazilian microregion-level summary statistics 2000 . . . 105
2.3 Log average hourly wages . . . 106
2.4 Log average hourly wages by formality and occupation . . . 107
2.5 Inequality and social assistance . . . 108
2.7 Private sector employment . . . 110
2.8 Informality . . . 111
2.9 Formal private sector employment . . . 112
2.10 Informal private sector employment . . . 113
2.11 Occupational skill level . . . 114
3.1 Distances of states from nearest steel mills . . . 133
3.2 Unit values of inputs to engineering industry . . . 134
3.3 Unit values of inputs to engineering industry by specific product . . . 135
3.4 Distance elasticity of interstate iron and steel trade . . . 136
3.5 Distance elasticity of other products’ interstate trade . . . 137
3.6 Industries in output dataset . . . 138
Chapter 1
Capturing the Value Chain: The
Persistence of Trade Policy in
China After WTO Accession
[A] WTO deal – one which included surprising concessions on the Chi-nese side – was successfully brokered at the end of 1999. However, we note that there is a difference between signing a trade treaty and fully implementing its provisions. ... Our interviews of expatriate managers in China strongly indicate that these individuals believe tariff cuts will be at least partially undone by the simultaneous construction of more subtle non-tariff barriers....
– Branstetter and Feenstra (2002)
China’s industrial strategy is to leverage and exploit the differences in the international and domestic markets for raw materials and downstream, processed products, using restraints on exports as the linchpin.
– US government submission toChina - raw materials (WTO 2011)
1.1
Introduction
A striking stylized fact about the international economy of the last several decades
is the dramatic worldwide decline in the most widely observed instrument of trade
policy: the import tariff. Much of this decline has been credited to the GATT/WTO
process of multilateral trade negotiations, in which governments have committed to
the implementation of ever smaller tariffs. But does the demise of the import tariff
signal a retreat from activist trade policy among governments, or has trade policy
simply persisted in other forms instead?
Long-established results in international trade theory suggest that other policy
may be accomplished even with policies that only indirectly affect imports; for
in-stance, symmetries between the effects of export taxes and import tariffs in general
equilibrium have been known to economists at least since the work of Lerner (1936).
Yet while we have excellent data on import tariffs across products, countries and
time, there is little systematic information on countries’ usage of the other
instru-ments that could substitute for tariffs in the implementation of their trade and
industrial policies. This gap in the data leaves us unable to fully judge the extent
to which such policies remain an active feature of the global economy, or establish
the effectiveness of GATT/WTO negotiations in actually changing governments’
behaviour.
This issue is of particular relevance to developing countries, for whom the
in-struments of trade policy, especially import tariffs, have historically been important
tools of industrial strategy. While some observers have suggested that there is still
much scope for less developed countries to implement industrial policies in the
cur-rent multilateral system (e.g. Rodrik 2004), others have portrayed multilateral trade
agreements as overly restrictive in this respect (e.g. Chang 2002). Here, I consider
whether participation in WTO, and the accompanying restrictions on policy choice,
have served as an effective constraint on developing countries’ industrial strategies.
In particular, I study the persistence of trade policy in China – a developing
country with a well-known history of interventionist economic policy, and the most
important recent entrant into WTO – after its WTO accession. China’s 2001 entry
into WTO allowed it to benefit from improved access to foreign markets, including
permanent most-favoured-nation status in the United States. At the same time, in
order to secure the agreement of incumbent members to its WTO accession, China
was also required to agree to changes in its own policies. For example, like other
WTO members, China pledged as a condition of its accession to permanently keep
its import tariffs below agreed maximum levels. This required cuts to its pre-WTO
tariffs, and a resulting change in the pattern of protection across Chinese industries.
However, although these tariff cuts have been successfully completed, China has
recently been the subject of trade disputes involving several other policies, such
as domestic content requirements, preferential loans and discriminatory tax
treat-ment. The above quote from Branstetter and Feenstra (2002) raises the question of
whether such policies may have served to partly restore China’s pre-WTO pattern of
use various instruments to achieve the trade or industrial policy goals previously
accomplished with import tariffs. Here, I consider one particularly important class
of instruments for which comprehensive and readily quantifiable data on Chinese
policies is available: export taxes.
In particular, I construct panel data on the joint export tax equivalent of two
instruments – VAT rebates for exported products and export duties – for which,
like import tariffs, product-level policy schedules are published regularly in China.
As shown in Figure 1.1, which plots the standard deviation across products of both
import tariffs and these export tax equivalents over time, I find that compression
in China’s tariff schedule due to its WTO accession commitments has been followed
by a rise in variation in export taxes across products. Moreover, I document in the
empirical analysis below that these post-accession changes in China’s export taxes
are systematically related to its pre-WTO schedule of import tariffs, and thus to the
tariff cuts required by its WTO accession (which are highly correlated to China’s
pre-WTO tariff levels).
This relationship between China’s pre-WTO pattern of protection and its
post-accession export taxes may usefully be viewed through the lens of the value chain.
First, while the industries with the largest pre-WTO tariffs were producers of goods
relatively downstream in the value chain, China’s subsequent export tax rises have
been concentrated on raw materials (Figure 1.2). As I show below, a simple
two-country theoretical framework with two stages of production suggests that import
tariffs on downstream products and export taxes on raw materials may both serve to
protect domestic downstream sectors. By imposing export taxes on raw materials,
an exporter of these goods (such as China, which is a major producer of a wide
range of raw materials) can generate a wedge between their domestic and world
prices, supporting domestic downstream firms by providing them with an input cost
advantage. Indeed, the US and EU have twice taken China to the WTO’s dispute
settlement mechanism over its export restrictions on raw materials with the claim
that these are used to support downstream industries.
It is also the case that across raw materials industries, lower import tariffs before
China’s WTO entry are highly predictive of subsequent increases in export taxes. I
find that a raw materials sector with a one point lower tariff in 1999 was subject to
a 0.9 point larger increase in export taxes after China’s WTO accession on average.
input tariffs before WTO accession were subsequently supported via larger increases
in export taxes on inputs from the same industries.
I next consider whether export tax rises across raw materials industries are also
related to the pre-WTO tariffs of the downstream users of those raw materials.
Dividing raw materials into broad categories (such as metal, wood and plastic), I
calculate both the mean and the maximum of the 1999 tariffs of the downstream
in-dustries associated with each material. I find evidence that raw materials inin-dustries
with higher maximum pre-WTO downstream tariffs experienced larger increases in
export taxes, while the same is not true for industries with higher mean downstream
tariffs before China’s WTO entry. I interpret this as suggestive evidence that China’s
post-accession trade policy might be driven by the targeting of a relatively small
subset of strategic downstream industries.
Overall, the results imply that the changes in China’s export taxes are likely
to have partly restored China’s pre-WTO pattern of industrial protection. Using
the effective rate of protection (ERP) of an industry as a summary measure of
the protection afforded by trade policies incident on both an industry itself and its
inputs, I show that a one percentage point decline in ERP due to China’s tariff cuts
is associated on average with a 0.36 percentage point rise in ERP due to changes in
its export taxes at the industry level. Given the above evidence that trade policy
substitution in China may have been strategic in nature, and the fact that it has
probably encompassed a wider range of policy instruments than the two studied
here – some of which I also document below – the incomplete substitution from
import tariffs to export taxes implied by this back-of-the-envelope estimate seems
reasonable.
After establishing this relationship between China’s export taxes and its import
tariffs, I check whether China’s export taxes have been effective in actually changing
its industrial structure, using data on Chinese production and exports. I first find
that higher export taxes have been associated with diversion of sales to the domestic
market. In particular, in panel regressions with industry and year fixed effects, I
observe that export taxes are negatively and significantly associated with the share of
exports in an industry’s total sales. This result is robust to an IV strategy suggested
by the first part of the empirical analysis: rewriting the empirical specification in
long differences and instrumenting for China’s post-accession changes in export taxes
I then examine whether increases in export taxes on raw materials after China’s
WTO entry have been associated with rises in the exports of goods using these
materials. To do so, I exploit information on materials usage embodied in the
Har-monized System (HS) product classification to identify input-output relationships
at the product level, linking primary raw materials such as copper ore to processed
intermediates such as copper springs. I then apply this information to panel data on
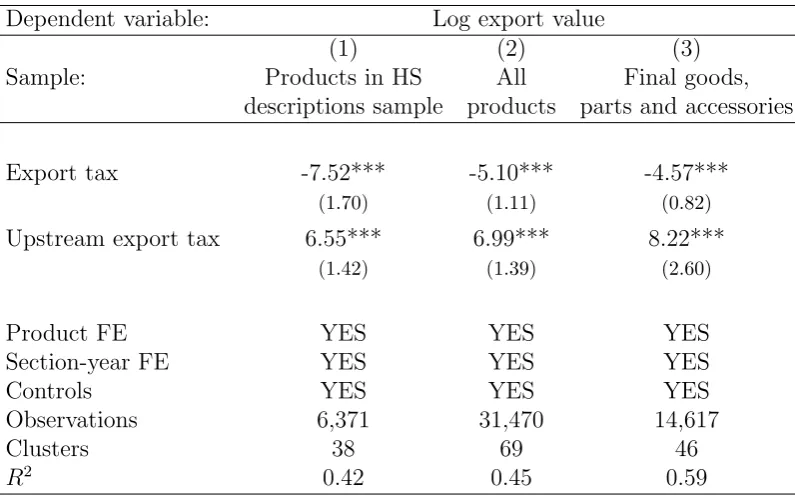
trade flows covering 2002 to 2012, and observe a positive and statistically significant
relationship between upstream export taxes and exports of products further
down-stream. This finding is also robust to the instrumental variables strategy outlined
above.
While this study is concerned with a single country and event, the issue of trade
policy substitution is relevant well beyond China’s WTO accession. As early as 1984,
Baldwin suggested in the first Handbook of International Economics that non-tariff
barriers “have been used more extensively by governments to attain the protectionist
goals formerly achieved with tariffs.” Since then, a handful of other empirical studies
have found evidence of substitution from import tariffs to other policies in developing
countries including India (Bown and Tovar 2011) and Turkey (Lim˜ao and Tovar
2011), as well as in the US (Ray and Marvel 1984) and across countries (Bown and
Crowley 2014).1 However, these studies all consider substitution between import tariffs and other import-side measures (such as anti-dumping duties); the study of
substitution between import-side and export-side policies in the same country is an
innovation of this study.2
In fact, although there is a long theoretical literature on symmetries between
import tariffs and export taxes, beginning with Lerner’s classic contribution in 1936,
very few papers have actually observed an empirical relationship between tariffs and
export taxes.3 This dearth of empirical papers on a long-studied theoretical topic is partly due to the fact that global data on export taxes is sparse. The construction of
detailed panel data on export taxes in China, allowing for comparisons with trends
1See Feinberg and Reynolds (2007), Vandenbussche and Zanardi (2010) and Moore and Zanardi
(2011) for other cross-country analyses. Anderson and Schmitt (2003) present a theoretical study of substitution between import-side policies.
2Some observers have drawn parallels between cuts in import tariffs in one country and the
negotiation of agreements requiring its trading partners to place quotas on exports (‘voluntary
export restraints’, or VERs). See Yu (2000) for a theoretical discussion.
3Golub and Finger (1979) observe a cross-country relationship of this kind, noting parallels
in import tariffs, is thus a contribution to this literature.4
The relationship between the trade policies studied here and the value chain also
situates this chapter in a literature linking growth in exports of manufactures to
advantageous access to raw materials. In particular, parallels with the case of the
United States around the turn of the twentieth century, as studied by Wright (1990)
and Irwin (2003), are notable. Wright finds that intensive exploitation of a wide
range of local resource endowments played an important role in US manufacturing
success during this period, while Irwin reaches similar conclusions in a more focused
study of the American iron and steel industry. According to Irwin, the rise in US
exports of iron and steel around 1900 was driven in part by the exploitation of a
large new deposit of iron ore, whose output was kept within the US due to high
transportation costs and vertical integration. Like the US at that time, present-day
China is a global leader in the production of many raw materials, but my analysis
suggests that privileged access to those inputs for Chinese manufacturers has been
generated, at least in part, by state-imposed restrictions on their export.
Finally, because of China’s size and the importance of its WTO accession to the
world economy, studies of the effects of China’s WTO entry such as this one are of
particular interest to scholars of both economic development and international trade.
Existing papers have focused mainly on the effects of tariff cuts on local outcomes
(e.g. Chen and Ravallion 2004, Brandt et al. 2012a), rather than their implications
for local policies. The apparent presence of policy substitution in China suggests
that these and other studies might underestimate the direct effects of China’s tariff
cuts if they do not take domestic policy responses into account.
The remainder of the chapter is laid out as follows. Section 1.2 outlines a
sim-ple theoretical framework. Section 1.3 provides background information on China’s
WTO accession, including its commitments regarding import tariffs, and discusses
the sources and summary statistics of the export tax data. Section 1.4 presents an
empirical analysis of the relationship between China’s export taxes and import
tar-iffs, while Section 1.5 examines whether export taxes on raw materials have actually
affected China’s export patterns. Section 1.6 then draws conclusions.
4Eisenbarth (2014) and Gourdon et al. (2014) also use data on Chinese VAT export rebates
1.2
Theoretical framework
In this section, I present a simple theoretical framework that will serve to elucidate
the key mechanisms by which import tariffs and export taxes can achieve similar
economic effects, and to motivate the empirical analysis below. As mentioned in the
introduction, the historical background to this model is the concept of symmetry
between import tariffs and export taxes originating from Lerner (1936). In its most
basic form, this states that in a two-country, two-product framework in which each
country has an import and an export good, a government may achieve identical
changes in resource allocation and real income by imposing either a tariff on imports
or a tax on exports.5 However, the empirical relevance of this insight has been cast in doubt by the large number of goods actually traded and their complex
input-output relationships (about which the available information is relatively coarse),
leading Grossman and Horn (2013) to suggest that it is “not a practical possibility
to compute a system of export taxes that would come anywhere near having the
same effects” as a given set of import tariffs.
I therefore explore a more limited concept of symmetry between a few simple
‘rule-of-thumb’ policies in the presence of a two-stage value chain, highlighting two
types of policies – downstream tariffs and upstream export taxes – that I will later
show are broadly representative of China’s pre- and post-accession trade policy
regimes. I posit a two-country economy with two industries, in which both countries
produce in both industries, and limit the symmetric outcome of interest to the
‘pattern of protection’, defined here as the pattern of employment of domestic factors
across industries relative to the free trade equilibrium. I then evaluate the real
income implications of the policies achieving identical patterns of protection, in
order to draw conclusions about policy choice.
Consider a world with two countries, home (H) and foreign (F), hereafter
in-dexed byc. There are also two industries, upstream (U) and downstream (D). Each
country produces one distinct product in each of the two industries (an Armington
(1969)-type framework). A key assumption of the model will be that these goods
are imperfectly substitutable in production (for upstream goods) and consumption
(for downstream goods). Many firms in each country are assumed to produce in
each industry under conditions of perfect competition. Each country also has an
5See McKinnon (1966) for an extension of Lerner symmetry to an economy with intermediate
endowment L of a single factor (labour) that is mobile across industries but not
countries, and is inelastically supplied to firms. Trade in goods between the two
countries is assumed to be costless in the absence of trade policy.
For simplicity, I will assume that production of upstream goods requires only
labour l and that there are constant returns to scale, so that quantity produced for
a given firm in either country c is qc
U = zUlcU. However, production of downstream goods requires a Cobb-Douglas combination of labour and the two upstream goods
mH
U and mFU, with elasticity of substitution across upstream inputs ofσU >1:6
qcD =zD
(mHcU )σU
−1
σU + (mF c
U )
σU−1
σU
σUσU−1β
(lDc)1−β
Finally, the two downstream goods are consumed by labourers in each country
ac-cording to constant elasticity of substitution (CES) preferences with elasticity of
substitution σD >1:
Uc=(xHcD )σD
−1
σD + (xF c
D )
σD−1
σD
σDσD−1
Given the model’s symmetry assumptions, the allocation of labour across
in-dustries is identical in H and F in the free trade equilibrium: a share 1 − β
of each country’s labour force is employed in production of downstream goods,
LH
D = LFD = (1 − β)L. Moreover, because of the imperfect substitutability of products at each stage of the value chain, the two countries engage in bilateral trade
of both upstream and downstream goods.
Now consider the implications for domestic industrial structure of the imposition
by H of a unilateral trade policy, by characterizing the change in the allocation of
labour in H relative to the free trade equilibrium. First, imagine that starting from
free trade, H adopts either a small ad valorem import tariff tD ≡ τD −1 > 0 on
imports of downstream goods produced by F, or a similar tariff tU ≡ τU −1 > 0
on imports of upstream products. Also assume that all tariff revenue is returned to
consumers in H as a lump sum. Then either of these policies result in movement of
6This assumption about the relationship between the two countries’ upstream products in the
labour in H into the sector on which tariffs are imposed, i.e:
dLHD dτD
>0, dL H D dτU
<0
However, this shift in industrial structure occurs via different mechanisms in each
case. To see this, define the expenditure share of the product of country c in stage
k on that industry by country c0 as scc0
k . Then the familiar direct effect of either import tariff is to increase sHHk at the expense of sF Hk . In the case of a downstream
tariff:
sHHD = w
(1−β)(1−σD)
w(1−β)(1−σD)+τ1−σD
D
which increases in τD, where w is the relative wage wH/wF. The increase in
do-mestic demand for H downstream goods then leads to a rise in w, reducing the
competitiveness of both of the goods produced by H in both markets because of
higher input costs. The net effect is to shift labour into the downstream industry in
H and out of the downstream sector in F by the same amount, i.e. to generate a
‘relocation effect’ on industrial location:
dLHD = 1 4
β(1−β)σUσDL
βσU + (1−β)2(σD −1) + (1−β)
dτD >0
dLFD =−dLH D <0
Now instead consider a tariff imposed by H on imports of upstream goods. Like
the downstream tariff, such a tax has a direct effect on the competitiveness of the
goods that are taxed, in this case reducing the market share inF of upstream goods
produced by H. However, imposition of τU affects relative input costs in the two
countries not only via changes in relative wages, but also by generating a wedge
between the local price indices of upstream inputs in the two markets:
PH U PF U =
w1−σU +τ1−σU
U w1−σU + 1
1−1σU
>1
This input price disadvantage for downstream firms in H serves to depress the
relative competitiveness of their output at home and abroad, since:
sHHD =sHFD = w
(1−β)(1−σD)
w(1−β)(1−σD)+
PH
U
PF U
which decreases in PUH/PUF.
Together, the direct encouragement of the upstream industry inHvia protection
from import competition and the indirect discouragement of its downstream industry
through changes in relative input prices again lead to a shift in industrial structure
relative to free trade:
dLHD =
1
4β(1−β)L− 1 4
β(1−β)σUσDL
βσU + (1−β)2(σD−1) + (1−β)
dτU <0
dLFD =−dLHD +1
2β(1−β)LdτU >0
However, trade policy no longer generates a simple ‘relocation effect’, since now
dLHD +dLFD > 0. This is because an upstream import tariff induces substitution
away from higher-cost CES bundles of raw materials and towards labour among
downstream firms in H, distorting the global allocation of labour across industries.
In contrast, a downstream import tariff taxes the final stage of production, which
embodies the output of both stages of the value chain, thus avoiding such an
inter-stage reallocation.
Next consider analogously defined ad valorem taxes νD and νU on exports of
downstream and upstream goods produced byH respectively, again assuming
lump-sum redistribution of government revenue to conlump-sumers. Starting from the free trade
equilibrium, either of these taxes may be shown to induce movement of labour inH
into the untaxed sector, i.e.:
dLHD dνD
<0, dL H D dνU
>0
A downstream export tax decreases foreign demand for H downstream goods,
leading to a fall in w, which increases the competitiveness of both goods produced
byH in each country. This results in the opposite ‘relocation effect’ to that caused
by a downstream import tariff:
dLHD =−1 4
β(1−β)σUσDL
βσU + (1−β)2(σD−1) + (1−β)
dνD <0
dLFD =−dLH D >0
An upstream export tax, however, also increases the relative price of upstream
i.e. PUH/PUF <1. This not only stimulates production of H downstream goods, but
as with an upstream import tariff, also leads to a distortion in the global allocation
of labour across industries:
dLHD =
1 4
β(1−β)σUσDL
βσU + (1−β)2(σD−1) + (1−β) + 1
4β(1−β)L
dνU >0
dLFD =−dLHD + 1
2β(1−β)LdνU <0
where again dLH
D +dLFD >0.
Thus, in this simple two-industry framework, labour is shifted into the
down-stream industry by a higher import tariff on D or lower import tariff on U, but by
a lower export tax on D or higher export tax on U. In other words, the import
tariffs and export taxes that generate the same patterns of protection are imposed
on different industries. Moreover, either a higher export tax or lower import
tar-iff on the upstream industry may increase the input price advantage (or decrease
the disadvantage) of the downstream industry using those inputs. Both of these
predictions of the model will be relevant to the empirical analysis below.
An additional result of the model is also notable: a downstream import tariff
achieving the same shift of labour into the downstream sector as an upstream export
tax does so at a lower cost (i.e. larger benefit) to aggregate domestic real income.7 If governments prioritize the protection of downstream industries (as suggested by
the ubiquity of tariff schedules affording greater protection to downstream sectors)
but take account of real income when choosing the instrument by which this is
accomplished, this result provides a possible reason for the popularity of import
tariffs as compared to export taxes in practice.8
The proportional effect of a downstream tariff on real income inH is determined
by the gain in nominal incomeYH (via wage growth and government revenue), offset
by the rise in the consumer price index in H, PDH (due to tariffs on F goods and
7The downstream export subsidy or upstream import subsidy achieving the same allocation of
labour also do so at a higher cost to real income relative to a downstream import tariff. This is a less surprising result, given the well-known negative effects of trade subsidies on domestic terms of trade.
8See Balassa (1965) and Cadot et al. (2004) for empirical evidence on ‘tariff escalation’ covering
higher nominal labour costs for firms in H), relative to free trade:
dYH YH −
dPDH PH
D =
dw+1 2dτD
−
1 2dτD+
1 2dw = dL H D βσUL
>0
Thus, for the tariff that leads to dLH
D =kL, the associated change in real income in H is k/(βσU)>0.
However, the implications of an export tax achieving dLH
D =kLon real income in H are as follows:
dYH YH −
dPH D PH D =
dw+ 1 2βdνU
−
1 2dw+
1 4βdνU
= k βσU + 1 2β−
1 4
dνU
| {z }
revenue
−1 4
1−β
σU
dνU
| {z }
distortion
−1 4βdνU
| {z }
pass−through
= k
βσU − 1
4(1−β)
σU + 1 σU
dνU
Given that dνU > 0, this is an unambiguously smaller gain in real income than in
the case of a downstream import tariff. The difference between the two gains is due
to three separate effects, highlighted in the equations above.
The first effect, of ambiguous sign, results from the fact that government revenue
from the two instruments depends on the share of value added in the free-trade
economy accruing from the upstream stage. If the two stages are of equal importance
to gross domestic product under free trade – i.e. if β = 12 – then the revenue implications of a tax on either sector are identical.
The second effect, which is negative, derives from the aforementioned distortion
to the world allocation of labour across stages induced by an upstream export tax
but not a downstream import tariff, which reduces real income in both countries.
This effect decreases in σU because this distortion has a smaller impact on real
income if the raw materials from F are more substitutable for those in H, since
downstream firms in F can more readily replace higher-cost raw materials from H
with local raw materials rather than hiring more labour.
The final effect, also negative, is due to the fact that part of the price increase
re-sulting from the export tax is paid for by consumers inH via imports of downstream
goods from F. To better understand this pass-through effect, imagine instead an
and identical production functions linear in labour. In such a model, the effects on
sectoral distribution and real income of an import tariff on one sector and an export
tax on the other are identical. This is in part because the implications of each of
the policy instruments for government revenue and production choices are the same.
But it is also because of the key insight of Lerner’s (1936) original symmetry result:
that an import tariff, which raises both relative nominal wages and local prices, and
an export tax, which depresses relative nominal wages and causes price increases
abroad, result in the same shift in a country’s terms of trade. In the two-stage
model here, this symmetry does not hold because the price increases resulting from
an export tax instead accrue partly in H itself.
1.3
Background and data
In this section, I first provide background information on China’s accession to WTO
and the resulting cuts in its import tariffs. I then introduce my data on Chinese
export taxes and outline the recent history of the two policies from which I construct
this dataset.
1.3.1
China’s WTO accession
After finalizing WTO accession agreements with the United States in 1999 and the
European Union in 2000, China entered WTO in December 2001. China already
held most-favoured-nation (MFN) status in each of its main trading partners at
the time of its entry into WTO, so the schedule of import tariffs that it faced in
these countries did not change after its WTO membership. However, China gained
market access abroad through a decline in trade policy uncertainty: perhaps most
importantly, China’s MFN status in the US was subject to annual renewal before
2001, but was made permanent upon China’s accession to WTO.9
As a WTO member, China became bound both by WTO rules and by additional
specific commitments made as conditions of its accession. Like other countries
join-ing WTO, one of China’s key commitments was to permanently set its import tariffs
at or below levels agreed in international negotiations. For almost all products, this
9Handley and Lim˜ao (2013) and Pierce and Schott (2013) find that uncertainty related to the
bound tariff rate was equal to or smaller than China’s applied tariff in 1999, the year
in which agreement on tariffs on industrial products was reached, and so tariff cuts
were required in order to meet this condition.10 The schedule for implementation of China’s bound tariffs extended to 2010, with most tariffs to be reduced to their
bound rates by 2005.
In practice, China’s nonagricultural applied tariffs were indeed reduced to their
bound levels after its WTO accession. As a consequence, China’s mean applied
tariff across nonagricultural products decreased from 16% in 1999 to 9% in 2012, as
shown in Figure 1.3.11 Importantly, because negotiated tariff cuts were highly corre-lated to initial tariff levels (with a correlation coefficient of approximately 0.8 across
nonagricultural products), these cuts led to a compression of China’s tariff schedule.
Figure 1.3 accordingly shows that the standard deviation of China’s applied tariffs
across products declined along with the mean. A key question to be explored in
the empirical analysis below is whether the resulting decrease in the variation in
protection across Chinese industries was offset by changes in other policies.
1.3.2
Export taxes in China
In order to examine whether China’s post-accession export policies are
systemati-cally related to its pre-WTO pattern of import tariffs, I have gathered detailed panel
data on two policies that may readily be combined into a single export tax
equiva-lent: value-added tax (VAT) rebates for exporters and export duties. As noted by
Feldstein and Krugman (1990), in an international system where countries charge
VAT on imports (as do China and other countries with value-added taxes), the
nondistortionary policy is for countries to also fully rebate VAT on exports, so that
the effective VAT rates charged on domestically produced and imported goods are
equalized within each country. This means that incomplete rebates of VAT
consti-tute a tax on exports. However, in China, the official VAT rebate rates for Chinese
exporters, which are set at the product level, are often lower than the rate of VAT
10Throughout the chapter, I restrict the analysis to nonagricultural products (or industries),
and also omit important agricultural inputs (fertilizers and pesticides); see the data appendix for details. This is because liberalization of trade in agricultural products, where nontariff barriers tend to be particularly important, often involved replacement of nontariff barriers with tariff-based protection during this period rather than tariff cuts (Branstetter and Lardy 2008).
11Note that in a small number of cases, China’s pre-accession applied tariffs were already lower
charged (which is either 13% or 17% for most goods).
I therefore gather data on VAT rates and rebate rates at the product level and use
this data to calculate export tax equivalents of China’s export VAT rebate policies
for each product and year (see the data appendix for details). The data is taken
from policy updates that are periodically disseminated to firms in electronic format
from official sources and used to calculate and apply for tax rebates. The set of these
updates starting from 2004 is available from the web site www.taxrefund.com.cn,
and data for 2003 may be found at www.cnnsr.com. To this I add product-level data
for 2002 from the 2001-2002 Export Commodity Code and Tax Rebate Rate Quick Reference Handbook (State Administration of Taxation 2002). Finally, I extrapolate the 2002 product-level data back to 1994 using more aggregate summaries of
pre-2002 changes in rebate policies from the China Master Tax Guide published by Deloitte Touche Tomatsu (2005).12
As shown in Figure 1.4, which charts the mean and standard deviation of these
export tax equivalents between 1994 and 2012, there have been many changes to
China’s export rebate policies over this period. When VAT was put at the center of
China’s taxation system in 1994, a policy of full export VAT rebates for most
nona-gricultural goods was maintained. However, the widespread practice of claiming
rebates for goods that were not actually exported resulted in excessive fiscal
obliga-tions for the central government, and official rebate rates were significantly reduced
soon afterwards (Branstetter and Lardy 2008). This led to a steep rise in the
aver-age export tax equivalent of rebate policies, but because this cut in rebates applied
across the board, variation across products in export taxes did not rise accordingly.
Rebate rates were raised again in the late 1990s in response to the negative export
demand shock associated with the Asian financial crisis, and China’s export VAT
rebate policy was then relatively stable until 2003.
However, an official notice in October 2003, less than two years after China’s
WTO accession, announced a significant reform of rebate rates to be effective in
January 2004.13 This was the first in a series of notices frequently amending China’s export rebate rates over the following several years. Figure 1.4 shows that these
pol-icy changes often increased the average export tax equivalent of VAT rebate policies,
but sometimes instead served to support exports through decreases in mean export
12Summary statistics of export tax equivalents of these policies for 2002 and 2012 (the two years
of data used in much of the empirical analysis below) are displayed in Panel B of Table 1.1.
taxes (especially at the time of the late-2000s global recession). However, unlike
the pre-WTO policy changes, the 2003 notice and subsequent reforms consistently
increased the variation in export taxes across products.
In addition to charging export taxes via incomplete rebates of VAT to exporters,
China also directly imposes duties on some exported products. The lists of goods
subject to export duties and the corresponding rates are published by China annually
together with its schedule of import tariffs in the Customs Import and Export Tariff of the People’s Republic of China. I have collected product-level data on export duties from this publication for the years 1997 to 2012 and calculated the joint
export tax equivalent of export duties and VAT export rebate policies for each
product and year (see the data appendix for details).
While neither export duties nor incomplete VAT rebates for exporters are
prohib-ited under WTO rules, China’s WTO accession agreement allows for export duties
only on a small group of products, ruling out such duties on other goods “except
under exceptional circumstances” (WTO 2001). Until 2004, China’s schedule of
ex-port duties only included a subset of the goods identified in its accession agreement.
However, starting in 2005, China began imposing ‘temporary’ export duties on some
other products. These export duties still affect a relatively narrow range of goods
(approximately 5% of nonagricultural six-digit products in 2012), but have become
increasingly coordinated with China’s VAT export rebate policies. Thus, although
they have been quite sparingly applied, Figure 1.5 shows that rising export duties
have made an important additional contribution to the increasing variation in
ex-port taxes across products since China’s WTO accession. Inclusive of both policies,
the standard deviation across nonagricultural goods of China’s export taxes rose
from 3.3% to 9.3% between 2002 and 2012, as shown in Panel B of Table 1.1.
Since its accession to WTO, a number of China’s policies have been the subject
of disputes addressed through the WTO’s dispute settlement mechanism; China has
been the respondent in 19 separate cases brought by other WTO members. Two of
these disputes have involved its export duties, along with a set of quantitative export
restrictions (to be discussed in Section 1.4.2) that are prohibited under WTO rules:
poli-cies identified by the complainants were inconsistent with China’s WTO accession
commitments.14 In response to the ruling in the first case, China altered some of its export policies, including some export duties, in 2013. The empirical analysis below
will cover the period before these changes, i.e. until 2012. However, because these
changes left most export duties untouched and did not affect China’s VAT policies,
the empirical results below change very little when the sample period is extended.
1.4
Export taxes and import tariffs: protection
through the back door?
In this section, I examine the link between China’s export taxes and its import
tariffs, with the goal of determining whether the changes in Chinese export taxes
since its WTO accession tend to reproduce its pre-WTO pattern of protection. I first
study the link between export taxes and pre-WTO import tariffs across industries,
considering in particular how the relationship between the two policies interacts with
industries’ stage of production. I then check whether products subject to export
taxes are actually exported by China, consider whether my results may instead be
explained by export taxes’ likely effects on China’s terms of trade, and take other
import and export policies into consideration in the analysis. Finally, I summarize
the extent to which the changes in China’s export taxes have offset the effects of
the tariff cuts associated with its WTO accession.
1.4.1
Export taxes, pre-WTO import tariffs and stage of
production
I begin by considering whether the changes in China’s export taxes after WTO
accession are systematically related to its pre-WTO pattern of industrial protection,
as defined by its schedule of import tariffs in 1999. I use China’s 1999 tariffs because
this was the final tariff schedule released by China before agreement was reached on
the nonagricultural tariff cuts required for its WTO accession; however, the results
below are robust to using other pre-WTO base years. Because there is a high
14China had argued that its policies were covered by Article XX of the General Agreement on
correlation between China’s 1999 tariffs and its subsequent tariff reductions, the
results are similar when tariff cuts are substituted for pre-WTO tariff levels in the
analysis. I will directly consider the extent to which China’s export tax rises have
offset its tariff cuts in Section 1.4.3. Export taxes are defined below as the joint
export tax equivalent of both China’s VAT export rebate policies and its export
duties unless stated otherwise.
I conduct the analysis in this section at the industry level, defining industries
at the four-digit level according to the Chinese industrial classification.15 This level of aggregation allows me to capture the concept from my theoretical framework
of industries encompassing both import and export products, while maintaining a
reasonably large sample size of 402 nonagricultural industries. The average
four-digit industry consists of approximately nine six-four-digit products, and the majority
of these industries include both products for which China was a net importer and
goods for which China was a net exporter in 2002 (the first full year after its entry
after WTO). The results in this section also hold when the unit of analysis is defined
at higher or lower levels of aggregation.
Some of the key changes over time in the relationship between China’s export
taxes and its pre-WTO import tariffs may be seen in the two scatter plots in Figure
1.6. In this figure, the position of each point represents the simple average across
products of an industry’s import tariffs in 1999 relative to the simple average of
its export taxes in 2002 (in the left-hand panel) or 2012 (in the right-hand panel).
Meanwhile, the colour of each point represents the position of the industry in a
simple two-stage value chain. For this, I use the United Nations Broad Economic
Categories (BEC) classification of traded products to identify HS products that
are either final goods, parts or accessories, and define the remainder of goods as
raw materials (see the data appendix for details). If more than half of a four-digit
industry’s products are raw materials, I classify it as a raw materials industry. As
a result, 174 of the 402 industries in the sample (43%) are categorized as producers
of raw materials, while all others are defined as downstream industries.
The figure shows that while raw materials industries had generally lower tariffs
in 1999, export taxes rose by much more for raw materials than for downstream
industries on average between 2002 and 2012. Moreover, export taxes increased
15An example of a four-digit industry is ‘Manufacture of glass apparatus’, which lies within the
most for the raw materials industries for which average pre-WTO import tariffs
were lowest. The overall result is a striking negative relationship across industries
between 2012 export taxes and pre-WTO tariffs, with very few industries subject to
both large 1999 tariffs and large 2012 export taxes.16 Importantly, these patterns are not driven by the concentration of large 2012 taxes and/or 1999 tariffs in a
narrow range of industrial categories: the top quartile of 1999 import tariffs spans
21 of 35 two-digit industries, while 20 of 35 two-digit industries include at least one
of the four-digit industries in the top quartile of 2012 export taxes.
Before considering the interaction between export taxes, import tariffs and stage
of production in more depth, I first note two additional facts that are not apparent
from Figure 1.6. First, although Figure 1.6 portrays a large change in the
relation-ship between China’s export taxes and its pre-WTO tariffs between two points in
time, the transition between these two states took shape gradually over several years.
To show this, I summarize the relationship between 1999 tariffs and export taxes in
each year t between 1997 and 2012 using a series of simple regression specifications:
exporttaxti =αt+βttariffi1999+ti (1.1)
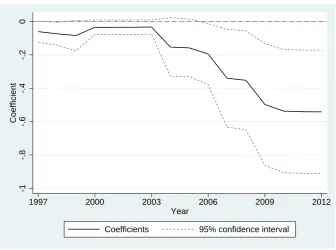
I then plot the estimated coefficients ˆβt from this series of regressions in Figure 1.7;
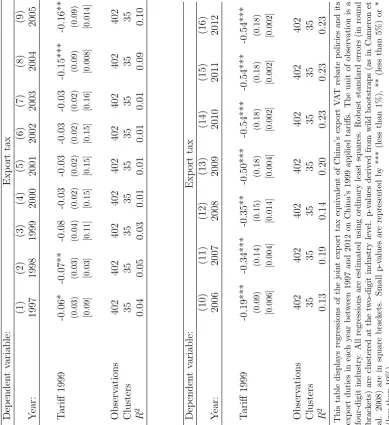
the full set of results may be found in Table 1.2. The figure shows that the
rela-tionship between export taxes and 1999 tariffs became progressively more negative
in each year between 2003 and 2010, while both before and after this period, ˆβt
remained relatively stable.
I next use a similar summary measure of the link between export taxes and 1999
tariffs to show that their relationship is the result of both of the two policies studied
here. I first define ∆exporttaxi ≡ exporttax2012i −exporttax2002i and regress this long-difference variable on the same right-hand side as above. As shown in column
(1) of Table 1.3, I find that a one percentage point larger 1999 tariff is associated
with a one-half point smaller export tax rise from 2002 to 2012. I then run two
additional regressions redefining the left-hand-side variable of equation (1.1) as the
change (again between 2002 and 2012) in the export tax equivalent of one of the two
16Of the 100 industries in the top 25% of each of these two distributions, only three are shared
policies only, holding the export tax due to the other policy equal to zero. These
specifications show that a one point higher tariff in 1999 is associated with a 0.3
point lower rise in the export tax equivalent of China’s VAT rebate policies (column
(2)), and a 0.14 point smaller increase in export duties (column (3)) from 2002 to
2012. Both of these estimates are statistically significant at the 1% level, using
p-values derived from wild bootstraps as in Cameron et al. (2008) due to the small
number of clusters (two-digit industries).17
To consider more carefully the role of the value chain in the relationship
be-tween pre-WTO import tariffs and post-accession export tax changes, I again use
the UN BEC classification to create a further division of the downstream part of
the value chain into producers of capital goods and other downstream industries.
While both of these types of downstream industries produce parts, accessories and
finished goods, capital goods industries sit uneasily into a simple vertical definition
of the value chain because of the role of capital in the production process. Moreover,
because imported capital often embodies important technological inputs into
pro-duction, industries producing capital goods are rarely protected with high import
tariffs, which means that 1999 tariffs may not be a good proxy for Chinese support
to these industries. I similarly divide upstream industries into sectors producing
primary raw materials (e.g. mining of iron ore) and semiprocessed raw materials
sectors (e.g. production of steel).
Tables 1.4 and 1.5 display how pre-WTO tariffs and post-accession export tax
rises vary across these four categories. Table 1.4 shows that of the 37 primary raw
materials industries, 33 were subject to export tax increases in the top quartile
between 2002 and 2012, while none of the industries at this stage of production fell
into the top 25% of 1999 tariffs. Meanwhile, 54 of the 90 downstream industries not
producing capital goods were in the top quartile of 1999 tariffs, while only two of
these 90 sectors were in the top 25% of post-accession export tax increases. Overall,
96 of the 101 industries in the top 25% of export tax rises were producers of either
primary or semiprocessed raw materials, while of the top 25% of industries by 1999
tariffs, 68 of 100 were producers of downstream goods.
Table 1.5 displays the results of regressions of 1999 tariffs and changes in
ex-port taxes from 2002 to 2012 on indicators for whether an industry is a producer of
17The estimated coefficient in column (1) is larger than the total of these two estimates because
primary raw materials, semiprocessed raw materials, or capital goods; the omitted
category is other downstream industries. Column (1) shows that on average, China’s
1999 applied tariffs were 8 percentage points lower on semiprocessed raw materials
industries and 19 percentage points lower on primary industries as compared to
tar-iffs on industries producing final consumption goods. Export tax rises, on the other
hand, vary in the opposite way with the value chain: these were 7 points higher
for the semiprocessed stage and 22 points higher for the primary stage on average
as compared to industries producing products for final consumption. Notably, this
inverse relationship between the two policies is not present for capital goods
indus-tries. While capital goods industries have relatively lower pre-WTO import tariffs
than those of sectors producing final consumption goods, export taxes on this subset
of industries remained relatively low after 2002. As discussed above, this may be
because capital-producing industries were protected via other means before China’s
WTO accession, so that pre-WTO import tariffs may not fully represent the position
of these sectors in China’s pattern of industrial protection.
Having established that pre-WTO import tariffs and post-accession export taxes
differ across stages of production in a way that is broadly in line with two of the
simple policies considered in my theoretical framework, I now step outside that
framework to consider variation in incidence across industries within stages of
pro-duction. This variation is much higher for raw materials: while among downstream
industries the average increase in export taxes from 2002 to 2012 is 1.5% with a
standard deviation of 2.7%, the corresponding mean and standard deviation across
raw materials industries is 12.0% and 11.1% respectively. The scatter graph above
(Figure 1.6) suggests that much of the variation across industries in raw materials
export taxes may be explained by average pre-WTO tariffs on the same industries;
I first check this hypothesis, and then discuss its implications.
To do this, I run a regression of changes in China’s export taxes after WTO
accession on its 1999 tariffs, but restricted to raw materials industries only:
∆exporttaxi =α+βtariffi1999+i (1.2)
The results may be found in column (1) of Table 1.6. This shows that a raw materials
industry with a one point lower tariff in 1999 was subject to a 0.9 point larger
simple specification has substantial explanatory power for export tax rises on raw
materials industries, with an R2 of nearly 0.5. In columns (2) and (3), I check that this result is not simply driven by variation across the early stages of the value chain,
by re-estimating specification (1.2) separately for primary and semiprocessed raw
materials industries. I find that the negative and statistically significant relationship
in column (1) also holds within each of these two sets of industries, and again explains
much of the variation in export tax increases in each case.
Given that I have defined industries so that they tend to encompass both import
and export products, this finding has implications both for the pattern of protection
across raw materials industries themselves and for the protection afforded to
down-stream sectors. The direct effect is that raw materials industries whose products
were less protected from import competition by tariffs before WTO were then
sub-ject to higher taxes on exported goods after accession. However, also recall from the
theoretical framework that downstream industries may be supported indirectly via
lower upstream import tariffs or higher upstream export taxes, either of which may
affect the gap between the domestic and world prices of raw materials. The results in
Table 1.6 thus imply that the same downstream industries receiving greater
protec-tion through lower import tariffs on raw materials inputs in 1999 were subsequently
supported through larger increases in export taxes on inputs from the same
indus-tries, after the distribution of tariffs across raw materials sectors was compressed by
WTO accession.18
To what extent do the two main findings of the analysis so far – that China’s
export taxes have risen for upstream industries in general, and have increased by
more in upstream sectors with initially lower tariffs – explain the distribution of
export tax increases across industries? These two results may be summarized by
estimating a single specification on the full sample of nonagricultural industries,
including both of the two main explanatory variables discussed above – pre-WTO
tariffs and a dummy for raw materials industries – along with an interaction term:
∆exporttaxi =α+βrawmaterialsi+γtariffi1999+θ(rawmaterialsi∗tariffi1999)+i (1.3)
Table 1.7 shows that this parsimonious specification explains 62% of the variation
18While the mean of China’s 1999 tariffs on raw materials industries was 12.1% and their standard
in the post-WTO changes in export taxes across industries, measured according to
R2. I will use this preferred specification as the baseline for the robustness checks of Section 1.4.2.
Notably, the estimated ˆβ displayed in the first row of Table 1.7 suggests that
there is no relationship between export tax rises and pre-WTO tariffs across down-stream industries. This is confirmed in columns (4) and (5) of Table 1.6, which show the results of running specification (1.2) separately for capital goods industries and
other downstream industries. In both cases, the result is a precisely estimated zero.
In other words, it is not the case that export taxes have emerged on downstream
industries on which China set relatively low import tariffs before its WTO entry.
Instead, to the extent that China’s pre-WTO pattern of protection across
down-stream industries has been restored by the export taxes observed here, this is due to
policies directly incident on raw materials, but with indirect effects on downstream
sectors.
The role of indirect effects on downstream sectors in shaping post-accession
changes in China’s export taxes is further explored in Table 1.8. Here, I consider
whether variation in raw materials export tax rises may be explained by the
pre-WTO tariffs of the downstream industries using those inputs, controlling for the
1999 tariff on the raw materials industry itself. In particular, I run the following
regression for the set of raw materials industries:
∆exporttaxi =α+βtariffi1999 +β
Dtariffdownstream,1999
i +i (1.4)
A challenge in estimating this specification is to calculate downstream pre-WTO
import tariffs for each raw materials industry. Although China publishes an
input-output table, its sectors are relatively coarse and often aggregate raw materials
and downstream industries into a single category (e.g. paper pulp, paper and paper
products; rubber and rubber products). I thus define eight main types of materials
(chemicals; leather and furs; metal; nonmetallic minerals; plastic; rubber; textiles;
wood and paper) and identify the raw materials sectors corresponding to these
materials in China’s 2002 input-output table, whether or not these sectors also
include downstream industries.19 I then associate each of the remaining input-output
19I exclude raw materials industries producing fuels from this analysis, since the procedure used
sectors with a particular material according to the maximum of the input shares of
each of these raw materials categories in the production of that sector’s goods.
Finally, I assign four-digit industries to materials using a concordance of industries
and input-output sectors. For instance, this procedure associates rail transportation
equipment with metal; all four-digit industries constituting the input-output sector
‘Rail transportation equipment’ are then defined as downstream of all of the raw
materials industries producing metals.20
In Table 1.8, I estimate specification (1.4), measuring downstream tariffs
alterna-tively according to their mean or their maximum across the downstream industries
associated with a particular material. I consider the maximum tariff because of the
possibility that China’s trade policy is driven by the strategic targeting of a small
subset of downstream industries rather than a more general preference for
produc-tion in a wide range of favoured industries, as suggested by the right-skewed nature
of China’s pre-WTO tariffs (see Figure 1.6). Column (1) of Table 1.8 shows that
surprisingly, a higher mean downstream tariff in 1999 is associated with a smaller increase in upstream export taxes between 2002 and 2012. However, this result is
driven entirely by the inclusion of capital goods industries, since the estimated
coef-ficient switches sign and loses statistical significance when mean downstream tariffs
are calculated using other downstream industries only (column (2)).
On the other hand, column (3) suggests that raw materials industries with higher
maximum pre-WTO downstream tariffs subsequently experienced larger rises in
ex-port taxes. As shown in column (4), this result is robust to the exclusion of capital
goods industries in the calculation of maximum downstream tariffs. While these
findings should be treated with some caution due to the coarseness of the
input-output measure I have used, they indicate that China’s post-accession export taxes
on raw materials may have been influenced by a relatively narrow group of strategic
downstream industries.
20See data appendix for details. I define more detailed data on input-output linkages in Section
1.4.2
Additional results
Relevance of export taxes
Even if ex