2016 6th International Conference on Information Technology for Manufacturing Systems (ITMS 2016) ISBN: 978-1-60595-353-3
1 INTRODUCTION
As explosive growth in mobile broadband services has stimulated great demands on wireless radio networks, we have seen that heterogeneous network (HetNet) technology has been studied theoretically by academia [1] and standardized for LTE-Advanced systems [2]. In a network there is large variation in traffic density and some hotspots usually have a high traffic load. These hotspots often become the bottleneck and have major negative impacts on the network. One way to solve the problem is by adjusting the pilot power levels. The pilot power levels should be carefully chosen to optimize the network performance.
Several works have been found to deal with pilot power allocation in small cell networks. In [3], pilot power is allocated to ensure a constant femtocell radius. In [4], pilot power is allocated to maximize the cell coverage. These schemes are designed to work in open access mode and are not applicable in closed mode. In [5], pilot power of femtocell is allocated to minimize the signaling overhead in macro cellular network by mobility event of passing users. However, this mobility-based scheme does not work well when registered user equipments (UEs) and public UEs are close to a femto access point without much mobility. Considering traffic distribution, pilot power management scheme has also been studied in WCDMA networks [6], where full transmit power of bases station is assumed.
We present a decentralized multi-objective pilot optimization algorithm that works towards achieving user load balancing and minimization of coverage holes and overlap as well as meeting smooth
horizontal handover requirements between small cell networks. Then we propose to use the firefly algorithm to get the pilot power solutions of the optimization problem. We present simulation results for pilot power design for dense small networks in an enterprise environment.
2 SYSTEM MODEL
We consider a two-tier HSDPA cellular network with one macrocell base station (MBS) and a group of picocell base stations (PBSs) in an enterprise environment which share the same frequency channels. We assume the closed-access mode is used, where a UE will connect to a PBS only if it receives higher pilot power strength from its host PBS than from MBS; otherwise, the UE camps on MBSs.
Let I={1,2,…,M} denote the set of all picocells.
The service area is represented by a grid of bins
J={1,2,…,N} with a certain resolution, in which
signal propagation measurements are performed. We assume that the conditions of signal propagation are the same across the entire bin. Let B(i,j) denote the jth bin in the ithpicocell and each bin is assumed to
be a small rectangle with size of a×b, as shown in
Fig. 1.LetPidenote the transmit power of picocelli
and xi denote its pilot power. Hence, the power for traffic signals can be written as pi-xi Likewise, for each MBS k, letSkpandSTk denote the pilot power
and total transmission power respectively. For simplicity, we assume all channels are perfectly orthogonal in the downlink for both picocells and macrocells.
In this paper, we consider planning scenarios with
Optimal Design of Pilot Power Based on Firefly Algorithm for
Heterogeneous Small Cell Networks
Xiaodi Gong, Xiaorong Zhu, Chenjun Zhou, Weiran Zhu
Nanjing University of Posts and Telecommunications, Nanjing, Chinahigh traffic load, and assume that all PBSs operate at full power, i.e., T,
i i
P =P ∀ ∈i I. For each cell-bin B(i,j), we use gmijandhkijto denote the channel gain
from the mth PBS and kth MBS respectively. Then,
the total interference received by a terminal in cell-bin B(i,j) can be written as
0
1, mij 1 k
M T K T
ij m m i i mij k kij kij
I =
∑
= ≠ P g d−α +∑
= S g d−α +N(1) wheredmijanddkijdenote the distance between the
geometry center of the cell-bin B(i,j) and mth PBS
and kth MBS respectively, N0 is the noise power, and
K is the number of macro BSs.
The quality of common pilot channel (CPICH) can be measured in terms of Ec/Io, which represents the ratio of the received energy per chip of CPICH to the noise power spectral density (PSD) plus interference density. Let γijdenote the Ec/Io at B(i,j), we then have
i j
i i j ij
ij x g d
I
α
γ
−
= (2)
wheredij is the distance between the PBSi and bin j and gijis the channel gain between them.
We assume that the pilot signal from PBS i can
be detected in bin j if and only if its Ec/Io ratio is above a threshold γ0, that is, if
0 ij
γ ≥γ (3)
From (2) and (3), we can obtain
1
0
( i j i)
ij ij g x d I α γ
≤ (4)
Assuming perfect power control, for a given pilot power level xifor picocelli, we can obtain its coverage area with radius Rfias
1
0
( i j i)
fi ij g x R I α γ
= (5)
Since each bin is assumed to be a small rectangle with size of a×b, the number of bins in picocelli, Nfi,can be approximately by
2 2
0
( )
fi i j i
fi
ij
R g x
N
ab ab I
α
π π
γ
= = (6)
In addition to receive pilot signal from PBSs, each terminal also receives pilot signals from nearby macro BSs. The Ec/Io, from the kth macro BS at bin
B(i,j) is
1 1 1 0
1 kij 1 1, 1 k
p k kij kij
kij M T K T
i kij k ij k ij
i k k k
S g d
P g d S g d N
α α α β − − − = = ≠ = + +
∑
∑
(7)Let βk*ij denote the strongest pilot signal strength from neighboring macro BS k* received by a
terminal in bin B(i,j) so that βk*ij=maxkβkij.
To guarantee the terminals in bin j to be attached
with one PBS i rather than macro BSs, the minimum Ec/Io, of this terminal in bin j from PBS ishould be greater than the maximum Ec/Iofrom macro BSs by ε, i.e.,
*
ij k ij
γ ≥β +ε (8)
We focus on the problem of distributed PBS coverage optimization, by means of updating the PBS’s pilot channel transmit power only, to satisfy the following three objectives:1)To minimize picocell coverage holes within the picocell group’s intended area of coverage to satisfy the demands of services of users.2)To balance the load amongst the picocells in the group to prevent overloading or underutilization.
3 PROBLEM FORMULATION OF PILOT POWER OPTIMIZATION
In this section, we present a model that maximizes the capacity for the small cells by selecting pilot power levels optimally, subject to the coverage degree constraint and the horizontal handoff probability constraint. In our model, we introduce two control parameters, δ (0≤δ≤1) and µ (0≤µ<1) to
denote the minimum required traffic coverage degree the horizontal handover probability of picocell network respectively. We define the following two types of variables as follows.
1 if bin is covered by at least one picocell, 0 otherwise.
j
j z =
(9)
1 if picocell covers bin , 0 otherwise.
ij
i j
y =
(10)
In order to ensure that one terminal can smoothly handoff from one picocell to another and prevent it migrating from picocell to macrocell, those bins at the boundary of picocells have to be in the overlapping area of at least two picocells, say i and m. Hence, we define a binary matrix of size M×M×N
×K as follows.
{ imj, , , }
G= G i m∈I j∈J (11)
such that
1 if or satisfy (8), 0 otherwise.
ij mj imj G γ γ =
(12)
Let s ij
ω denote the amount of power needed to
serve one unit of traffic demand of service s in bin j.
bin j, picocelli needs a certain amount of power for
each demand unit such that the corresponding Eb/No target is achieved, i.e.,
i j i j
s
i j s
ij g d I α ω γ −
≥ (13)
whereγs is the Eb/No target for service s. Thus, then minimum of s
ij ω is min i j s s ij s ij i j I
g d α
γ ω
−
= (14)
For bin j, we usetsjto denote its traffic intensity of
service type s, i.e., the average number of active
users in the bin asking for service s. For picocelli,
the minimal amount of power needed to support the user traffic of all service types can be calculated as
min
( ) ( )
ij
s ij
s s s
ij j j
s j B i s j B i i j
I
t t
g d α
φ φ γ ω − ∈ ∈ ∈ ∈ =
∑ ∑
∑ ∑
(15)whereΦ is the set of service types supported by the
networkand B(i) is the set of bins in which picocelli
provides coverage with its pilot signal.
To estimate the downlink capacity in picocelli,
we use the ratio between the available power resource, T
i i
P −x , and the power consumption for
user traffic in the picocell for all service types, i.e., the capacity ratio of picocelli, Qi is thus
min ( ) T
i i
i s s
ij j s j B i
P x Q t φ ω ∈ ∈ − =
∑ ∑
(16)The mathematical formulation of problem (MP) is presented below[6]:
[MP] *
1 2
( ) max min ,i ( , , , M)
i I
Q Q x x x
∈
= =
x x L (17)
s.t.γijyij ≥γ0 (18)
,
ij j
i I
y z j J
∈
≥ ∀ ∈
∑
(19)s j j s j J
t z T φ
δ
∈ ∈
≥
∑∑
(20), ,
{ }
max
s
j ij mj imj
i m I j J
s j J
t y y G T
φ
µ ∈ ∈
∈ ∈
⋅ ≥
∑∑
(21)whereT denotes the traffic demand in the entire
network. For each bin j, constraints (19) ensure that
bin j is covered by at least one cell if zj indicates that this bin has to be covered to satisfy the coverage degree requirement. Constraint (20) ensures a given portion of traffic demand to be covered by at least one cell guaranteeing the required coverage degree in the network. Constraint (21) ensures a given horizontal handover probability in the
picocellnetwork. In (22), for bin j,
, ,
{ }
max
i j mj imji m I j J
y y G
∈ ∈
is one if there exists at least one
pair of picocells for which (8) holds and both cells provide coverage for bin j, otherwise it is zero.
4 THE FIREFLY ALGORITHM USED FOR OPTIMIZATION PROBLEM
In this section, we use the firefly algorithm (FA)[7] to get the solutions of our proposed optimization problem.
We define the terms of the FA as follows.
A. Attractiveness
The attractiveness of a firefly is determined by its light intensity. The attractiveness is calculated by using the following equation
β(r)=β0e-γr^2 (22)
B. Distance
The distance between any two firefly i and firefly j
at xi and xj is
rij=|| xi -xj || (23)
C. Movement
In every iteration, each firefly will move toward to the firefly with larger light intensity. The movement of this firefly is determined by
Xit+1=Xit+u*e-α*r^2*( Xit- Xit-1) (24) whereu is the attractiveness at r=0.
Therefore, the algorithm includes the following steps: initialization, updating light intensity, determining the next movement, and updating decision circle.The algorithm works iteratively and calculates the pilot power of each small cell and its optimal capacity ratio in every iteration. In each iteration, the algorithm examines the set of bins that are still uncovered, and identifies a small cell that defines the bottleneck of the capacity ratio.
5 SIMULATIONS
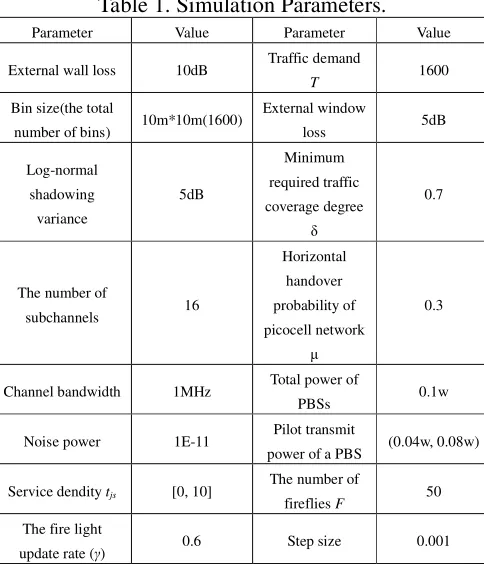
Table 1. Simulation Parameters. Parameter Value Parameter Value
External wall loss 10dB Traffic demand
T 1600
Bin size(the total
number of bins) 10m*10m(1600)
External window
loss 5dB
Log-normal shadowing variance
5dB
Minimum required traffic coverage degree
δ
0.7
The number of
subchannels 16
Horizontal handover probability of picocell network
µ
0.3
Channel bandwidth 1MHz Total power of
PBSs 0.1w
Noise power 1E-11 Pilot transmit
power of a PBS (0.04w, 0.08w)
Service dendity tjs [0, 10]
The number of
fireflies F 50 The fire light
update rate (γ) 0.6 Step size 0.001
Fig.1 shows the capacity increases with the increase of service density until it reaches the stable state. Also it is seen that the capacity of our proposed algorithm is uniformly higher than that with fixed pilot power schemes. It attributes to the fact that the proposed algorithm can adaptively adjust the pilot power level to adapt to the service density and therefore more power is saved for service transmission.Fig.2 shows the higher network coverage rate, the bigger average pilot power is. For example, when service density is 12, the average pilot power is 0.076 to reach 90% network coverage. Whereas, the average pilot power is 0.0722 when 70% network coverage rate is required and then 5% power is decreased.Fig.3 shows the relation between network coverage rate and service density for different numbers of PBSs. It is seen that before reaching the stable state, network coverage rate increases with the increasing of service density. It is because the pilot power and signal powers both increase in order to meet the increase of the service requirements until the maximum power is reached and then the system remains stable.
6 CONCLUSION
In this paper, we propose a pilot power optimization algorithm for dense small networks in enterprise environment. Simulation results show that compared with fixed pilot power allocation scheme, the proposed algorithm has such good performances as
[image:4.612.329.535.67.219.2]much lower allocated pilot power and better coverage degree.
Figure 1. Relation between system capacity and service density.
Figure 2. Relation between average pilot power and service density.
Figure 3. Relation between network coverage rate and service density for different numbers of PBSs.
REFERENCES
[1]W. Cheung, T. Quek, and M. Kountouris. Throughput
Optimization, Spectrum Allocation, and Access Control in
Two-Tier Femtocell Networks. IEEE JSAC, vol. 30, no. 4,
Apr. 2012, pp. 561–74.
[2]http://www.3gpp.org/ftp/specs/archive/36_series/36.902.
[image:4.612.322.536.245.406.2] [image:4.612.333.533.443.599.2][3]H. Claussen. Performance of macro- and co-channel
femtocells in a hierarchical cell structure. IEEE 18th
International symposium on Personal, Indoor and Mobile Radio Communications, 2007.
[4]Y. Y. Li and E. S. Sousa. Base station pilot management
for userdeployed cellular networks. IEEE International
Conference on Communications, 2009.
[5]H. Claussen, L. T. W. Ho and L. G. Samuel.
Self-optimization of coverage for femtocell deployment.
Wireless Telecommunications Symposium, 2008, pp.
278-285, Pomona, 2008.
[6]I. Siomina, P. V¨arbranda and D. Yuana. Pilot power
optimization and coverage control in WCDMA mobile
networks. Telecommunications Applications, pp. 683-696,
vol. 35. no. 6. December 2007.
[7]X. S. Yang. Firefly algorithms for multimodal optimization.
Stochastic Algorithms: Foundations and Applications