2017 International Conference on Mathematics, Modelling and Simulation Technologies and Applications (MMSTA 2017) ISBN: 978-1-60595-530-8
Privacy Preserving Distributed Cell-based K-means Clustering Algorithm
Fang SU, Yun-xiao ZU
*and Wei-hai LI
School of Electronic Engineering, Beijing University of Posts and Telecommunications, Beijing, 100876, China
*Corresponding author
Keywords: K-means, Cell, Privacy preserving, Distributed system.
Abstract. In the traditional K-means clustering algorithm, the number of clusters is difficult to be
estimated and the selection of the initial cluster centers has a great influence on the clustering results. To solve these problems, we proposed cell-based K-means clustering algorithm. The objects closer to a cluster center are dense, and the objects farther away from a cluster center are sparse. Therefore, we analyzed the distribution of objects by dividing the data space into cells. Theoretical analysis and experimental results show that the improved algorithm not only can get the number of clusters, but also can select the initial clustering centers close to the true cluster centers. In addition, we applied the improved algorithm to distributed system, which can achieve both the security of data and the accuracy of clustering.
Introduction
Data mining is a process of discovering useful knowledge in a large amount of data. Data mining techniques include association rules, classification, prediction, clustering and outlier analysis [1]. Clustering analysis is a very important branch of data mining. The goal of clustering is that the objects in the same group are similar, while the objects in different groups are different. Clustering analysis is widely used in the fields of market research, speech recognition, image processing and data compression. According to different needs, different clustering methods have been developed, such as partition-based, hierarchical-based, density-based and grid-based [2].
The goal of partition-based clustering is to divide a data set containing n objects into k groups,
each of which represents a cluster. K-means clustering is a representative algorithm of partition-based method. Distance is used as the evaluation standard of similarity, that is, the closer the two objects are, the higher the similarity is. K-means clustering algorithm has the advantages of scalability, high efficiency and nearly linear time complexity, but it also has some disadvantages [3,4]. Therefore, this paper proposes the cell-based K-means clustering algorithm (hereinafter referred to as “CK-means clustering algorithm”). We divide the data space into cells, and each object is mapped in a specific cell. By analyzing the cells, we can get the number of clusters and effective initial clustering centers.
CK-means Clustering Algorithm
K-means Clustering Algorithm
The idea of K-means clustering algorithm is that, randomly select k objects from the data set as the
initial cluster centers, calculate the distance between each object and each cluster center, assign the objects to the nearest cluster, recalculate the cluster centers and reassign the objects. Iterate through the process until the termination condition is met. The termination condition may be one of the following conditions:
1) The cluster centers do not change anymore. 2) Each object is not reassigned.
3) The clustering criterion function converges. One of the common criterion functions is as follows:
2
1 i j
k
i j j x W
E x
(1) Here, xi is the object in cluster Wj, j is the mean of cluster Wj.Related Definitions
Suppose the data set X has n objects { , , , }x x1 2 xn , and each object has m
attributes{ , , , }a a1 2 am . After preprocessing the data, the value range of the objects in dimension
1,2, , (j )
j m is from minj to maxj. We divide each dimension of the data space into d intervals
equally [7]. Thus the data space is divided into m
d independent cells. U represents a cell.
Definition 1. Cell ID: The spatial location of a cell can be uniquely identified by an integer
sequence ( , , ,u u1 2 um), and uj is the id in dimension j of the cell.
Definition 2. Cell side length in dimension j, lj:
max min
, 1, 2, ,
j j
j m
l
d j
(2) Definition 3. The mapping of object xi ( ,x xi1 i2, , xi m), ( , , ,y y1 2 ym):
min
1 , 1, 2, ,
ij j j
j x
y j m
l
(3) Definition 4. The density of a cell, Den: Each cell has the same volume, so the density of a cell is
the number of objects mapped in the cell. If Den is greater than 0, the cell is a non-empty cell. If Den is equal to 0, the cell is an empty cell.
Definition 5. The sum of the objects in a cell, Sum(Sum Sum1, 2, , Summ):
i
i x U
Sum x
(4) Definition 6. Density threshold, DenTh:n DenTh
count
(5)
Here, count is the number of non-empty cells.
Definition 8. Adjacent cells: U1( , , ,a a1 2 am) and U2 ( , , , )b b1 2 bm are cells in the data
space. If aibi 1(i[1,m]) and aj bj(j1, 2, , i1,i1, , ) m , U1 and U2 are adjacent cells.
Definition 9. Connected area of the dense cell, A: Mark a dense cell and find its adjacent cells. If
some of its adjacent cells are dense cells, make the same mark. Continue to scale out until none of their adjacent cells is a dense cell. Cells with the same mark form a connected area.
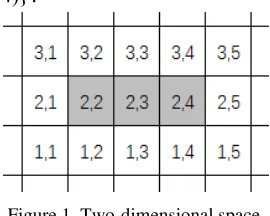
Taking two-dimensional space as an example, as shown in Fig. 1, the number in the cell is cell ID.
Assume that (2, 2) is a dense cell and mark (2, 2) as a. If its adjacent cell (2,3) is a dense cell, mark
(2,3) as a. Scale out to find adjacent cells of (2,3) . If cell (2, 4) is a dense cell, and mark it as a.
Except (2, 2) , (2,3) and (2, 4) , none of their adjacent cells is a dense cell. Cells marked a form a
[image:3.612.238.373.211.319.2]connected area A{(2, 2), (2,3), (2, 4)}.
Figure 1. Two-dimensional space.
CK-means Clustering Algorithm The algorithm flow is as follows:
Input: A data set consisting of n objects X { , , , }x x1 2 xn
Output: kclusters
1) Preprocess the data set and divide the data space into cells. Each object is mapped in a specific cell.
2) Calculate the density of each cell. 3) Calculate the density threshold DenTh.
4) Select the cell with the largest density, search for its connected area and mark it as A1. In the
unmarked dense cells, select the cell with the largest density, search for its connected area and mark it as A2.Continue this process until all the dense cells are marked. In this process, if there is more than
one cell with the largest density, select the cell farthest away from the previous connected areas [8]. 5) The number of connected areas can be used as the number of clusters k. Calculate the mean of
the objects in the connected areas Aj and take it as initial cluster center cj:
, 1, 2 ,
j
j
U A j
U A Sum
c j k
Den
(6) 6) Calculate the distance between object x ii( 1,2 , )n and cluster center cj(j1, 2 , ) k , andassign each object to the nearest cluster. This paper uses Euclid Distance:
2
1
( , )i j m ( i p j p)
p
distance x c x c
(7) 7) Calculate the mean of cluster Wj and take it as cluster center cj.PPDCK-means Clustering Algorithm
In distributed system, we randomly select a site as the master site, and take the other sites as the slave sites. Every site processes the local data, and the slave sites send the processed data to the master site, and the master site processes the global data [9,10]. Every site does not reveal its original private data. Suppose the distributed system contains r sites { , , , }(S S1 2 Sr r3), and the corresponding data
sets are { ,X X1 2, , Xr}. The global data set is
1 r i i X X
. Data set X ii( 1, 2, , ) r has ni objects,and every object has m attributes. Suppose Sr is the master site, and { , , ,S S1 2 Sr1} are the slave
sites.
The algorithm flow is as follows: Input: Data sets { ,X X1 2, , Xr} Output: kclusters
1) Every site takes the unified method to preprocess the local data set and divide the data space into cells. Each object is mapped in a specific cell.
2) Every site calculates ( ,ID Den Sum, ) of each local cell.
3) Slave site (Si i1, 2, , r1) randomly divides each local cell data (Den Sumi, i) into r1
sub-data
1 1 2 2 1 1
{( , ),( , ), ,( , )}
r r
i i i i i i
Den Sum Den Sum Den Sum
. Here, 1
1 t r i i t Den Den
, 1 1 t r i i t Sum Sum
. Si sends 1 sub-data to each of the other r2 slave sites. In other words, Si sends( , , )
t t
i i
ID Den Sum to St( 1,2, , 1, 1, ,t i i r1) and keeps ( , , )
i i
i i
ID Den Sum .
4) Slave site Si receives r2 sub-data sent from the other slave sites. For the same ID, Si
calculates ' 1
1 i r i t t Den Den
and ' 11 i r i t t Sum Sum
. 5) Slave site Si sends' '
(ID Den Sum, i, i) to master site Sr.
6) Master site Sr receives r1 updated cell data sent from slave sites { , , ,S S1 2 Sr1}. For the
same ID, Sr calculates
1 ' global 1 r i r i
Den Den Den
and 1 'global 1 + r i r i
Sum Sum Sum
.7) Master site Sr calculates the global density threshold DenTh
Denglobal count.
Denglobalis the number of the objects, and count is the number of the global non-empty cells.
8) Master site Sr filters out the global dense cells and searches for the connected areas of the
global dense cells. The number of the connected areas can be used as the number of clusters k. Sr
calculates the mean of the objects in connected areas Aj and takes it as initial global cluster center
j c :
global
global
, 1, 2 ,
j j U A j U A Sum
c j k
Den
(8) 9) Master site Sr broadcasts the global cluster centers { , , , }c c1 2 ck .11) Slave site Si calculates local cluster data ( ,n Csumij ij). nij is the number of the objects in
cluster Wj on site Si. Csumij, a m-dimensional variable, is the sum of the objects in cluster Wj on
site Si. Si randomly divides ( ,n Csumij ij) into r1 sub-data. Si sends 1 sub-data to each of the
other r2 slave sites. In other words, Si sends ( , )
t t
ij ij
n Csum to St( 1,2, , 1, 1, ,t i i r1) and
keeps ( , )
i i
ij ij
n Csum .
12) Slave site Si receives r2 sub-data sent from the other r2 slave sites and calculates
1 ' 1 i r ij tj t n n
and ' 11 i r ij tj t Csum Csum
.13) Slave site Si sends
' '
( ,n Csumij ij) to master site Sr.
14) Master site Sr calculates local cluster data ( ,n Csumrj rj) and receives r1 updated cluster
data sent from slave sites { , , ,S S1 2 Sr1}. Sr calculates the mean of cluster Wj and takes it as
cluster center cj:
1 ' 1 1 ' 1 1,
, 2, ,
r ij rj i r ij rj i j Csum Csum j k n c n
(9) 15) Iterate through process 9)-14) until the cluster centers do not change anymore.Experimental Results
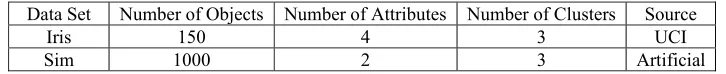
[image:5.612.125.488.491.528.2]In order to verify the effectiveness of the improved K-means clustering algorithm, we compared the traditional K-means algorithm and the improved K-means algorithm. The test data sets are Iris from UCI database and Sim randomly generated by MATLAB simulation tool. They have certain classifications. Therefore, the accuracy of clustering can be used to evaluate the performance of the improved algorithm.
Table 1. Data set description.
Data Set Number of Objects Number of Attributes Number of Clusters Source Iris 150 4 3 UCI Sim 1000 2 3 Artificial
In this paper, K-means clustering algorithm, CK-means clustering algorithm and PPDCK-means clustering algorithm experiments were carried out ten times, and take the mean as the clustering results. The distributed system contained sites { , , }S S S1 2 3 , and the test data were distributed
horizontally on 3 sites.
The clustering results are shown in Fig. 2 and Fig. 3. The formula of the accuracy of clustering is as follows:
1
1
k j jaccuracy z
n (10)
Figure 2. Number of iterations. Figure 3. Accuracy of clustering.
Conclusion
Selection of the number of clusters and the initial cluster centers will influence the clustering results of K-means algorithm [11]. This paper optimized the algorithm for both of the problems. We get the dense cells by mapping the objects to the corresponding cells, search for the connected areas, take the number of connected areas as the number of clusters and take the mean of the connected areas as the initial cluster centers. Compared with the traditional K-means algorithm, CK-means clustering algorithm successfully reduces the number of iterations and improves the accuracy of clustering. Therefore, we apply the improved algorithm to privacy preserving distributed systems. By analyzing the experimental results, we found that PPDCK-means clustering algorithm achieves both the security of data and the accuracy of clustering.
Acknowledgement
This work is supported by Beijing Key Laboratory of Space-ground Interconnection and Convergence (Beijing University of Posts and Telecommunications).
References
[1] Ming-xing Wang. Data Mining Algorithm Optimization Research and Application [D]. Hefei: Anhui University, 2014.
[2] Yu-hui Han, Shu-liang Zhao, Meng-meng Liu. Multi-scale Clustering Mining Algorithm [J]. Computer Science, 2016, 43(8): 244-248.
[3] Yan-yun Cheng, Peng Zhou. Improved K-means Clustering Algorithm for Dynamically Allocating Clustering Centers [J]. Computer Technology and Development, 2017, 27(2): 33-36, 41. [4] Xiao-yu Li, Li-ying Yu, Hang Lei. Parallel Implementation and Application of A K-means Improved Algorithm [J]. Journal of University of Electronic Science and Technology of China, 2017, 46(1): 61-68.
[5] Lei Zhou. Reflections on Distributed Data Mining Solutions [J]. Journal of Changzhou Vocational College of Information Technology, 2016, 15(5): 22-24.
[6] Wu Yuan. Research on Privacy Preserving Data Mining in Distributed Environment [D]. Nanjing: Nanjing University of Posts and Telecommunications, 2015.
[8] Xing-shu Chen, Xiao-song Wu, Wen-xian Wang. K-means Initial Clustering Center Optimization Algorithm based on Characteristic Degree of Association [J]. Journal of Sichuan University (Engineering Science Edition), 2015, 47(1): 13-19.
[9] Liu-sheng Huang, Miao-miao Tian, He Huang. Research on Big Data Privacy Preserving Cryptography [J]. Journal of Software, 2015, 26(4): 945-959.
[10] Xiang Wu, Xiao Yu, Huan-huan Wang. Design of Anonymized Private Data Publishing System for Data Mining [J]. Application of Electronic Technique, 2016, 42(11): 62-65.