A CONSTRUCTIVE DISTANCE-BASED BOUNDARY
DETECTION APPROACH WITH NUMERIC VARIABLES
1A. ANITHA, 2DR. E. KANNAN
1
Research Scholar, Bharathiar University, Coimbatore, Tamil Nadu, India. 2
Dean, School Of Computing, Vel Tech University, Chennai, Tamil Nadu, India. E-mail: [email protected], [email protected]
ABSTRACT
Existing Data Mining techniques, concentrates mainly on finding patterns in large datasets and it also focuses on concepts such as classification, association rules and clustering. Very few work aims on finding Boundary values in classification. Boundary values are the small subset of the data set which contains critical information useful for predicting accurate class labels for the new instances. This paper describes technique for detecting boundary records using different distance based approach during classification task and computes the computational time for extracting the instances using different distance metrics. The records isolated as boundary region of the specified class, can contain domain-specific information which is useful for finding critical records to improve the classification accuracy. This information is useful for further decision making in classification. Experiments are carried out for numeric data set and results shows that only subset of the data set are found to be boundary set and compares the computational time for extracting the boundary region using the distance metrics.
Keyword:Classification, Outliers, Boundary Region, Euclidean, Manhattan, Minkowski, Chebychev
1. INTRODUCTION
Data Mining is one of the thrust areas of research in recent times as an emerging technique for finding and predicting useful information from the complex and huge amount of data. It has diverse applications in different fields which can lead to illegal or abnormal behavior such as fraud detection [1], network intrusion detection[2], finding abnormal trends in time series data[3]. Good research work has been carried out for discovering interesting patterns or rules in data sets [4], [5] and [6]. In [7], the study was extended for outlier mining and the notion of distance-based outliers was projected to identify records that are different from the rest of the data set. A good definition of outlier is that of [8], an outlier is an observation that deviates so much from other observations as to arouse suspicious that is caused by different mechanism. However there is no much research works carried out for identifying the boundary records and analyzing the records near the boundary region during classification. Classification in Data Mining is a supervised machine learning problem focusing great attention in the field of data analysis. Instances which are on the boundary region can contain domain specific
information which is more useful for the accurate classification.
The objective of this paper is to detect and isolate boundary records for a two class problem using different distance measures . It also specifies the computational time for extracting the boundary instances using different distance measures. Boundary records are isolated based on the visualization technique. The experiments are carried out with numeric data set and the experimental results also analyses the computational time for various distance measures.
specific information which is processed to identify the critical records for improving the classification accuracy.
2. DISTANCE METHODS OVERVIEW 2.1 Raw Euclidean Distance
Euclidean Distance inspects ordinary distance by computing root of squared differences between coordinates of pair of objects [11], [12]. It examines two objects across the range of variables and determines the dissimilarity of the objects. It is formulated based on Pythagoras Theorem. The Distance measure is given as
, ଶ
ୀଵ
It is an exceptional case of Minkowski distance with 2. The prototype model of Euclidean distance in 2-dimension is circular. If the sink is on the center, it forms concentric circles around the center.
2.2 Standardized Euclidean Distance
Standardized Euclidean Distance computes the root of the squared distances between the pair of objects [11] ,[12]. In Raw Euclidean Distance, if the variables are on all completely different scales of measurement and the larger depth values has large inter sample differences, which will dominate the calculation of distances. Standardization/Normalization is needed to scale the values for balancing the contributions of the variables equally. Variables in the Data set is standardized as
(Actual Value – Mean ) Standardized Value = StandardDeviation
Standardized Euclidean Distance is the distance computed on standardized data.
2.3 Manhattan Distance
Manhattan Distance is the sum of the absolute values of the differences of the coordinates [11], [12]. It is also called as City block distance or Boxcar distance. It is the distance between objects measured along axes at right angles. The Distance measure is given as
,
ୀଵ
It is an exceptional case of Minkowski distance with 1. The prototype model of Manhattan Distance in 2- dimension is diamond. If
the sink is on the center, it forms concentric circles around the center.
2.4 Chebychev Distance
Chebychev distance is the distance between two objects is the maximum of their differences along the coordinate dimension and it is calculated as the absolute magnitude of the differences between coordinate pair of objects [11]. The Distance formula is given as
, !"
The pattern of Chebychev distance in 2-dimension is square. When the sink is in center it forms concentric squares around the center.
2.5 Minkowski Distance
Minkowski Distance is the comprehensive Metric distance
#$%# , &
ଵ ఒ
ୀଵ
'
ఒ
When 1, the distance metric is Manhatten distance and when 2, the distance is Euclidean distance. When ∞, it becomes Chebychev distance. When the value of λ is greater than 2, the pattern of the Minkowski gradually changes from concentric circles to concentric square.
3. PROPOSED METHODOLOGY
Figure 1: Proposed BSD Method
The BSD is carried out in two levels because the work emphasis on classification for two class problems (say class labels B and M). In each level, a boundary set is extracted from the training set for each class. To extract the Boundary set for class B, calculate the distance to all instances in class M from every instance of class B. For each
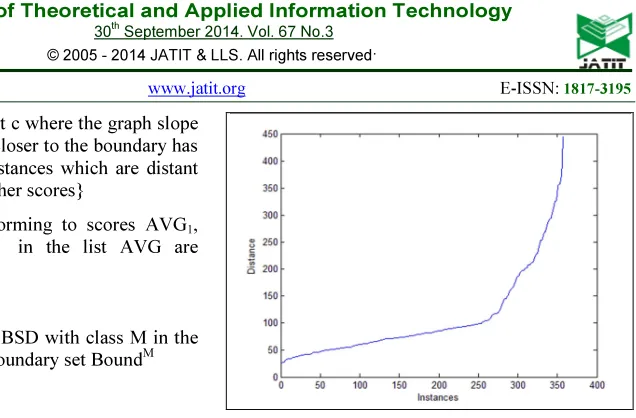
instances of class B, identify five closest instances of class M and average of the five distances is computed (AVGi.). The score AVGi calculated for each of the class B, is sorted in a list AVG. To isolate the Boundary Points, a cutoff point is needed. The scores AVG are plotted in a graph by using visualization technique. Instances which are very near to the boundary have the smallest AVG score where as the points which are not closest to the boundary has higher AVG score. A cutoff index is identified, where the slope of the graph rises sharply. The instances within the cutoff point are extracted as boundary region with lower AVG scores. The point above the cutoff point is inner instances with higher AVG scores. The same process is carried out once again for extracting boundary set for class M.
4. DATA DESCRIPTION
The Data Set used is Wisconsin Diagnostic Breast Cancer (WDBC). WDBC is acquired from UCI Machine Learning Repository [9]. The WDBC data set has 569 records with 32 attributes. It has two class labels B and M. There are 212 instances belongs to class M and 357 instances belongs to class B.
The data set features are determined from digitized image of Fine needle Aspirate (FNA). It represents characteristics of each cell nuclei exist in the image to determine whether tumor present is Benign or Malignant.
5. PROPOSED ALGORITHM
Input: Training data instances for classes B and M
Output: Boundary data instances for classes BoundB and BoundM
Step 1: Create an Array AVG and set to ϕ
Step 2: For each instance in class B do
Enumerate distance to all the instances in M
Using K-nearest neighbor find 5 nearest points in M
AVGi = Average of the top 5 distances.
Assign each AVGi score to list AVG.
End for
Step 3: Sort AVG in ascending order
Step 4: Plot sorted scores AVG in a graph
Collect WDBC Data set
Classify the data set into classes B andM
Compute Distance to all the instances in
Compute Distance to all the instances in
Apply K-Nearest Neighbor to find five closest points
Calculate Average of the top five distances
Plot the sorted scores in a graph
Identify the cut-off index
Step5: Identify cutoff point c where the graph slope rises sharply. { Instances closer to the boundary has lesser scores, where as instances which are distant from the boundary has higher scores}
Step 6: Instances conforming to scores AVG1, AVG2... , AVGc in the list AVG are Boundary set BoundB
Step 7: return BoundB
Step 8: Repeat Algorithm BSD with class M in the position of B to retrieve Boundary set BoundM
6. RESULT
[image:4.595.192.510.71.280.2]The proposed BSD method is implemented in MATLAB 7.12.0(R2011a). It identifies and isolates the subset of Boundary Set from the training set for each class. It also uses five Distance metric to retrieve the boundary set. The distance computed is plotted in a graph and cutoff index is chosen from the graph to isolate the boundary records. Table 1 shows Boundary set (number of instances) for classes B and M using five Distance metrics. The results shows that subset of the dataset is identified as boundary set and by using all the five distance metrics BSD identifies approximately 50% of the data set as Boundary instances. This reduces the search space for further analysis of classification problem thus reducing the time complexity.
Table 1: Boundary Set for Distance Metrics
Distance Metric
Boundary set for Benign
class(B)
Boundary set for Malignant
class(B) Raw
Euclidean
152 124
Standardized Euclidean
145 113
Manhattan 135 115
Chebychev 141 116
Minkowski ( 5)
128 116
The Fig.2, Fig.3, Fig.4 and Fig.5 shows the graphical representation of the Raw and Standardized Euclidean Distance computed for classes B and M.
[image:4.595.304.513.317.476.2]Figure 2: Raw Euclidean Distance for class B
Figure 3: Raw Euclidean Distance for class M
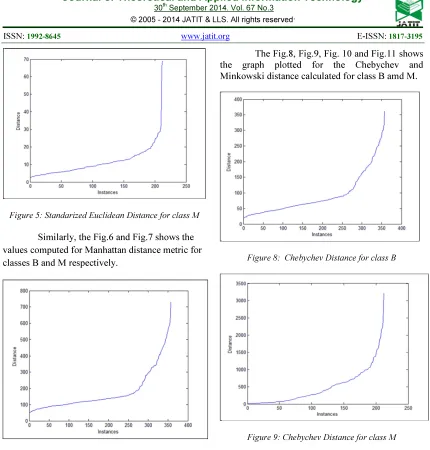
[image:4.595.209.507.502.661.2]Figure 5: Standarized Euclidean Distance for class M
[image:5.595.87.297.355.520.2]Similarly, the Fig.6 and Fig.7 shows the values computed for Manhattan distance metric for classes B and M respectively.
Figure 6: Manhattan Distance for class B
Figure 7: Manhattan Distance for class M
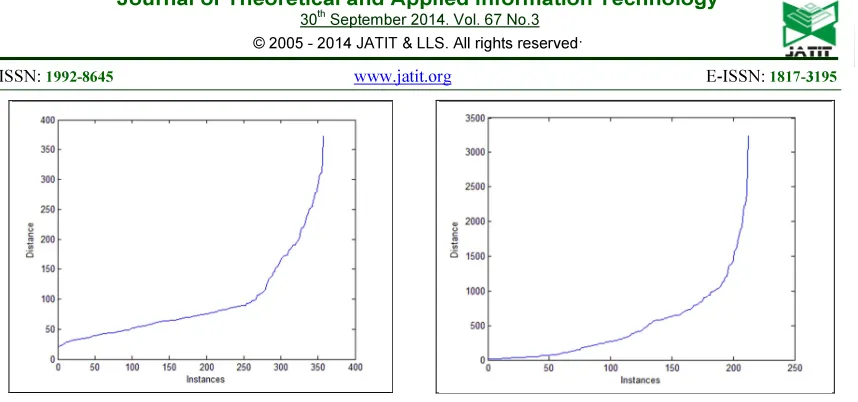
The Fig.8, Fig.9, Fig. 10 and Fig.11 shows the graph plotted for the Chebychev and Minkowski distance calculated for class B amd M.
Figure 8: Chebychev Distance for class B
Figure 9: Chebychev Distance for class M
Table 2 shows the Execution time in seconds for extracting the boundary set using five Distance metrics. For BSD algorithm ten runs are carried out for each distance measure. The best case Execution time is shown in the Table 2. The results shows that the Standardized Euclidean Distance metric takes less computation time when compared with the other distance measures. The Manhattan Distance metric takes larger computational time when compared with the other Distance measures.
[image:5.595.87.291.539.707.2]Figure 10: Minkowski Distance for class B Figure 11: Minkowski Distance for class M
Table 2: Execution Time for Boundary Set Detection(BSD) Algorithm
S.no Distance Metric Execution Time (in seconds)
1 Raw Euclidean Distance 3.43
2 Standardized Euclidean Distance 2.85
3 Manhattan Distance 3.08
4 Chebychev Distance 3.74
[image:6.595.88.536.335.732.2]5 Minkowski Distance 3.22
Figure 12: Execution Time for BSD Algorithm using Distance measures
0 0.5 1 1.5 2 2.5 3 3.5 4
Raw Euclidean Seuclidean Manhattan Chebychev Minkowski
7. CONCLUSION
The Proposed BSD Algorithm plays crucial role in retrieving Boundary set during classification. It also reduces the search space near the boundary for identification of critical instances near the boundary which is most useful for further improvement of classification accuracy, thereby reducing the computational time. The experimental results shows that BSD algorithm extracts approximately 50% of the instances as Boundary instances. It clearly depicts that Standardized Euclidean Distance outperformed by consuming lesser computational time than by using other Distance measures. Also that, the Standardized Euclidean Distance scales the values which balances the contributions of all the variables equally. Experimental analysis shows that, by using Minkowski Distance, it performs similar to the Euclidean Distance for values of λ=3,4,5,6,7,8. When the values of λ is greater than 8, it shows minor difference in the distance values and the computational time. The results also confirmed that by using BSD, Chebychev distance takes larger computation time than the other distance metrics. Thus the proposed BSD reduces the search space and also decreases the time complexity for the analysis of classification problem.
The Boundary set detected using BSD can be further processed for identifying critical records in each class. The critical records may contain domain specific information which may switch to the other class by perturbing small changes in the attributes. Critical records which switch classes can improve the classification accuracy.
REFERENCES
[1] T. Fawcett and F.Provost, “Adaptive Fraud Detection”,Data Mining and Knowledge Discovery, vol. 1, pp.291-316, 1997. [2] A. Koufakou and M.GeorgeioPoulos, “ A
Fast Outlier Detection Strategy for Distributed High-Dimensional Data Sets with Mixed Attributes”, Data Mining and Knowledge Discovery, vol. 20, no. 2, special issue SI, pp. 259-289, Mar 2010. [3] M. Ye, X. Li, and M.E. Orlowska, “Projected
Outlier Detection in High-Dimensional Mixed-Attributes Data Set”, Expert
Systems with Applications, vol. 36, no. 3, pp.7104-7113, Apr.2009.
[4] K. McGarry, “A Survey of Interestingness Measures for Knowledge Discovery”,
Knowledge Eng. Rev., vol. 20, no. 1, pp. 39-61, 2005.
[5] L. Geng and H.J. Hamilton, “Interestingness Measures for Data Mining: A Survey”,
ACM Computing Surveys, vol. 38, article 9, http://doi.acm.org/10.1145/1132960.11329 63, Sept. 2006.
[6] E. Traintaphyllou, Data Mining and Knowledge Discovery via Logic Based Methods, Springer, 2010.
[7] E.M. Knorr, R.T. Ng, and V. Tucakov, “Distance-Based Outliers: Algorithms and Applications”, VLDB J., vol. 8, no.3/4, pp. 237-253, 2000.
[8] D. Hawkins, Identification of Outliers(
Monographs on statistics and Applied Probability).Springer,http://www.worldcat. org/isbn/041221900X, 1980.
[9]http://archive.ics.uci.edu/m1/machine-learning-databases /breast-cancer-wisconsin/breast-cancer.
[10] M. Akhil Jabbar and D.L. Deekshathatulu, “Heart Disease Classification using Nearest Neighbor classisifer with feature subset selection”, Anale. Seria Informatica., Vol. 11 fasc, 2013
[11] Archana Singh, Avantika Yadav, and Ajay Rana. “K-means with Three different
Distance Metrics”, International Journal
of Computer Applications (IJCA), Vol.67,, No. 10, pp 13-17, Apr 2013.
[12] Richa Loohach, and Kanwal Garg. "Effect of Distance Functions on K-Means
Clustering Algorithm”, International