N O V E M B E R 1 9 9 1
WRL
Research Report 91/11
Network Locality at the
Scale of Processes
research relevant to the design and application of high performance scientific computers. We test our ideas by designing, building, and using real systems. The systems we build are research prototypes; they are not intended to become products.
There is a second research laboratory located in Palo Alto, the Systems Research Cen-ter (SRC). Other Digital research groups are located in Paris (PRL) and in Cambridge, Massachusetts (CRL).
Our research is directed towards mainstream high-performance computer systems. Our prototypes are intended to foreshadow the future computing environments used by many Digital customers. The long-term goal of WRL is to aid and accelerate the development of high-performance uni- and multi-processors. The research projects within WRL will address various aspects of high-performance computing.
We believe that significant advances in computer systems do not come from any single technological advance. Technologies, both hardware and software, do not all advance at the same pace. System design is the art of composing systems which use each level of technology in an appropriate balance. A major advance in overall system performance will require reexamination of all aspects of the system.
We do work in the design, fabrication and packaging of hardware; language processing and scaling issues in system software design; and the exploration of new applications areas that are opening up with the advent of higher performance systems. Researchers at WRL cooperate closely and move freely among the various levels of system design. This allows us to explore a wide range of tradeoffs to meet system goals.
We publish the results of our work in a variety of journals, conferences, research reports, and technical notes. This document is a research report. Research reports are normally accounts of completed research and may include material from earlier technical notes. We use technical notes for rapid distribution of technical material; usually this represents research in progress.
Research reports and technical notes may be ordered from us. You may mail your order to:
Technical Report Distribution
DEC Western Research Laboratory, WRL-2 250 University Avenue
Palo Alto, California 94301 USA
Reports and notes may also be ordered by electronic mail. Use one of the following addresses:
Digital E-net: DECWRL::WRL-TECHREPORTS
Internet: [email protected]
UUCP: decwrl!wrl-techreports
To obtain more details on ordering by electronic mail, send a message to one of these
addresses with the word ‘‘help’’ in the Subject line; you will receive detailed
Network Locality at the Scale of Processes
Jeffrey C. Mogul
November, 1991
Abstract
Packets on a LAN can be viewed as a series of references to and from the objects they address. The amount of locality in this reference stream may be critical to the efficiency of network implementations, if the locality can be exploited through caching or scheduling mechanisms. Most previous studies have treated network locality with an addressing granularity of networks or individual hosts. This paper describes some experiments tracing locality at a finer grain, looking at references to individual processes, and with fine-grained time resolution. Observations of typical LANs show high per-process locality; that is, packets to a host usually arrive for the per-process that most recently sent a packet, and often with little intervening delay.
This Research Report is an expanded version of a paper that appeared in the Proceedings of the
SIGCOMM ’91 Conference on Communications Architectures and Protocols.
Permission to copy without fee all or part of this material is granted provided that the copies are not made or distributed for direct commercial advantage, the ACM copyright notice and the title of the publication and its date appear, and notice is given that copying is by permission of the Association for Computing Machinery. To copy otherwise, or to republish, requires a fee and/or specific permission.
Table of Contents
1. Introduction 1
1.1. Previous work 2
2. Addressing Model 2
2.1. Defining locality 4
3. Measurement Tools 5
3.1. Kernel and hardware support 5
3.2. The monitoring program 6
3.3. Locality analysis 7
3.4. Report-graphing programs 8
4. Experiments 9
4.1. Environments 9
4.2. Effects of different clock-resolution mechanisms 10
4.3. Effects of TCP port-to-process mapping algorithm 11
5. Results: persistence 12
5.1. Variation between trials 13
5.2. Distribution of packets among processes 14
5.3. Results from other locations 14
5.4. Summary and related work 15
6. Results: temporal locality 17
6.1. Dallying to exploit temporal locality 18
6.2. Simulation of infinite-speed networks 20
6.3. Simulation of latency-sensitive scheduling 22
6.4. Other approaches to wait-prediction 25
7. Future Work 26
8. Summary 27
9. Acknowledgements 27
List of Figures
Figure 1: Distribution of interarrival times 9
Figure 2: Low- and high-resolution measurements of same data 11 Figure 3: Distribution of packet arrivals among processes 14
Figure 4: Site-to-site variation in mean persistence 16
Figure 5: Temporal locality of reference at WRL 17
Figure 6: Temporal locality of reference at SRC 18
Figure 7: Variation between sites 19
Figure 8: Latencies for simulated infinite-speed LAN 21
Figure 9: SameDestPort results for wait-prediction 23
Figure 10: ReplyToPort results for wait-prediction 24
Figure 11: Packet counts corresponding to figure 9 24
List of Tables
Table 1: Trace locations 10
Table 2: Summary of trials: persistence 12
Table 3: Persistence for RPC packets only 13
Table 4: Persistence for packets to NFS server only 13
Table 5: Variation between 1-hour trials (n = 16) at WRL 13
1. Introduction
Packets on a LAN can be viewed as a series of references to and from the objects whose addresses appear in the packet headers. Just as with a CPU reference stream, one can consider the ‘‘locality of reference’’ in this packet stream. The locality can be both spatial (a sequence of accesses to a small set of objects) and temporal (repeated access to an object during a brief period). The amount of locality may be critical to the efficiency of network implementations, if it can be exploited through caching or scheduling mechanisms.
Network localities of reference form a hierarchy. Highest is the ‘‘subnetwork’’ level, often identifiable with specific LANs. Routers, for example, make decisions based on network IDs, and the use of a routing lookup cache has been shown to be profitable [10]. At the next level is the individual host; per-host locality properties have implications for such algorithms as ‘‘fair queuing’’ [23] and ‘‘reservation switching’’ [14]. One can also look for locality in the source-destination host pairs; this may be helpful in determining how to partition a network [18].
There is one more level in the hierarchy of network addresses: the individual process. With few exceptions, processes (or threads) are the entities actually doing communication. Host ad-dresses are simply a consequence of sharing hardware resources between several processes (and of the traditional but arbitrary address layering used in most protocol families). Often, the locality properties visible at the host-address level actually arise because of per-process network locality. Similarly, host-pair locality is often a consequence of locality in the communication between pairs of processes.
Per-process network locality is important for several reasons. Security and quality-of-service policies of network infrastructure (such as routers) might better be expressed in terms of com-municating processes rather than comcom-municating hosts [19]. Once a packet reaches its destina-tion host, the speed of delivery to the ultimate process is strongly determined by decisions such as scheduling choices that might benefit from consideration of locality. For example, if the response time for an RPC packet is less than the cost of two context switches, it would pay to let the requesting process busy-wait for the arriving packet.
This paper presents a study of network locality on the per-process level, and speculates on the implications these observations have for computer system design. Observations of typical LANs show per-process locality; that is, packets to a host usually arrive for the process that most recently sent a packet, and often with little intervening delay. The observations were made using a passive monitor on broadcast LANs, so the normal timing relationships and communications patterns were unperturbed by the act of measurement, and all systems on the network could be watched without any hardware or software modifications.
1.1. Previous work
Most previous trace-based studies that have treated network locality used an addressing granularity of networks or individual hosts. Numerous studies have looked at the long-term per-host locality or the long-term per-host-to-per-host connectivity matrix on LANs [1, 2, 9, 37] and the packet interarrival time on a per-host basis [11]. Several have examined short-term per-host or host-pair locality [10, 12, 14, 18], and at least one has looked at per-application locality [4].
Two studies on the V system did look at process-to-process characteristics. Cheriton and Williamson [8] present a frequency distribution for request-response transaction durations. Williamson [42] examined per-process locality, for the purpose of caching protocol state infor-mation. In both of these studies, the time-resolution of the transaction duration measurement did not allow inferences about possible scheduling effects.
Almost all previous studies have measured interarrival times with resolutions of milliseconds or worse. At least one previous study [17] was able to achieve a resolution of around 100 microseconds, as did the experiments reported in this paper.
Carter and Zwaenepoel designed their ‘‘optimistic blast’’ protocol assuming that per-process locality is high, and then showed that, under certain conditions, an implementation embodying this assumption was successful at improving performance [5].
2. Addressing Model
One impediment to extracting information about per-process network locality from traces of packet headers is that header addresses do not always denote specific processes. It may be necessary to guess a process identity from the contents of a packet header, which can lead to incorrect inferences about locality. Even if a packet header address can be associated with a single process, a process may be communicating under several guises at once. It may not be possible to discover that several header addresses map onto the same process.
Different protocol families have followed a variety of approaches to encoding process ad-dressing information. Some mechanisms in use are:
No process information:
Certain simple protocols, such as ARP [29] are inherently host-to-host protocols and are not addressed at a finer grain.
Explicit process identification:
Protocols designed specifically to support distributed operating systems might use explicit process identifiers in their address structure. One such protocol was the V system’s original ‘‘interkernel protocol’’ [7].
Ubiquitous ‘‘port’’ identifiers:
NETWORKLOCALITY AT THESCALE OFPROCESSES
The protocols mentioned above are consistent in that port identifiers appear in every mes-sage, no matter what higher-level protocols are involved. This makes it possible to demultiplex packets to the appropriate process before further processing.
Haphazard ‘‘port’’ identifiers:
The IP packet header [31] does not include any process-oriented identification fields. In-stead, packets are demultiplexed by a protocol-type field, and it is up to the individual protocol to define port fields. Some (such as TCP [32] and UDP [30]) do so; others (e.g., ICMP [33]) do not.
Connection identifiers:
Rather than expose the internal process addressing structure in each packet, a packet header may carry a ‘‘connection identifier’’. During connection setup, explicit process identification might be provided, at which time the host software allocates a unique iden-tifier for the connection. In subsequent packets, the connection ideniden-tifier is used by the destination host to select the receiving process. The DECNET NSP [40] protocol works this way.
The use of connection identifiers instead of port identifiers complicates, but does not preclude, the determination of per-process network locality by passive monitoring.
Transaction identifiers:
In some instances, where communication is kernel-to-kernel on behalf of process-to-process operations, packets carry no marks distinguishing the process-to-processes; NFS [35, 38] is such a case. NFS RPC packets do carry a transaction identifier, to allow matching of responses to requests. Locality may be inferred from these identifiers, but it will be un-derestimated because it is impossible to tell if two transactions are issued by the same process.
On the LANs used for the observations described in this paper, virtually all traffic is carried in IP packets. (There is some DECNET and LAT traffic, but the volume is low and the usage patterns are probably not typical of networks where DECNET and LAT are primary protocols.) Because IP follows the ‘‘haphazard’’ addressing model, the inference of process identities is complex and prone to some inaccuracy. For the purposes of this paper:
TCP:
1 The tuple (host-address, TCP-src-port, TCP-dst-port) is assumed to identify a process .
UDP packets can be segregated into NFS and non-NFS packets by noting if the distinguish NFS server port number appears in one of the addresses. Since all NFS packets are RPC packets, and there is otherwise no indication that a UDP packet is being used for RPC, all non-NFS packets are assumed to be non-RPC packets.
UDP other than NFS:
The tuple (host-address, UDP-port) is assumed to identify a process.
NFS client processes:
It is hard to map NFS operations to specific processes, because of the way that typical NFS client implementations are embedded in the kernel. One could either assume that all
1This is an approximation; the tuple could map onto several processes, since TCP connections are distinguished
NFS requests made from a host are done for a single process, overestimating locality, or one could assume that each request is made by a unique process, underestimating locality (the approach taken for this study). In either case, the transaction identifier is used to match requests and responses.
NFS server processes:
NFS servers are usually multithreaded, but since an NFS server process retains no state between transactions, the threads can be scheduled arbitrarily. Because of this, and be-cause the individual server processes on a host cannot be identified in the network pack-ets, they are treated as a single process for the purpose of inferring locality.
Other IP protocols:
Other IP protocols are ignored; they are infrequent and do not adequately identify in-dividual processes.
For the purposes of analyzing locality, two classes of objects are of interest. ‘‘Host’’ objects are simply those hosts whose IP addresses appear in a packet. ‘‘Port’’ objects, which in many cases can be viewed as individual processes, are those communication endpoints whose com-pound addresses (host addresses and port numbers) appear in a packet. These abstractions are useful, for example, in inferring if a packet arriving at a host is received by the same process that most recently sent a packet from that host. From a passive monitor, one can only say that the packet arrived for the same abstract port object, and one must then make assumptions about the mapping from port objects to processes in order to estimate actual per-process locality.
2.1. Defining locality
Computer science has long appreciated the existence of locality. Two dimensions have been identified for locality in memory hierarchies [13]:
•Temporal locality: if an item is referenced, it is likely to be referenced again soon.
•Spatial locality: if an item is referenced, nearby items are likely to be referenced
soon.
Williamson [42] points out that it is hard to find an analog of spatial locality in network ad-dresses, since the concept of ‘‘nearby’’ is hard to define. He suggests instead the use of the term
persistence to refer to the tendency for a single item, once it is referenced, to be preferentially
referenced in the future.
The notion of temporal locality in a network reference stream is slightly different from that in a memory address reference stream. Memory references occur at a more or less constant rate; thus, if a memory address exhibits persistence, it will probably also exhibit temporal locality. Network reference streams are bursty, and may include large gaps when nothing happens. It is possible, therefore, for the network activity of host to exhibit persistence (repeated references to the same process) without exhibiting temporal locality (repeated references that are close in time). For example, if one process receives two packets in a row, but with a 30-second delay between the two receptions, we might not consider the second reference to be ‘‘soon’’ with respect to the first.
NETWORKLOCALITY AT THESCALE OFPROCESSES
lines or physical pages at once, in general only one process is active on a CPU. When consider-ing cache or virtual memory locality, it is sufficient that the current reference is to a line or page that is one of many recently referenced items. When considering per-process network locality, if the current reference is to any but the currently-active process, there might not be any exploitable advantage if one is trying to avoid the costs associated with context-switching.
3. Measurement Tools
In the past, it has generally been necessary to build a special-purpose system to do high-resolution network tracing, using either special-purpose hardware [17] or off-the-shelf hardware with special-purpose software [18]. We are now in an era, at least temporarily (with the advent of high-performance workstations and before a widespread replacement of 10 Mbit/sec Ethernet with faster LANs), in which a workstation running a general-purpose operating system can be a reasonable network monitor [20].
All the experiments reported on in this paper were done using off-the-shelf workstation hardware and software, unmodified except for some improvements in clock resolution. (Similar improvements should soon be widely available.) Because standard systems are used, the experi-ments may easily be replicated.
3.1. Kernel and hardware support
The measurements presented in this paper were done using either a DECstation 3100 or a DECstation 5000/200, which have SPECmark ratings of 11.3 and 18.5, respectively [39]. The operating system used was ULTRIXversion 4.2.
The ULTRIX kernel includes a facility called the packet filter [21], which can provide user processes access to all the packets on the LAN, using the ‘‘promiscuous’’ mode of the Ethernet interface. The packet filter may be instructed to move only the headers of packets into user address space, thereby avoiding the cost of copying the entire packet. The packet filter attaches a timestamp to each packet during the interrupt handler, so timestamping is not subject to the vagaries of process scheduling.
The only changes made to the standard system were to improve timestamp resolution. The normal ULTRIXkernel maintains a time variable incremented once per clock interrupt. Since the interrupt rate is normally 256 hz, the normal resolution is about 4 msec, too coarse for accurate measurement of interarrival times on an Ethernet.
Two different approaches were used to improve resolution:
1. The Motorola MC146818 clock chip used to generate the periodic interrupt can be reprogrammed to run at a variety of clock rates, up to 8192 hz. High interrupt rates reduce the amount of CPU power available for processing packet events; 4096 hz appears to be a reasonable compromise between timestamp resolution and CPU loading.
interrupt-clock facility to generate timestamps with sub-microsecond accuracy. One such board was available for use in these experiments.
The latter approach was available only at one site. The first approach, since it requires no extra hardware, could be used at other sites. Both methods provide reasonable results; section 4.2 discusses how closely the results correspond.
3.2. The monitoring program
The heart of the experimental system is the netlocal program. The program, which runs as a user-level process, examines the headers of all the packets on the LAN, extracts the addressing information, and tracks the reference locality for each addressable object. At the end of a trace trial, the program records its results and terminates.
The program has several components:
Main program
The main program does some initialization, and then enters a loop that reads packet headers and passes them to the IP parser.
IP parser
This module parses the IP header to extract source and destination host addresses, then parses TCP and UDP headers to find port numbers. If a UDP packet is to or from the well-known NFS server port, it is parsed as an RPC packet to extract the transaction ID.
Fragment handler
IP implementations must fragment IP datagrams that are too large to transmit in one packet (a frequent case for NFS datagrams). Only the initial fragment of a datagram con-tains the port numbers. To properly analyze fragmented packets, the program records port information for initial fragments and then uses this information when subsequent frag-ments are received. Although this mechanism fails when fragfrag-ments are received out of order or lost, in general fewer than 0.1% of the fragments cannot be matched.
Object database
As new addressable objects (hosts objects and port objects) are recognized in packet headers, database records are created, entered into hash tables, and assigned compact unique identifiers (host codes and port codes). For previously-known objects, the database records are updated as appropriate. The host and port codes allow efficient cross references from host records to port records. The records contain these fields:
Port record
•Last send timestamp
•Last receive timestamp
•Last send transaction ID (for NFS RPCs)
•Last receive transaction ID (for NFS RPCs)
Host record
•Last send timestamp
•Last receive timestamp
•Last send port-code
•Last receive port-code
NETWORKLOCALITY AT THESCALE OFPROCESSES
Locality analysis
Once the appropriate database records have been found and the host and port codes for the packet determined, several different kinds of locality analysis can be done. For example, if the port code extracted from the packet matches the ‘‘last send port-code’’ in the host record, then one can infer that the packet arrived for the process that most recently sent a packet from that host. Delays are calculated from the timestamps. The full set of analyses are described in section 3.3.
Report generator
When the operator requests termination, the program generates a report containing all the counter values and a set of interarrival time histograms. The report is an ASCII file, suitable for examination or for further processing by report-graphing programs (see sec-tion 3.4).
3.3. Locality analysis
Three different classes of locality analysis are done. These classes are further subdivided into RPC (i.e., NFS) and non-RPC packets, and the RPC packets are subdivided according to whether they are to or from an NFS server. Each analysis maintains a counter of the number of events.
Events are classified according to the destination host and port of a packet:
SameDestPort
Packet went to same port as the last packet to that same host.
subset: SameDestToNFSServer
The destination port is the well-known NFS server port.
ReplyToPort
Packet went to the port that last sent a packet from the host. In other words, this packet could be a reply to the most recently transmitted packet from the host. It might also be a subsequent request following the receipt of a reply, or it might be less synchronized (such as a TCP acknowledgement).
subset: RPCReply
The packet is an RPC reply.
This does not include packets to the well-known NFS server port, since that process never receives ‘‘replies.’’
RequestToNFSServer
Like ReplyToPort, except that the destination port is the well-known NFS server port. All such packets are actually RPC requests.
TrainToPort
subset: RPCTrain
The packet is an RPC packet.
subset: TrainToNFSServer
The destination port is the well-known NFS server port.
A single packet could give rise to more than one class of event. For example, TrainToPort events are a proper subset of SameDestPort events. Some, but not all, ReplyToPort events are also SameDestPort events.
It is worth noting that because large NFS transfers almost always involve fragmentation, they generate many RPCTrain and TrainToNFSServer events.
In addition to the event counters, the netlocal program also maintains a set of histograms, all of which show event frequency as a function of some time period:
InterArrivalHist
Overall packet interarrival time.
SameDestPortHist
For SameDestPort events, time since last packet to this port.
ReplyToPortHist
For ReplyToPort events, time since last packet sent from this port.
RequestToNFSServerHist
For RequestToNFSServer events, time since last packet sent from an NFS server process on this host.
TrainToPortHist
For TrainToPort events, time since last packet to this port.
ReplyTimeHist
Time delay between last packet sent from this port and the current packet to this port, whether or not intervening packets have arrived for other ports on the same host. (Does not include packets to the NFS server port.)
NFSRequestTimeHist
Like ReplyTimeHist, but for packets destined to the NFS server port.
3.4. Report-graphing programs
NETWORKLOCALITY AT THESCALE OFPROCESSES
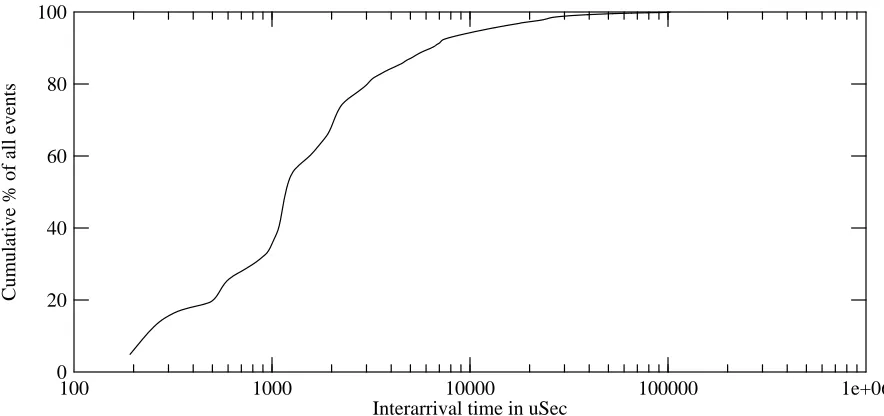
100 1000 10000 100000 1e+06
Interarrival time in uSec 0
100
20 40 60 80
[image:19.612.89.531.82.290.2]Cumulative % of all events
Figure 1: Distribution of interarrival times
4. Experiments
4.1. Environments
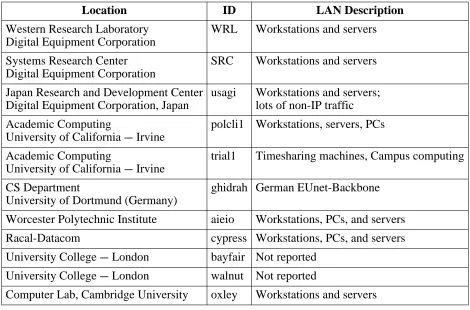
Traces of several durations were made in a variety of locations, listed in table 1. The column labeled ‘‘ID’’ shows the short name used to identify the traces in subsequent figures.
The most detailed information came from traces made at two of Digital Equipment Corporation’s research laboratories. Digital’s Western Research Laboratory (WRL) has a single Ethernet with about 80 hosts. Digital’s Systems Research Center (SRC) has several LANs con-nected via bridges; the Ethernet segment where the monitor was concon-nected has about 45 hosts. In both cases, almost all of the traffic is IP packets, and a large fraction of those are NFS packets. SRC differs from WRL in that it uses a non-IP file access protocol for the bulk of its file service; these packets do not appear on the Ethernet that was monitored. SRC has about three times as many users as WRL. Both monitored networks carry some non-IP traffic, which is not measured by netlocal but may have perturbed some of the timings.
Location ID LAN Description
Western Research Laboratory WRL Workstations and servers Digital Equipment Corporation
Systems Research Center SRC Workstations and servers Digital Equipment Corporation
Japan Research and Development Center usagi Workstations and servers; Digital Equipment Corporation, Japan lots of non-IP traffic
Academic Computing polcli1 Workstations, servers, PCs University of California --- Irvine
Academic Computing trial1 Timesharing machines, Campus computing University of California --- Irvine
CS Department ghidrah German EUnet-Backbone University of Dortmund (Germany)
Worcester Polytechnic Institute aieio Workstations, PCs, and servers
Racal-Datacom cypress Workstations, PCs, and servers
University College --- London bayfair Not reported
University College --- London walnut Not reported
[image:20.612.53.523.70.380.2]Computer Lab, Cambridge University oxley Workstations and servers
Table 1: Trace locations
4.2. Effects of different clock-resolution mechanisms
Since it was not possible to perform all the experiments using the high-resolution clock hardware, the question arises as to whether the results are skewed by the use of the sped-up interrupt clock. To check this, the two experimental setups (a DECstation 5000/200 using the interrupt clock, and a DECstation 3100 using the high-resolution clock) were simultaneously used to monitor the same LAN. Figure 2 shows that the resulting distribution of interarrival times is nearly the same. Only for the shortest measurable interarrival times do the distributions differ.
The results obtained from the low-resolution setup appear comparable in time-resolution quality to those obtained with the high-resolution clock hardware. Also, the distribution of event classifications is quite similar. The differences that do exist might be attributable to the dif-ference in CPU speeds, which causes a difdif-ference in the probability of dropping packets during bursts. The packet filter provides exact counts of dropped packets; on this test, the faster CPU dropped about 1.3% of the packets, and the slower CPU dropped about 3.9%.
NETWORKLOCALITY AT THESCALE OFPROCESSES
100 1000 10000 100000 1e+06
Interarrival time in uSec 0
100
20 40 60 80
Cumulative % of all events
High resolution clock
[image:21.612.90.531.82.292.2]Low resolution clock
Figure 2: Low- and high-resolution measurements of same data
4.3. Effects of TCP port-to-process mapping algorithm
In section 2, it was noted that while TCP connections are properly identified by the quadruple (src-host, src-port, dst-host, dst-port), the tracing software for these experiments used the triple (src-port, dst-host, dst-port) to identify end-point processes. This leads to some overestimation of locality. For example, if on two different hosts, Telnet clients of a single server host hap-pened to use the same client-port number (an unlikely event), their packets would be seen as going to a single process on that server host. In fact, the BSD Telnet daemon creates a separate process for each connection. This means that netlocal might, in rare cases, treat several Telnet daemons as if they were a single process.
On the other hand, using the TCP quadruple to identify a process leads to underestimation of locality, because in some cases a single server process may multi-thread connections from several clients. The X Window server is one such server. In these cases, the proper identifica-tion of a process is the pair (dst-host, dst-port).
5. Results: persistence
Recall that persistence is defined as the tendency for a single process, once it interacts with the network, to be the next recipient of an arriving packet.
The locality statistics measured in the experiments (table 2 shows several representative trials) show that per-process locality (as inferred from per-port locality) is quite high. Almost three quarters of the packets arriving at a host arrive for the same port as their predecessors (SameDestPort). Nearly half arrive for the port that last sent a packet from that host (ReplyToPort).
WRL: 1 hour WRL: 24 hours SRC: 1 hour SRC: 24 hours
Packets examined 831512 27049045 2074406 27392236
Packets dropped 22303 2464773 475 209079
(2.7%) (9.1%) (<0.1%) (0.8%)
RPC packets 468865 19319655 1000867 17904448
(56%) (71%) (48%) (65%)
Packets to NFS Server 209838 5135500 439406 8208860
(25%) (19%) (21%) (30%)
Hosts known 274 660 186 502
Ports known 9269 131324 2279 27444
SameDestPort 63% 70% 76% 65%
SameDestToNFSServer 23% 17% 20% 28%
ReplyToPort 39% 22% 39% 42%
RPCReply 19% 10% 16% 22%
RequestToNFSServer 13% 10% 15% 20%
TrainToPort 34% 49% 38% 28%
RPCTrain 9% 33% 8% 10%
[image:22.612.70.506.211.533.2]TrainToNFSServer 10% 7% 5% 8%
Table 2: Summary of trials: persistence
NETWORKLOCALITY AT THESCALE OFPROCESSES
WRL WRL SRC SRC
1 hour 24 hours 1 hour 24 hours
RPCReply 33% 13% 33% 34%
RPCTrain 16% 47% 17% 16%
Table 3: Persistence for RPC packets only
WRL WRL SRC SRC
1 hour 24 hours 1 hour 24 hours
SameDestToNFSServer 91% 91% 94% 93%
RequestToNFSServer 52% 39% 23% 26%
[image:23.612.175.478.67.276.2]TrainToNFSServer 41% 53% 72% 67%
Table 4: Persistence for packets to NFS server only
5.1. Variation between trials
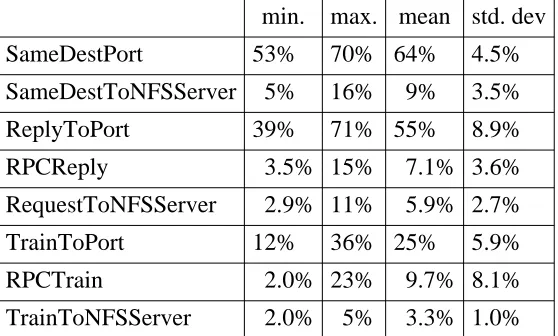
There is some variation between different trials at a given site; an additional experiment was conducted to measure this variation. These traces were made during various prime-time hours over a two-day period. Table 5 shows the results for 16 1-hour trials at WRL; entries in the table give the fraction of packets in each category. Although SameDestPort and ReplyToPort statis-tics vary somewhat from trial to trail, in general these locality measures remain fairly high.
The NFS-related measures show more variation, especially in the ratio of standard deviation to mean. This indicates that there are significant short-term variations not only in the amount of NFS traffic, but in its locality statistics. (The high variation in NFS locality persists even when each count is normalized to the amount of NFS traffic in its respective trace.)
min. max. mean std. dev
SameDestPort 53% 70% 64% 4.5%
SameDestToNFSServer 5% 16% 9% 3.5%
ReplyToPort 39% 71% 55% 8.9%
RPCReply 3.5% 15% 7.1% 3.6%
RequestToNFSServer 2.9% 11% 5.9% 2.7%
TrainToPort 12% 36% 25% 5.9%
RPCTrain 2.0% 23% 9.7% 8.1%
[image:23.612.186.465.475.643.2]TrainToNFSServer 2.0% 5% 3.3% 1.0%
5.2. Distribution of packets among processes
It is also interesting to look at the distribution of packets among processes. Figure 3 shows, for a 1-hour trace at WRL, how many processes were found to receive a particular number of packets. By far the most frequent case was one packet (or a few packets) received per process. This probably reflects the use of UDP packets to do Domain Name System (DNS) hostname-to-address translations, because each such transaction (in the implementation used at WRL) uses a different UDP port on the client side. Since some programs do several name translations, this results in underestimation of locality. Even so, the mean number of packets received per ‘‘process’’ is about 37, partly because 91 processes received more than 1000 packets apiece.
Note that in this plot, all the NFS packets to and from a given client host are assumed to reflect a single process, since all NFS client RPCs are done using a fixed UDP port number; the numbers would be tremendously skewed to the left side of the graph if each NFS transaction were treated as a distinct process. Since actual NFS client implementations use a small number (typically under 10) of processes, the approximation used here is a more reasonable reflection of reality than the other extreme.
The processes that receive the most packets are primarily NFS and DNS servers, although some NFS clients also receive lots of packets.
0.1 1 10 100 1000 10000 100000 Packets counted per process
0.1 100000
1 10 100 1000 10000
Number of processs
[image:24.612.59.497.362.566.2]Mean 36.8
Figure 3: Distribution of packet arrivals among processes
5.3. Results from other locations
Traces from other sites were analyzed in order to discover if the high persistence measured at WRL and SRC arose from some peculiar aspect of the environment. The results are summarized in tables 6 and 7. The mean values are all close to those in table 5, although the frequency of
ReplyToPort events at WRL seems to vary more widely than at some other sites. Note that
NETWORKLOCALITY AT THESCALE OFPROCESSES
min. max. mean std. dev
SameDestPort 49% 98% 69% 9.9%
ReplyToPort 24% 67% 46% 10%
[image:25.612.218.434.70.148.2]TrainToPort 12% 51% 27% 8.4%
Table 6: Variation between trials at 10 sites (51 trials; 1-hour traces)
min. max. mean std. dev
SameDestPort 52% 86% 71% 8.8%
ReplyToPort 31% 60% 45% 7.4%
[image:25.612.216.437.178.255.2]TrainToPort 21% 43% 30% 5.5%
Table 7: Variation between trials at 5 sites (37 trials; 24-hour traces)
Site identifier n, n,
1-hr trials 24-hr trials
aieio 1
bayfair 1
cypress 3 3
ghidrah 5 6
oxley 2
polcli1 15 12
wrl 6 3
trial1 13 13
usagi 4
walnut 1
Table 8: Number of trials at each site, tables 6 and 7 and figure 4
Figure 4 shows the variation in the persistence between sites. For each class of locality event, the point plotted represents the mean value across all trials for the specified site. Values are plotted for both 1-hour and 24-hour trials; at some sites, only 1-hour trials were available.
5.4. Summary and related work
The high persistence observed in these experiments is encouraging, because it suggests that taking advantage of per-process persistence should improve performance. Indeed, several ex-perimental implementations have shown that it does.
[image:25.612.223.427.287.505.2]0 4 0 100 20 40 60 80
Mean percentage of all events
[image:26.612.59.491.104.288.2]SameDestPort
1hr
24hr
aieio bayfair walnut polcli1 wrl cypress oxley ghidrah trial1 usagi ghidrah polcli1 wrl cypress trial1ReplyToPort
1hr
24hr
aieio bayfair walnut polcli1 wrl cypress oxley ghidrah trial1 usagi ghidrah polcli1 wrl cypress trial1TrainToPort
1hr
24hr
aieio bayfair walnut polcli1 wrl cypress oxley ghidrah trial1 usagi ghidrah polcli1 wrl cypress trial1Figure 4: Site-to-site variation in mean persistence
that the subsequent packets will be the rest of the same blast, and directs them into the address space of the receiving process. After the packets have been received, the kernel then checks that they were indeed the correct packets and in the correct order, and patches things up if this is not so. Clearly, this approach is worthwhile only if persistence is high, and their measurements showed that indeed few blasts were interrupted by extraneous packets.
When an operating system multiplexes incoming packets to a variety of recipients, one of the more expensive operations is to look up the recipient based on the packet header. In the ‘‘4.3BSD-Reno’’ operating system, a one-behind cache is used to record the most recent destina-tion port for arriving UDP packets; this averts many lookup operadestina-tions through SameDestPort locality. Partridge and Pink [28] have shown that an additional one-behind cache, tracking the most recent UDP source port and therefore taking advantage of ReplyToPort locality, can also improve UDP performance. Their results show that this increases the effective cache hit rate by about 50%, since it averts lookups in about 70% of the cases not caught by the cache of the most recent destination port.
NETWORKLOCALITY AT THESCALE OFPROCESSES
6. Results: temporal locality
Recall that temporal locality is defined as the tendency for a process, once it interacts with the network, to receive a packet ‘‘soon.’’ This section presents results that provide insight into tem-poral locality, and in particular that show how soon certain kinds of events occur after their precursors.
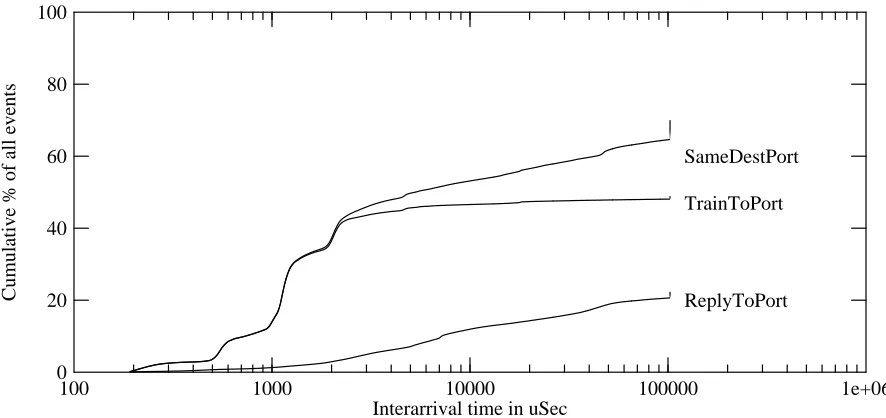
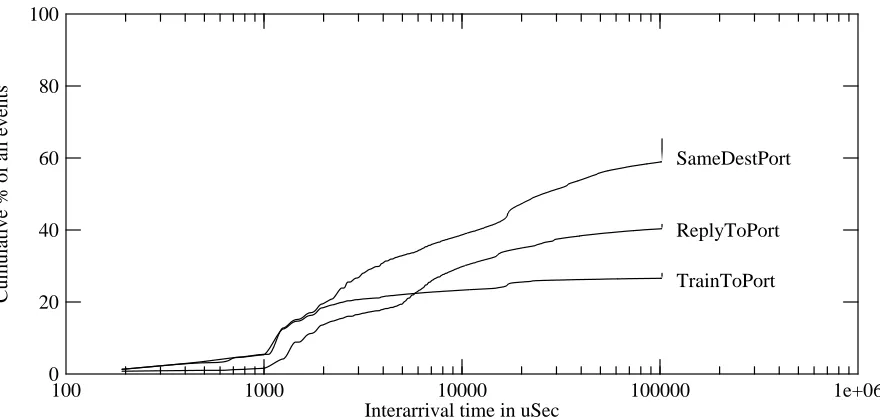
The cumulative distributions generated by the netlocal program provide an overall picture of the waiting time for various events. Figure 5 shows the SameDestPortHist and
ReplyToPortHist for the 24-hour trace at WRL (second column in table 2). The vertical axis
shows the cumulative fraction of all packet arrivals, not the cumulative fraction of the event plotted, so the curves do not end at 100%. The vertical spikes at the right ends of the curve represent the counts for all delays of 100 msec or more (i.e., all the data is represented in the curve, but the details of the distribution of longer delays are not shown). Figure 6 shows the analogous information for the 24-hour trial at SRC (fourth column in table 2).
100 1000 10000 100000 1e+06
Interarrival time in uSec 0
100
20 40 60 80
Cumulative % of all events
SameDestPort
[image:27.612.89.532.290.499.2]ReplyToPort TrainToPort
Figure 5: Temporal locality of reference at WRL
One can see from figures 5 and 6 that about 20% of the SameDestPort packets arrive within a millisecond or two of the preceding packet; there is a steep step in the distribution at this point. In fact, the graphs make clear that virtually all of the SameDestPort events at intervals below 2 msec are actually TrainToPort events. The step increment at about 1.2 msec is because this is the transmission duration of a maximal Ethernet packet, and packet trains of several maximal-length packets are often generated by NFS. Few TrainToPort events occur at longer intervals.
In figure 5, half of the SameDestPort events arrive within 2 msec; the median for figure 6 is 4.5 msec. In contrast, ReplyToPort events exhibit generally longer delays. The median for
ReplyToPort is 8 msec in figure 5 and 5 msec in figure 6, and the average delays are also higher
100 1000 10000 100000 1e+06 Interarrival time in uSec
0 100
20 40 60 80
Cumulative % of all events
SameDestPort
[image:28.612.57.497.81.291.2]ReplyToPort TrainToPort
Figure 6: Temporal locality of reference at SRC
Figure 7 shows how temporal locality varies between the sites listed in table 1. The graphs show the mean arrival times, as well as the maximum and minimum values. Again, since some sites contributed more trials than others, the mean value may be somewhat skewed. The ‘‘stair-steps’’ in the minimal-value graph for ReplyToPort are due to quantization error; the traces with the least locality were made using a clock resolution of 4 msec. The waves in the mean-value curves are due to the use of different clock resolutions in different trials: some points on these curves are averaged over a smaller set of trials than other points, and so the average of cumula-tive values at one curve point may be less than the average at its predecessor.
The mean values in figure 7 are quite similar to those shown in figure 6. The extreme values vary considerably from the mean; some sites evidently experience much more or much less tem-poral locality.
6.1. Dallying to exploit temporal locality
The possibilities for exploitation of per-process temporal locality are less clear-cut than those for exploitation of persistence. The hypothesis that inspired these experiments was that it would pay to modify an operating system’s scheduling algorithm to ‘‘dally’’ (busy-wait) a process that starts waiting for network input, rather than to switch immediately to another runnable process, because the cost of context-switching might be greater than the time wasted dallying. This mechanism was first described by Ousterhout [26], who called it ‘‘pausing.’’ The results presented in figures 5 and 6 are equivocal: while it is certainly true that some replies arrive within a very short interval, most do not.
NETWORKLOCALITY AT THESCALE OFPROCESSES
100 1000 10000 100000 1e+06
SameDestPort interarrival time in uSec 0
100
20 40 60 80
Cumulative % of all events
Minimum Mean Maximum
100 1000 10000 100000 1e+06
TrainToPort interarrival time in uSec 0
100
20 40 60 80
Cumulative % of all events
Minimum Mean Maximum
100 1000 10000 100000 1e+06
ReplyToPort interarrival time in uSec 0
100
20 40 60 80
Cumulative % of all events
[image:29.612.90.537.49.681.2]Minimum Mean Maximum
If one is purely concerned with balancing context switch costs against dallying costs, the evidence suggests that dallying does not pay off, because most arrivals are delayed by much more than 1 msec, and modern systems can easily do several context switches in under 1 msec. Context-switching performance is not improving as fast as many other aspects of CPU performance [22, 27], so this tradeoff may change in favor of dallying with the advent of sub-stantially faster networks and hosts.
If one is concerned with minimizing the best-case delay, however, dallying might pay off. Since processes are commonly rescheduled at intervals on the order of 10 msec, and more than half of the SameDestPort packets arrive within 10 msec of their predecessors, it seems perfectly reasonable to allow a process to soak up CPU cycles for the remainder of its scheduling alloca-tion while waiting for a packet. The process could even arrange to do some useful work during this interval, if the system provides a mechanism for efficient polling for packet arrivals.
In current systems, if a process tries to receive a packet that has not already arrived (the usual case in a request-response interaction), and if another process is runnable, the receiving process will not run again for many milliseconds, even if the packet arrives within a few microseconds. This tends to limit network performance on multiprogrammed systems.
If the kernel could estimate which packet reception attempts are likely to succeed quickly, either by some sort of static analysis or by keeping historical information, then it could dally only when dallying had a high chance of paying off. This would complicate the kernel, and slightly increase the cost of a network-related context switch, but might eliminate a lot of context switches without wasting many CPU cycles on busy-waiting. In the best case, where both parties to a network interaction were using dallying, communication delays could decrease dramatically.
An analogous situation arises in the choice of multiprocessor locking algorithms. Blocking locks may cause excess context switching, and spin locks may waste useful CPU cycles. Karlin
et al. have shown that adaptive algorithms, which use previous history to estimate the lock-wait
duration and perform spin-locks when this estimate is small, can perform better than the always-block and always-spin algorithms [15].
6.2. Simulation of infinite-speed networks
One possible explanation for the relatively long delays observed in figures 5 and 6 is that the LAN is too slow. Since it takes over a millisecond to send a maximal-length Ethernet packet, and a well-designed bulk-data protocol will try to use maximal-length packets, it is not surprising that many interactions take longer than a millisecond. Perhaps on a faster LAN, such as FDDI at 100 Mbit/sec, or at future LANs with gigabit rates, the total latency will be sufficiently reduced to make dallying profitable.
NETWORKLOCALITY AT THESCALE OFPROCESSES
Figure 8 shows the results of this simulation, for a 1-hour trace made at WRL. The solid curves show the simulated latencies on a infinite-speed LAN; the dotted curves show the actual latencies on an Ethernet. All curves were derived from the same trace data. The average Ether-net load during the trace was 7.5%, although it was probably a lot higher for brief intervals during the trace.
1 10 100 1000 10000 100000 1e+06
Interarrival time in uSec 0
100
20 40 60 80
Cumulative % of all events
SameDestPort
TrainToPort ReplyToPort
[image:31.612.92.533.159.369.2]Infinite-speed LAN 10 mbit/sec LAN
Figure 8: Latencies for simulated infinite-speed LAN
Figure 8 shows that improving LAN latency would have almost no effect on ReplyToPort latency. One can assume that Ethernet queueing delays, not corrected for by the simulation, are not to blame for the lack of ReplyToPort improvement, since there is observed improvement in the SameDestPort curve. In fact, eliminating LAN latency means that 30% of the
SameDestPort events follow the preceding packet by less than 250 usec. Nearly all of these
short-delay events are actually TrainToPort events; that is, packet trains are causing packets to arrive back-to-back.
6.3. Simulation of latency-sensitive scheduling
Exploitation of temporal locality through dallying has two prerequisites. Not only must a sig-nificant fraction of packets arrive within a short waiting period, but it must be possible for the scheduler to predict when a wait will indeed be short. The necessary prediction accuracy in-creases as the fraction of short-wait packets dein-creases, if one does not want to waste cycles wait-ing for packets that will not arrive quickly.
Wait-prediction could be implemented as part of the scheduling function of the operating sys-tem. A good wait-prediction algorithm must be accurate: if it underestimates waiting time, then excess busy-waiting will occur, but if it overestimates waiting time, then too few context switches will be avoided. The wait-prediction algorithm must also be inexpensive.
Although it was impractical to modify a kernel to schedule processes based on an estimate of rapid network response, it was easy to modify the tracing tool to measure the success rate of several modified wait-prediction algorithms. The per-port records were augmented with these fields:
•Last packet arrived ‘‘quickly’’ after preceding event
•Number of ‘‘quick’’ arrivals
•Number of ‘‘slow’’ arrivals
•Time interval between last two preceding events
•Adaptive threshold value (used in RandomWalk algorithm, described below)
The definitions of ‘‘quick’’ and ‘‘slow’’ are parameters chosen to provide the best possible es-timates of future performance.
Several wait-prediction algorithms were tested, varying in how they decide whether to ‘‘dally’’ when waiting for an input packet.
Always
Dallying is always done.
LastQuick
Dally if the preceding packet (for this port) arrived quickly.
MoreQuick
Dally if more than 50% of prior packets (for this port) arrived quickly.
LastOrMore
Dally if the last packet was quick, or more than 50% have been quick.
LastAndMore
Dally if the last packet was quick, and more than 50% have been quick.
RandomWalk
Like LastQuick, but adjust per-port threshold down by 25% on failures and up by 25% on successes (‘‘success’’ means that the packet delay was less than the threshold). The idea is to be more willing to dally if dallying has paid off in the past. This is based on a similar algorithm in [15].
NETWORKLOCALITY AT THESCALE OFPROCESSES
In order to avoid confusion from variations between traces, a trace was stored in a disk file 2
and then processed off-line . The trace was simulated using each of the five wait-prediction algorithms, and each of five values for the ‘‘quickness’ parameter Q: 500 usec, 1 msec, 2.5 msec, 5 msec, and 10 msec. Figures 9 and 10 show the results for SameDestPort and ReplyToPort packets, respectively. The marks on the vertical lines show the 10th, 20th, 30th, 40th, and 50th percentile interarrival times for each combination of algorithm and Q. (For certain combina-tions, some percentile points lie off scale. If a vertical line is missing, less than 10% of the packets for that combination arrived within 20 msec.)
200 1000 10000 50000
Quickness parameter (microseconds) 100
20000
1000 10000
Interarrival time (microseconds) Always Q = 500 Q = 1000 Q = 2500 Q = 5000 Q = 10000
[image:33.612.82.533.205.411.2]LastQuick MoreQuick LastOrMore LastAndMore RandomWalk
Figure 9: SameDestPort results for wait-prediction
For example, in figure 9 there is a group of five vertical lines for Q = 1000 usec (1 msec). The left-most of these lines, marked with triangles, shows the results for the LastQuick algorithm. The lowest triangle indicates that in the cases where this algorithm suggests dallying, 10 per cent of these packets will arrive within 256 usec. The highest triangle says that 50 percent of these packets will arrive within 2.4 msec.
Figures 9 and 10 imply that based on the interarrival times for those packet-reception events where the simulated scheduler decided to dally, the best results come with Q = 500 usec and the
LastQuick or LastOrMore algorithm if the process has just received a packet (SameDestPort),
or the MoreQuick or LastAndMore algorithm if the process has just sent a packet (ReplyToPort). These combinations of algorithm and Q lead to a high percentage of quick arrivals when they choose to dally.
One way to interpret these results is that when predicting short-wait SameDestPort events, information about the last waiting time is most important. When predicting short-wait
ReplyToPort events, information about the relative distribution of past waiting times is
impor-tant.
200 1000 10000 50000 Quickness parameter (microseconds)
100 20000
1000 10000
Interarrival time (microseconds) Always Q = 500 Q = 1000 Q = 2500 Q = 5000 Q = 10000
[image:34.612.59.495.83.293.2]LastQuick MoreQuick LastOrMore LastAndMore RandomWalk
Figure 10: ReplyToPort results for wait-prediction
Because figures 9 and 10 do not show how frequently dallying is done, they do not show whether it is useful. Unless dallying can be done relatively often, it is not worth the extra com-plexity. Figures 11 and 12 show how many packet events correspond to each point plotted in figures 9 and 10, respectively. (The trace contained a total of about 500,000 events.)
200 1000 10000 50000
Quickness parameter (microseconds) 10
1e+06
100 1000 10000 100000
Packets counted (out of 506048)
Figure 11: Packet counts corresponding to figure 9
[image:34.612.61.495.412.623.2]NETWORKLOCALITY AT THESCALE OFPROCESSES
200 1000 10000 50000
Quickness parameter (microseconds) 10
1e+06
100 1000 10000 100000
[image:35.612.90.530.84.294.2]Packets counted (out of 506048)
Figure 12: Packet counts corresponding to figure 10
3
packets . The highest triangle, the 50th percentile (which figure 9 says will arrive within 2.4 msec), includes about 35000 packets.
From 10 one sees that the apparent good performance for Q = 500 usec and the MoreQuick algorithm is nearly useless, because almost no packets meet these criteria. To include a reason-able fraction of packets, Q must be on the order of 2.5 msec. With that Q, the LastAndMore algorithm seems to be best. Even in this case, it is not clear that a sufficient fraction of dallied-for packets would arrive within a sufficiently small interval to make dallying worthwhile. Note, however, that the ascription of each NFS transaction to a unique process skews these results, because most of these ‘‘processes’’ receive only one packet. Therefore, none of the simulated wait-prediction algorithms dally for these transactions, even though many of them are quite rapid.
6.4. Other approaches to wait-prediction
A reviewer of this paper pointed out that a wait-prediction algorithm based on round-trip time (RTT) estimation might perform better than the ones considered in these experiments. RTT es-timators are commonly used in transport protocols in order to decide how long to wait before retransmitting unacknowledged data. Because RTT requires more computation it may be more expensive than the simpler algorithms considered here. More important, accurate estimation of RTT, even for protocols where the receiver generates replies more or less instantaneously, is not easy [16]. Nowicki [25] has shown that in order to obtain accurate RTT values for NFS, it is necessary to maintain separate estimates for read, write, and other operations. (NFS RPCs are
3This point would be about 6900, or 10 per cent of the total number of SameDestPort events in this trace, but
entirely synchronous, so responses to write RPCs are normally delayed for several disk-accesses.)
RTT estimators used for wait-prediction will have to be tuned differently from those used for retransmissions, since the consequences of a mistaken prediction are different. When deciding whether or not to retransmit, one must avoid underestimating the RTT, since doing so would cause unnecessary retransmissions. When deciding whether or not to busy-wait, one should avoid overestimating the RTT, since doing so would cause unnecessary context switches.
A more promising approach would be to incorporate protocol semantics into the wait-prediction algorithm. A simple heuristic would be to calculate the minimum round-trip delay based on the length of the outgoing packet, and perhaps the anticipated length of the incoming packet. If either packet were long, then it would be impossible for the response to arrive within a short interval.
It might also be possible to provide a mechanism for user processes (which may know much more about their communications patterns than can be inferred by the kernel) to indicate when waiting for a packet whether to dally or not. For example, an RPC call to release a file lock should return promptly, and would be a candidate for dallying; an RPC call to write data to the server disk would not be. Semantic hints from user processes might also enable the scheduler to maintain a set of useful RTT estimates, which in turn could be used to predict waiting times.
7. Future Work
Many additional experiments could be performed to investigate per-process network locality. First, it would be useful to run the same kind of experiments at a wider variety of sites. Different sites have different traffic patterns, and it is quite possible that the sites listed in table 1 are atypical.
It should not be difficult to extend the netlocal program to analyze protocol families other than IP. It would be interesting to observe the traffic patterns on LANs where DECNET or PC-oriented protocols are dominant, or those of a modern distributed system, such as V or Sprite [24].
Because the pessimistic method used to ascribe NFS transactions to processes deflates the temporal-locality results, an experiment should be done to correct for this. It should be possible to extract additional identifying information from the NFS headers (such as file handles). One could obtain a best-case bound on NFS temporal locality by assuming that only one process on each host participated in NFS transactions; for workstation-style hosts, this might be close to the actual situation.
NETWORKLOCALITY AT THESCALE OFPROCESSES
8. Summary
The experiments described in this paper show that it is feasible to obtain measurements of per-process network locality on a local area network, using commonly available workstations. The methodology can and should be applied to a wider variety of network protocols and environ-ments.
These experiments show that per-process network locality is an important characteristic of LAN packet traffic.
•Persistence is quite high: a significant fraction of received packets go to the process that most recently sent or received a packet.
•A lot of temporal locality is available on the scale of a few milliseconds. Minor changes to system software, or advances in LAN and host technology, may improve the time scale enough to justify changes in the way processes are scheduled.
Exploitation of these forms of locality may be helpful, or even necessary, in providing high-performance, low-latency network implementations.
9. Acknowledgements
I would like to thank the following people for their help in obtaining traces: Lance Berc of Digital’s Systems Research Center; Hitoshi Doi of Digital’s Japan Research and Development Center; Mike Iglesias of the University of California --- Irvine; Marc Sheldon of the University of Dortmund; Don Dossa of Digital and Worcester Polytechnic Institute; Peter Schow of Racal-Datacom; Ian Wakeman of University College --- London; and Martyn Johnson of Cambridge University. More additional people than I could list volunteered to help with my experiments; I thank them for their offers.
I would like to thank Tony Waitz and Russell Nakano for providing the high-resolution clock hardware. I would also like to thank Lance Berc, Brad Chen, Peter Danzig, Mary Jo Doherty, Mark McAuliffe, John Ousterhout, and Craig Partridge for their perceptive comments on drafts of this paper.
References
[1] Paul D. Amer. A Measurement Center for the NBS Local Area Computer Center. IEEE
Transactions on Computers C-31(8):723-729, August, 1982.
[2] P. Amer, R. Kumar, R. Kao, J. Phillips, L. Cassel. Local Area Broadcast Network Measurement: Traffic Characterization. In Proc. Spring COMPCON, pages 64-70. IEEE Com-puter Society, San Francisco, CA, 1987.
[3] David R. Boggs, John F. Shoch, Edward A. Taft, and Robert M. Metcalfe. Pup: An internetwork architecture. IEEE Transactions On Communications COM-28(4):612-624, April, 1980.
[4] Ramon Caceres, Peter B. Danzig, Sugih Jamin, Danny J. Mitzel. Characteristics of In-dividual Application Conversations in TCP/IP Wide-Area Internetworks. In Proc. SIGCOMM
[5] John B. Carter and Willy Zwaenepoel. Optimistic Implementation of Bulk Data Transfer Protocols. In Proc. 1989 SIGMETRICS Conf., pages 61-69. Berkeley, California, May, 1989.
[6] David Cheriton. VMTP Protocol Specification. RFC 1045, Network Information Center, SRI International, February, 1988.
[7] David R. Cheriton and Willy Zwaenepoel. The distributed V kernel and its performance for diskless workstations. In Proc. 9th Symposium on Operating Systems Principles, pages 129-140. October, 1983.
[8] David R. Cheriton and Carey L. Williamson. Network Measurement of the VMTP Request-Response Protocol in the V Distributed System. In Proc. 1987 SIGMETRICS Conf., pages 128-140. Banff, Alberta, October, 1987.
[9] David C. Feldmeier. Traffic Measurements on a Token Ring Network. In Proc. 1986
Computer Networking Symposium, pages 236-243. Washington, DC, November, 1986.
[10] David C. Feldmeier. Improving Gateway Performance with a Routing-Table Cache. In
Proc. IEEE InfoCom ’88, pages 298-307. New Orleans, March, 1988.
[11] Riccardo Gusella. The Analysis of Diskless Workstation Traffic on an Ethernet. Tech-nical Report UCB/CSD 87/379, Department of Electrical Engineering and Computer Science, University of California -- Berkeley, November, 1987.
[12] Steven A. Heimlich. Traffic Characterization of the NFSNET National Backbone. In
Proc. Winter 1990 USENIX Conference, pages 207-227. Washington, DC, January, 1990.
[13] John L. Hennessy and David A. Patterson. Computer Architecture: A Quantitative
Approach. Morgan Kaufmann, San Mateo, CA, 1990.
[14] Raj Jain and Shawn Routhier. Packet Trains: Measurements and a New Model for Com-puter Network Traffic. IEEE Journal on Selected Areas in Communication SAC-4(6):986-995, September, 1986.
[15] Anna R. Karlin, Kai Li, Mark S. Manasse, and Susan Owicki. Empirical Studies of Com-petitive Spinning for Shared-Memory Multiprocessors. In Proc. 13th Symposium on Operating
Systems Principles, pages 41-55. Pacific Grove, CA, October, 1991.
[16] Phil Karn and Craig Partridge. Improving Round-Trip Time Estimates in Reliable Trans-port Protocols. In Proc. SIGCOMM ’87 Workshop on Frontiers in Computer Communications
Technology, pages 2-7. Stowe, VT, August, 1987.
[17] Will E. Leland and Daniel V. Wilson. High Time-Resolution Measurement and Analysis of LAN Traffic: Implications for LAN Interconnection. In Proc. IEEE InfoCom ’91, pages 1360-1366. Bal Harbour, Florida, April, 1991.
[18] Mark J. Lorence and M. Satyanarayanan. IPwatch: A Tool for Monitoring Network Locality. Operating Systems Review 24(1):58-80, January, 1990.
[19] Jeffrey C. Mogul. Simple and Flexible Datagram Access Controls for Unix-based Gateways. In Proc. Summer 1989 USENIX Conference, pages 203-221. Baltimore, MD, June, 1989.
[20] Jeffrey C. Mogul. Efficient Use Of Workstations for Passive Monitoring of Local Area Networks. In Proc. SIGCOMM ’90 Symposium on Communications Architectures and
NETWORKLOCALITY AT THESCALE OFPROCESSES
[21] Jeffrey C. Mogul, Richard F. Rashid, Michael J. Accetta. The Packet Filter: An Efficient Mechanism for User-Level Network Code. In Proc. 11th Symposium on Operating Systems
Principles, pages 39-51. Austin, Texas, November, 1987.
[22] Jeffrey C. Mogul and Anita Borg. The Effect of Context Switches on Cache Perfor-mance. In Proc. 4th International Conference on Architectural Support for Programming
Lan-guages and Operating Systems, pages 75-84. Santa Clara, CA, April, 1991.
[23] John Nagle. On Packet Switches With Infinite Storage. IEEE Transactions on
Communications COM-35(4):435-438, April, 1987.
[24] Michael N. Nelson, Brent B. Welch, and John K. Ousterhout. Caching in the Sprite Net-work File System. ACM Transactions on Computer Systems 6(1):134-154, February, 1988.
[25] Bill Nowicki. Transport Issues in the Network File System. Computer Communication
Review 19(2):16-20, April, 1989.
[26] John K. Ousterhout. Scheduling Techniques for Concurrent Systems. In Proc. 3rd
Inter-national Conference on Distributed Computing Systems, pages 22-30. October, 1982.
[27] John Ousterhout. Why Aren’t Operating Systems Getting Faster As Fast as Hardware? In Proc. Summer 1990 USENIX Conference, pages 247-256. Anaheim, CA, June, 1990.
[28] Craig Partridge and Stephen Pink. A Faster UDP. In Proc. 2nd MultiG Workshop, pages 57-64. Stockholm, June, 1991. Submitted to IEEE Transactions on Communications.
[29] David Plummer. An Ethernet Address Resolution Protocol. RFC 826, Network Infor-mation Center, SRI International, September, 1982.
[30] Jon B. Postel. User Datagram Protocol. RFC 768, Network Information Center, SRI International, August, 1980.
[31] Jon B. Postel. Internet Protocol. RFC 791, Network Information Center, SRI Inter-national, September, 1981.
[32] Jon B. Postel. Transmission Control Protocol. RFC 793, Network Information Center, SRI International, September, 1981.
[33] Jon B. Postel. Internet Control Message Protocol. RFC 792, Network Information Cen-ter, SRI International, September, 1981.
[34] Richard F. Rashid and George G. Robertson. Accent: A communication oriented net-work operating system kernel. In Proc. 8th Symposium on Operating Systems Principles, pages 64-75. December, 1981.
[35] Sun Microsystems, Inc. RPC: Remote Procedure Call Protocol specification version 2. RFC 1057, Network Information Center, SRI International, June, 1988.
[36] Michael D. Schroeder, Andrew D. Birrell, Michael Burrows, Hal Murray, Roger M. Needham, Thomas L. Rodeheffer, Edwin H. Satterthwaite, and Charles P. Thacker.
Autonet: a High-speed, Self-configuring Local Area Network Using Point-to-point Links.
Research Report 59, Digital Equipment Corporation Systems Research Center, April, 1990.
[37] John F. Shoch and Jon A. Hupp. Measured Performance of an Ethernet Local Network.
[38] Sun Microsystems, Inc. NFS: Network File System Protocol specification. RFC 1094, Network Information Center, SRI International, March, 1989.
[39] Systems Performance Evaluation Cooperative. Newsletter, Volume 2, Issue 1. 1990.
[40] Andrew S. Tanenbaum. Computer Networks. Prentice-Hall, Englewood Cliffs, NJ, 1981.
[41] Anthony A. Waitz. PMAX microSecond Clock. 1990. Unpublished design document.
[42] Carey L. Williamson. Dynamic Transport-Level Connection Management in a Dis-tributed System. In Proc. 14th Conf. on Local Computer Networks, pages 315-322. Min-neapolis, October, 1989.