6153
Introduction
A major issue in development is how an apparently homogeneous population of precursor cells gives rise to a large and diverse array of differentiated progeny. This diversity is particularly evident in the embryonic neural crest (NC), which gives rise to cells of the peripheral nervous system, many mesenchymal cell types in the craniofacial region, and skin melanocytes (Le Douarin and Kalcheim, 1999). NC cells are induced within the developing neural tube (NT), and migrate into the embryo to develop into their differentiated progeny.
A number of experimental approaches have been used to address the question of when and where cell fate decision is made in the NC. The classic experiments from Le Douarin and co-workers employed grafting of neural primordium between quail and chicken (Le Douarin and Kalcheim, 1999), and tracing the quail NC cells throughout the embryo. Cells derived from any region of the NT could generate most NC derivatives, supporting the idea that fate is decided where the cells migrate. However, certain restrictions in developmental potential applied; for example, trunk NC was unable to give rise to the mesenchymal derivatives of the head.
In vitro studies have followed the progeny of single NC cells in clones (Le Douarin and Kalcheim, 1999). Some studies find a very heterogeneous mixture of clones, including some with many different NC cell types, and have been interpreted to support the existence of multipotential NC cells that become progressively fate restricted (Dupin et al., 1998; Sieber-Blum and Cohen, 1980; Stemple and Anderson, 1992). Other studies
find that almost half the clones are of a single phenotype and support an argument for distinct NC lineages that diverge before or soon after crest cells emerge from the neural tube (Henion and Weston, 1997; Luo et al., 2003). Where these studies may reveal the potential of NC cells under different environmental conditions in vitro, this may be different from the normal developmental fate of the cell in vivo, termed specification (Dorsky et al., 2000).
The fates of individual dorsal NT cells have also been followed in vivo. Individual cells gave rise to one, two or more different NC cell types, as well as to NT cells, which suggests there is a considerable heterogeneity within NC cells as they emerge from the NT, with some cells multipotential and others committed to a particular fate (Le Douarin and Kalcheim, 1999). These studies were generally similar through tetrapods (Bronner-Fraser and Fraser, 1989; Bronner-Fraser and Fraser, 1988; Collazo et al., 1993; Frank and Sanes, 1991; Serbedzija et al., 1994). The exception is the zebrafish, a teleost, where similar experiments showed that most NC cells differentiated into only one cell type (Raible and Eisen, 1994; Schilling and Kimmel, 1994). Whether this difference is related to the marked differences between teleost and tetrapod neurulation and NC development is unknown.
For melanocytes, in vitro clonal analyses provide evidence for the progressive restriction of cell fate from a multipotent NC stem cell to a glial-melanocyte progenitor, then a melanocyte (Dupin and Le Douarin, 2003). Alternatively, there is mounting evidence that melanocytes are specified very early. We showed that a subpopulation of trunk NC cells begin to Neural crest (NC) cells arise in the dorsal neural tube (NT)
and migrate into the embryo to develop into many different cell types. A major unresolved question is when and how the fate of NC cells is decided. There is widespread evidence for multipotential NC cells, whose fates are decided during or after migration. There is also some evidence that the NC is already divided into subpopulations of discrete precursors within the NT. We have investigated this question in the mouse embryo. We find that a subpopulation of cells on the most dorsomedial aspect of the NT express the receptor tyrosine kinase Kit (previously known as c-kit), emigrate exclusively into the developing dermis, and then express definitive markers of the melanocyte lineage. These are thus melanocyte progenitor
cells. They are generated predominantly at the midbrain-hindbrain junction and cervical trunk, with significant numbers also in lower trunk. Other cells within the dorsal NT are Kit–, migrate ventrally, and, from embryonic day 9.5, express the neurotrophin receptor p75. These cells most likely only give rise to ventral NC derivatives such as neurons and glia. The p75+cells are located ventrolateral
to the Kit+cells in areas of the NT where these two cell types are found. These data provide direct in vivo evidence for NC lineage segregation within the mouse neural tube.
Key words: Neural crest, Melanocyte, Specification, Lineage segregation, Precursors, Stem cells, Neural tube
Summary
Neural crest cell lineage segregation in the mouse neural tube
Yvette M. Wilson1, Kay L. Richards1, Miriam L. Ford-Perriss1, Jean-Jacques Panthier2and Mark Murphy1,*1Department of Anatomy and Cell Biology, University of Melbourne, Melbourne, Victoria 3010, Australia
2UMR 955 INRA de Genetique Moleculaire et Cellulaire, Ecole Nationale Veterinaire d’Alfort, Maisons-Alfort Cedex, France
*Author for correspondence (e-mail: m.murphy@unimelb.edu.au)
Accepted 14 October 2004
Development 131, 6153-6162
Published by The Company of Biologists 2004 doi:10.1242/dev.01533
express the receptor tyrosine kinase Kit (previously known as c-kit), early in culture, and are dependent on Kit signaling for survival and proliferation (Murphy et al., 1992; Reid et al., 1995; Reid et al., 1996). These Kit+ cells only give rise to melanocytes and thus represent melanocyte progenitor cells (Luo et al., 2003; Reid et al., 1995). Studies in vivo have traced the expression of other melanocyte markers, and determined that these markers are expressed soon after emigration from the NT (Kitamura et al., 1992; Reedy et al., 1998a; Wehrle-Haller and Weston, 1995). Studies in aves provide evidence that dorsolaterally migrating NC cells are already specified to the melanocyte lineage (Reedy et al., 1998a).
Thus, for tetrapods, different experiments point both to multipotentiality and early specification, and it is still unclear where, when and how NC specification occurs. The use of markers that distinguish different NC lineages might help to clarify this issue. These markers could be used to look for evidence of specification within the NT, and if it does occur, when and where it happens. We have investigated Kit and the neurotrophin receptor p75 (Mujtaba et al., 1998; Stemple and Anderson, 1992) as potential markers for different NC precursors within the NT.
Materials and methods
Analysis of β-galactosidase expression and immunohistochemistry
WlacZembryos were staged (Theiler, 1989), fixed for 20 (E9-E10) or
40 (E11-E12) minutes in 2% paraformaldehyde (PFA) in phosphate-buffered saline (PBS), and then rinsed in PBS then Wash buffer [0.1 M sodium phosphate (pH 7.7), 5 mM ethylene glycol-bis aminoethyl ether tetra-acetic acid (EGTA), 5 mM MgCl2, 0.01% sodium deoxycholic acid, 0.01% Igepal CA-630 (Sigma-Aldrich)]. Embryos were then stained for 12-24 hours in Stain Buffer [wash buffer containing 2 mM potassium ferricyanide, 2 mM potassium ferrocyanide, 0.4 mg/ml 5-bromo-4-chloro-3-indolyl-D-galatosidase (Astral, Gymea, Australia)] at 37°C. For whole-mount microscopy, stained embryos were post-fixed in 4% PFA for at least 4 hours, rinsed in PBS and cleared in glycerol for at least 4 days at 4°C. Cleared whole-mount embryos were imaged using a Nikon digital camera (SB-28) and a Zeiss phase contrast microscope. For analysis of β -galactosidase (βgal) staining in thin sections, whole-mount stained embryos were embedded in paraffin wax, and 5 µM transverse sections were taken, counterstained with nuclear Fast Red and examined by light microscopy.
For immunohistochemistry, embryos were fixed in either 2% PFA for 30 minutes or 4% PFA for 2-4 hours, then embedded in OCT compound (Sakura, Tokyo, Japan) and immunohistochemistry performed on 20 µM cryostat sections. Sections from embryos fixed in 2% PFA were incubated with mouse anti-βgal (1:1000, Promega, Annandale, Australia) and either rabbit anti-Trp2 (1:1000) or rabbit anti-p75 (1:100, Promega); or with mouse anti-Isl1 (1:1000; Developmental Studies Hybridoma Bank, Iowa City, IA) and rabbit anti-βgal (1:5000; Cappel, Seven Hills, Australia). Antibodies were diluted in Casblock (Zymed, San Francisco, CA). Sections from embryos fixed in 4% PFA were incubated with rabbit anti-βgal (as above), and with rat antibodies to CD31 (1:1000, Serotec, Oxford, UK), CD34, (1:1000, BD Pharmingen, Singapore), CD45 (1:500, BD Pharmingen), F4/80 (1:500, Serotec) or, alternatively, with rat anti-mouse p75 (1:100, Chemicon, Temecula, CA). Sections incubated with mouse anti-βgal were washed and incubated in biotinylated anti-mouse IgG (1:400 in Casblock; Vector, Burlingame, CA). All sections were washed in 0.1% Triton X-100 and incubated with appropriate Alexa fluorophore labelled reagents (Molecular Probes, Eugene, OR).
After antibody incubations, sections were washed in PBS and coverslipped in fluorescent mounting medium (DAKO, Carpinteria, CA). Sections were imaged on a Bio-Rad laser scanning confocal microscope. Images were processed with Adobe Photoshop 5.5.
For βgal histochemistry combined with p75 immunohistochemistry of whole-mount embryos, embryos were stained for βgal as above for 8 hours on a rotating shaker at 75 rpm, the ventral tissue was dissected away and immunohistochemistry performed with rabbit anti-p75 for 48 hours at room temperature at 75 rpm. Embryos were flat mounted on clean glass slides, dorsal side up, and coverslipped with fluorescent mounting medium. Overlapping brightfield images were taken using a 10 objective on an Olympus BX61 microscope and merged in Photoshop Elements 2. For imaging the double labelling, brightfield images were taken, inverted, false coloured red, and fluorescent images were taken at the same focal plane. Both images were deconvolved using No Neighbours algorithm and merged using AnalySIS software (Soft Imaging Systems).
Genotyping
Genomic DNA was solubilized from yolk sacs by digestion with proteinase K (Sambrook et al., 1989). DNA was genotyped for the threeKitgenotypes using two pairs of oligonucleotides:
LacZF, 5′-gcatcgagctgggtaataagcg-3′ (forward), and lacZR, 5′ -gacaccagaccaactggtaatggtagcg-3′(reverse); and
KitF, 5′-TCCTGTTGGTCCTGCTCC-3′ (forward), and KitR, 5′ -GTGGTAGGCATGGGAAAAG-3′(reverse).
PCR reactions (20 µl) were carried out in the presence of 1.5 mM MgCl2, 1PCR Enhance (Invitrogen, Carlsbad, California) andTaq DNA polymerase (Bioscientific, Sydney, Australia), and the reaction conditions were: 94°C for 7 minutes; followed by 30 cycles of 94°C for 30 seconds, 57°C for 30 seconds and 72°C for 30 seconds. The amplified fragment size for the lacZoligonucleotide pair was 800 bp, and the Kitoligonucleotide pair amplified a 148 bp fragment.
Results
Kit+cells arise on the dorsal midline of the NT and
emanate out from it
In order to look for putative Kit+melanocyte precursors within the NT, we used a mutant mouse strain (WlacZ) containing the
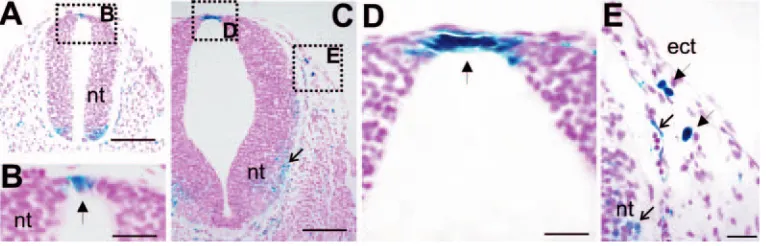
lacZreporter gene inserted into the first exon of the Kitgene (Bernex et al., 1996). We visualized the presence of Kit+cells in the embryo by histochemical staining for βgal activity in heterozygous mice, which accurately recapitulates Kit expression (Bernex et al., 1996). In trunk regions of heterozygous mice, there were βgal+ cells within the neuroepithelium on the dorsal midline from as early as E9, and βgal+cells were observed in significant numbers by E9.5 (n=5; Fig. 1A,B). No βgal+cells were present in the ectoderm at this stage (Fig. 1A). By E10.5, there were many strong βgal+cells on the dorsal midline of the NT (Fig. 1C,D; n=5), and on a dorsolateral path from the NT under the ectoderm (Fig. 1C,E). In addition, there were weak βgal+cells surrounding the NT in the mesenchyme, often associated with blood cells (Fig. 1E). There were also weak βgal+cells in ventrolateral regions of the NT (Fig. 1C,E), which may be precursors for ventrolateral spinal cord cells.
βgal+ cells separated by regions with fewer βgal+cells (Fig. 2B; n=19). These cells were not restricted to the midline, but emanated out from it, either as single cells or in groups (Fig. 2B,C). By E11, βgal+cells were present extensively under the
surface ectoderm, distributed in apparent migration zones (arrows; n=16; Fig. 2D) The initial location of the βgal+cells
in the NC region of the NT (dorsal midline), their pattern of expression emanating from the midline, their temporal progression to medial regions from E10.5 and then to more distal regions at E11, all suggest that Kit+ cells arise on the
dorsal midline and migrate out to ectoderm and associated mesenchyme.
Kit+cells that migrate dorsolaterally are melanocyte progenitor cells
Trp2 (or dopachrome tautomerase) (Tsukamoto et al., 1992) is an early and definitive marker for melanocyte progenitors. It has been detected in melanocyte progenitors from as early as E10.5 between the dermatome and the overlying epithelium, but never within the NT (Pavan and Tilghman, 1994; Steel et al., 1992; Wehrle-Haller and Weston, 1995). In order to study the expression of βgal and Trp2 in vivo, and to unequivocally identify melanocyte progenitors, sections of E11 WlacZ/+ embryos were immunostained for both markers (n=3). Fig. 3 shows a transverse section through the trunk of an E10.5 embryo immunostained for βgal and Trp2. All βgal+cells are
Trp2+. For all sections examined, the βgal+ cells associated with the ectoderm were also Trp2+(96/97 cells counted), which
shows that Kit+ cells, which have migrated into the subectodermal area, are melanocyte progenitors.
Identification of Kit+cells around the NT and
sensory ganglia
In WlacZ/+ embryos, βgal+cells were also found around the NT (Fig. 1C,E) and sensory ganglia, and it was possible that some of these cells were NC derived. However, these cells were present within the developing embryo prior to E9, before βgal+
cells had developed on the dorsal midline of the embryo (n=6; data not shown). These cells expressed lower levels of βgal compared with the βgal+ cells associated with the ectoderm, and also appeared to be generally associated with blood cells (Fig. 1E). They may have belonged to other cell lineages in the
[image:3.612.112.495.75.198.2]embryo that express Kit, such as hematopoietic cells, germ cells or vascular cells (Bernex et al., 1996). To determine whether these cells were associated with the vascular system, we immunostained WlacZ/+ embryos for βgal and with a panel of antibodies that detect blood vessels. These markers were: CD34, which is expressed on hematopoietic stem cells, endothelial cells and blood vessels; CD45, which is expressed
Fig. 1.Development of βgal expression in dorsal regions of WlacZ/+ embryos. (A) Low-power view through the trunk section of an E9.5 embryo. (B) High-power view reveals faint βgal+cells (arrow) within the dorsal midline at E9.5. (C) Low-power view through the trunk at the level of the forelimb of an E10.5 embryo. (D) High-power view of the dorsal midline reveals strong βgal+cells (filled arrow) on the dorsal midline of the NT. (E) High-power view of the ectoderm reveals strong βgal+cells (filled arrows). There are also βgal+cells in ventrolateral regions of the NT and surrounding it (open arrows in C and E). ect, ectoderm. Scale bars: 250 µm in A,C; 50 µm in B,D,E.
Fig. 2.Histochemical staining for βgal+in wholemounts of WlacZ/+
[image:3.612.334.550.372.629.2]on leukocytes; and F4/80, which is expressed on macrophages. Fig. 4A shows a blood vessel within a DRG of an E10.5 embryo stained with CD34, which clearly delineates the
vasculature. Fig. 4B shows a high power view of F4/80 staining, which reveals a group of cells just peripheral to a DRG. Two of these cells are also βgal+(Fig. 4C,D). In order to reveal the complete vasculature, we used a combined cocktail of these markers for immunostaining tissue sections of the WlacZ/+ embryos (n=4). The βgal+cells around the NT and developing sensory ganglia were contained within blood vessels (Fig. 4E; 250/252 cells counted) and were therefore not NC derived. This is in agreement with our previous findings in vitro that, within the NC population, Kit is exclusively expressed by melanocyte progenitors (Reid et al., 1995).
Later in development, neurons in the dorsal root ganglia expressed Kit, but this occurred after the NC cells had migrated and differentiated into sensory neurons (Bernex et al., 1996; Hirata et al., 1995; Motro et al., 1991), which is consistent with our previous interpretation that Kit is expressed only on postmitotic neurons in the dorsal root ganglia (Reid et al., 1995).
p75 staining reveals an NC precursor population that is distinct from the Kit+cells on the dorsal midline of the NT
[image:4.612.111.498.441.661.2]The low affinity neurotrophin receptor, p75, has been used to identify putative NC stem cells and, in particular, to distinguish them from CNS progenitor cells (Mujtaba et al., 1998; Stemple and Anderson, 1992). To look for such NC cells, we stained whole-mount embryos and sections of WlacZ/+ embryos with p75 antibodies. At E9.0 in the trunk, p75 staining was present in areas of NC migration, and predominantly in areas of most ventral migration; staining extended along most of the trunk but there were only few cells in caudal regions (Fig. 5; n=4). There was also strong staining in ventral and lateral regions of
Fig. 3.Kit+cells that migrate dorsolaterally are melanocyte progenitors. (A) Low-power view of the dorsal region of an E11
WlacZ/+ embryo stained for βgal (red) and Trp2 (green). (B)
High-power view of the region outlined in A. ect, ectoderm. Scale bar in B: 50 µm.
Fig. 4.Kit+ cells in and around developing sensory ganglia co-localise with blood vessels. (A) Section through a dorsal root ganglion in an E10.5 WlacZ/+ embryo, stained for CD34. (B) Section of an E10.5 WlacZ/+ embryo stained for F4/80 in an area just adjacent to ganglion.
(C) Same region as is shown in B, stained for βgal. (D) Merged views of B and C. (E) View of the dorsolateral region of an E10.5 WlacZ/+
the NT, but almost no staining on the dorsal midline. By E9.5, staining was still present in the periphery, but there was also significant staining along the dorsal midline of the NT, which extended down the trunk but not to its most caudal extent (Fig.
[image:5.612.69.550.138.643.2]5; n=4). The p75 staining in the periphery at these ages most likely represents ventrally migrating NC cells, and the staining that appears on the dorsal midline of the NT by E9.5 represents premigratory NC cells. A similar pattern of staining was
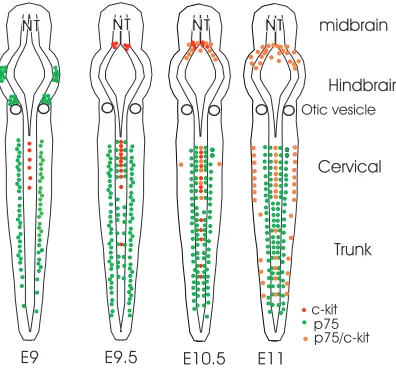
Fig. 5.p75 and βgal staining reveal separate populations of NC precursor cells in the trunk NT. WlacZ/+ embryos were stained for p75 using
observed at E10.5-E11, and at these ages the staining along the dorsal midline extended along the entire length of the trunk (Fig. 5; n=4 for both E10.5 and E11). In addition, the pattern of p75 staining was more complex at these ages and other cells were positive (von Schack et al., 2001).
In order to determine the relationship between the p75+ and the βgal+ cells within the dorsal midline of the NT, these embryos were stained for βgal (Fig. 5). As described above, in cervical regions some βgal+ cells were present from E9; this is prior to p75 staining on the dorsal midline. By E9.5 in cervical regions, both βgal+ cells and p75+ cells were present in dorsal NT, but in distinct locations. The βgal+ cells were predominantly on the most dorsomedial aspect of the NT, whereas the p75+ cells were adjacent and ventrolateral to these βgal+ cells (inset to cervical section at E9.5). A few βgal+ cells were also found in midtrunk NT at E9.5, amongst the much larger numbers of p75+cells. By E10.5, βgal+ cells extended to caudal regions of the trunk, with the largest numbers being present in cervical regions, and groups or clusters of cells extending to lower trunk, amongst the larger population of p75+ cells. By this age, some of the βgal+ cells also stained for p75 (inset of midtrunk section at E10.5). At E11, many βgal+ were still present in cervical regions, some cells were present in midtrunk regions and there was an increase in numbers in lower trunk. In mid- and lower trunk regions, where the βgal+ cells were often isolated or in small groups, they were still found in most medial parts of the NT and were surrounded by p75+ cells (E11 insets). At this age, all the βgal+ cells we found on the dorsal midline also stained for p75 (n=50 sections examined). The medial βgal+cell-lateral p75+cell relationship was maintained at all ages (n=12 embryos, n=100 sections).
By E11, many βgal+ cells were present in the ectoderm (Figs 2, 5). In cervical and midtrunk regions, these cells were dispersed away from the midline, whereas in the lower trunk many βgal+ cells were near the midline. p75 began to be expressed extensively in the ectoderm at this age and the
fraction of cells that stained for both βgal and p75 was difficult to determine. Nevertheless, in areas of the ectoderm where it could be determined, the βgal+ cells did stain for p75 (not shown), suggesting that these cells express p75 during migration into the ectoderm. By contrast, in areas of ventral NC migration, none of the p75+cells were βgal+(Fig. 5; 185 cells counted). This is consistent with our findings that Kit is only expressed by melanocyte progenitors that migrate into the ectoderm.
The combination of βgal and p75 staining reveals distinct populations of NC cells within the NT: (1) the Kit+population, present from E9, in greatest numbers in cervical regions of the trunk, constitutes the melanocyte progenitor population; (2) the p75+/Kit– population, present from E9.5, extends throughout the trunk region and migrates ventrally; and (3) an early population of cells which must also be present is the p75–/Kit–, which migrates prior to E9.5, and contributes to the ventrally migrating p75+cells.
[image:6.612.105.558.487.718.2]Kit+cells on the dorsal midline at the midbrain-hindbrain junction are melanocyte progenitor cells In contrast to the trunk, dorsal midline expression of βgal in the head was focal and restricted to the midbrain-hindbrain junction (Fig. 6A,B; n=15). There was also strong expression of βgal in ventral regions of the midbrain-hindbrain junction (Fig. 6A,B). Soon after their appearance on the dorsal midline from E9.5-10, βgal+ cells appeared associated with the ectoderm, in a region both lateral and caudal to the midbrain-hindbrain junction (n=19, Fig. 6A,C). As development proceeded, these βgal+ cells progressively occupied more distal regions of the ectoderm (compare Fig. 6A, at E10.5, with 6C,D, at E11). In addition, a stream of βgal+ cells appeared, starting at the midbrain-hindbrain junction and extending caudally and laterally through the mesenchyme adjacent to the hindbrain (Fig. 6A,C,D). The βgal+cells, both in the ectoderm and in the stream in the mesenchyme,
Fig. 6.Analysis ofWlacZ/+ embryos in the
head shows that Kit+cells at the dorsal midline of the midbrain-hindbrain junction give rise to melanocytes. (A) Dorsolateral view of the rostral region of a whole-mount embryo at E10.5, showing βgal+cells emanating from the dorsal aspect of the midbrain-hindbrain junction. βgal+cells emanate caudolaterally as a stream through the mesenchyme adjacent to the hindbrain, as well as to the ectoderm (asterisk).
(B) Transverse section through an E10.5 embryo at the midbrain-hindbrain junction, showing βgal+cells on the dorsal midline and ectoderm. A high-power view of the same region stained for p75 and βgal is shown in the inset; strong p75 staining is on surface of embryo. (C) Lateral and (D) dorsal views of an E11 embryo, showing increasing distribution of βgal+cells through ectoderm (asterisk). (E) Transverse section through the rostral hindbrain of an E10.5 embryo at level indicated by broken line in C, stained for βgal
expressed Trp2 (Fig. 6E), indicating that they are melanocyte progenitor cells. This pattern of expression, first at the midbrain-hindbrain junction, then in the ectoderm and mesenchyme, is consistent with emigration of Kit+melanocyte
progenitors from the dorsal midline of the NT at a specific region in the developing head.
As in the trunk, there were other βgal+cells present in the head, which were not derived from the βgal+NC cells in the
NT. Firstly, βgal+cells were present from E8.5 in branchial arches and from E9 in cranial ganglia, both of which contain NC-derived cells (Fig. 7A). However, these cells appeared well before there was any expression of βgal on the dorsal midline in the head (Fig. 7B), or any migration of βgal+cells from either trunk NT or the midbrain-hindbrain junction (Fig. 2A, Fig. 8A). Thus, if these cells were NC derived, they must have been βgal– in the NT and expressed βgal only post
migration. This is analogous to the situation in the trunk, where sensory neurons begin to express Kit after differentiation. For example, in the trigeminal nucleus, the βgal+cells stained for Isl1, a marker that is only expressed on
neuronal progenitors post migration (Fig. 7C,D). Secondly, a small group of βgal+cells appeared on the caudal-most region
of the roof plate from E9 (Fig. 7A,C, Fig. 8A). These cells were entirely restricted to the roof plate, that is, there were no βgal+ cells in the neuroepithelium under the roof plate (Fig. 7A, Fig. 8E). Furthermore, these cells were still present in
WlacZ/lacZembryos, indicating that they are not dependent on Kit, unlike melanocyte progenitors, and they did not stain for p75 or Trp2 (data not shown). Thus, these cells were not melanocyte progenitors and they did not arise from Kit+ cells
in the NT.
Staining for p75 in the head at E9 revealed 2 groups of cells in the periphery, corresponding to trigeminal and facio-acoustic NC, and there was no staining in premigratory crest (not shown). At later ages, p75 staining became more extensive in the head and difficult to interpret, particularly in wholemounts. Nevertheless, in sections of E10.5 embryos, some of the βgal+cells at the midbrain-hindbrain junction were
clearly p75+, but there were no p75+cells ventrolateral to these cells (Fig. 6B, inset).
Discussion
Kit+cells in the dorsal NT are melanocyte progenitors
[image:7.612.237.567.74.245.2]Our studies with WlacZ mice indicate that Kit+ cells on the dorsal midline of the NT are premigratory NC cells. Kit begins to be expressed on the dorsal midline of the trunk NT from E9, precisely in the premigratory crest region. From E10.5, these Kit+ cells begin to express p75, a marker for NC cells (Mujtaba et al., 1998; Stemple and Anderson, 1992). The progressive increase in the number of these cells, followed by a migratory pattern of the cells extending from the midline into the ectoderm, provide evidence that these Kit+cells migrate into the ectoderm and associated mesenchyme. Culture experiments we have undertaken further support this interpretation (Y.M.W. and M.M., unpublished). We established NC cultures by
[image:7.612.345.543.498.683.2]Fig. 8.Scheme for the development of Kit+and p75+cells in the developing premigratory and peripheral NC. Cells inside the NT represent cells in the premigratory crest, other cells represent migrated NC cells, and those on the borders of embryo represent NC cells in the ectoderm.
Fig. 7.Non-melanogenic Kit+cells in the head are not derived from Kit+dorsal midline NT cells. (A) Dorsolateral view of a whole-mount E9.5WlacZ/+ embryo. βgal+cells are present in the branchial arches and presumptive cranial ganglia (filled arrows), and on roof plate (open arrow), but no βgal+cells emanate from the midbrain-hindbrain junction. (B) Transverse section through an E9.25 embryo at the midbrain-hindbrain junction, showing absence of βgal+cells on the dorsal midline and ectoderm. (C) Low-power view of a transverse section through the hindbrain region of an E10
WlacZ/+ embryo at level of the trigeminal
ganglion (boxed) stained for βgal (green) and Isl1 (red). (D) High-power view of the boxed area in C, showing that many cells in the trigeminal ganglion are βgal+/Isl1+(yellow).
plating E9 NTs under conditions that supported the survival of Kit+cells in the migrated NC population (Reid et al., 1995). Removal of the NTs after one or two days of culture prevented any increase in number of Kit+cells in the NC, indicating that the NT is required for new Kit+NC cells to appear (Y.M.W. and M.M., unpublished). To show directly that Kit+ cells migrate from the NT, mice could be generated with the GFP gene knocked into the Kit gene. These mice could be used to directly follow the migration of individual Kit+cells by time-lapse fluorescent microscopy of living embryos.
Our findings also indicate that the migrated NC Kit+ cells only give rise to melanocytes. The Kit+cells that migrate into the ectoderm all express Trp2, indicating that they are melanocyte progenitors. We looked for any evidence that these cells may give rise to other NC cell types. None of the ventrally migrating p75+NC cells express Kit. We did find Kit+cells in regions of ventral migration, but these cells were contained within blood vessels, indicating that they were not NC derived. More studies, such as studies involving the generation of a Kit tamoxifen-inducible cre line of mice, could further clarify this issue. In vitro, Kit+ NC cells only develop into melanocytes (Luo et al., 2003; Reid et al., 1995). Even in conditions that favor neuronal development, there was no evidence that Kit+ cells ever gave rise to anything but melanocytes (Reid et al., 1995). Elimination of Kit signaling results in the death of the Kit+cells as soon as they migrate from the NT, and a resultant total loss of skin melanocytes (Bernex et al., 1996; Reid et al., 1995; Wehrle-Haller and Weston, 1995; Yoshida et al., 1996). Thus, Kit+ cells have a restricted cell fate in vivo and are progenitors for all skin melanocytes. These findings are consistent with other studies that suggest that melanocyte progenitors are fate restricted during migration (Erickson and Goins, 1995; Wakamatsu et al., 1998).
There is evidence that a small proportion of NC cells, which migrate into the epidermis, have both melanogenic and neurogenic potential in vitro (Richardson and Sieber-Blum, 1993). This raises the possibility that for these cells, melanocyte cell fate decision could be made after migration into the epidermis. However, there is no evidence that this occurs in vivo. On the contrary, studies in vivo indicate that the small number of NC cells with neurogenic potential, and which migrate into the epidermis, are eliminated by apoptosis (Wakamatsu et al., 1998).
It is unknown whether the cells in the dorsal NT are irreversibly fate determined once they begin to express Kit and before they have emigrated. At this stage, Kit is the only known melanocyte marker expressed on these cells. The expression of a transcription factor, MITF, which is crucial for melanocyte development (Hornyak et al., 2001; Opdecamp et al., 1997), is also useful for identification of putative melanocyte progenitors. MITF is probably expressed soon after Kit, and rare MITF cells have been found close to the dorsal midline of the NT, just underneath the surface ectoderm (Nakayama et al., 1998). The precise relationship between Kit and MITF is unclear, but whereas initial expression of both of these proteins is independent of the other, subsequently MITF is required for the maintenance of Kit, and Kit modulates MITF (Hou et al., 2000; Opdecamp et al., 1997). Trp2 is only expressed later, possibly at the point the cells encounter the ectoderm (Hornyak et al., 2001). It would thus not be surprising if this first step, expression of Kit, in melanocyte development were reversible.
This would be in accord with our previous proposal that cell fate decision is a continuous process, beginning as soon as the NC forms, but which may be reversible at the early stages (Murphy and Bartlett, 1993). However, early functional consequences of melanocyte specification are evidenced by grafting experiments in aves (Erickson and Goins, 1995), which showed that only NC cells, specified to the melanocyte lineage, migrate along the dorsolateral path from the NT.
Origin of melanocytes in the head
In the head, Kit+ cells develop on the dorsal midline only at the midbrain-hindbrain junction. The cells from this region migrate to the ectoderm in the head, as well as forming a stream of cells in the mesenchyme. We have not characterized which structures in the head are populated by this stream, but initial observations indicate that it could provide melanocytes for the ear and eye. The focal source of melanocytes in the head has not been defined before, but other studies are consistent with our findings. Kit antibody staining on the surface of the embryo revealed two populations of Kit+cells in the head region: (1) over the midbrain area, which corresponds to the cells we describe originating from the midbrain-hindbrain junction; and (2) a more caudal group, corresponding to the cells we see that have migrated from the cervical area of the trunk NT (Yoshida et al., 1996). Furthermore, the expression of MITF on the surface of the head is essentially the same as we see with Kit (Nakayama et al., 1998). Finally, in other studies that traced melanoblast clones in dopachrome tautomerase-lacZ transgenic mice embryos, the clones showed a restricted distribution on the surface of the head at early developmental times, similar to what we observe (Wilkie et al., 2002).
Other structures in the head express Kit, but they are not derived from the Kit+cells in the dorsal NT. If any of these Kit+ cells are NC derived, they must be derived from cells that did not express Kit at the time of migration. We showed this in the branchial arches and cranial ganglia, which express Kit well before there is any Kit expression in the dorsal NT. These findings are supported by tracing studies in mice, which show that NC migration into the branchial arches is over by early E8, and that migration into the cranial ganglia is over slightly later (Osumi-Yamashita et al., 1994; Serbedzija et al., 1992). This is at least 36 hours before we see any migration of Kit+cells in the head. Some of the very early migrating NC cells may be derived from epidermal ectoderm (Nichols, 1981), and in our studies there is a suggestion of this from the very close association of the developing trigeminal ganglion with the ectoderm (Fig. 7D).
In studies of melanocyte development in the head in aves, early migrating branchial arch-derived NC cells do not differentiate into melanocytes in vitro; melanoblasts only appear late in NC development and do not invade the branchial arches (Reedy et al., 1998b). These findings are consistent with ours, that melanocytes are derived from a discrete population of NC cells in the head.
NC lineage segregation in the NT
predominantly at the midbrain-hindbrain junction and the cervical trunk, with significant numbers also in the lower trunk. This axial pattern corresponds with the variable densities of melanoblasts found lateral to the NT in the mouse embryo (Baxter et al., 2004). The Kit+cells begin to express p75 from E10.5, when they start to migrate, suggesting a link between p75 expression and migration for these cells. (2) The p75+/Kit– cells, which migrate ventrally. These cells arise from E9.5 in the premigratory crest and are ventrolateral to the Kit+cells in the areas where these two cell types are found. They are unlikely to generate melanocytes because of their ventral migration and their lack of Kit expression. We have never found Trp2+melanocyte progenitors in the ventral migration path (data not shown). Furthermore, neural crest cells isolated from the ventral path do not give rise to melanocytes when explanted in culture (Reedy et al., 1998a). Thus, this p75+/Kit– population most likely gives rise only to ventral NC derivatives, such as peripheral neurons and glia. These cells may correspond to a population of NC cells that migrates ventromedially from E9.5 through E10.5 (Serbedzija et al., 1990). One way to verify this would be to label the dorsal NT with a traceable dye in a mediolateral pattern at E9.5-E10, to see if and where the p75+cells migrate.
A third population of premigratory cells must also exist in the dorsal NT that expresses neither Kit nor p75: these cells must give rise to the earliest migrating NC cells that we detect with p75 staining along the ventral migration path at E9. This early population may be the same as an early NC population that migrates ventrolaterally up until E9.5 (Serbedzija et al., 1990).
Our findings can be compared with the zebrafish NC, where there is good evidence for cell lineage specification within the premigratory NC (Raible and Eisen, 1994; Schilling and Kimmel, 1994). In the head of the zebrafish, there is also evidence for lineage segregation based on mediolateral location within the NC, with neurogenic cells most lateral, mesenchymal cells most medial, and melanocytes between (Schilling and Kimmel, 1994). Cranial NC cells in zebrafish are laterally segregated from the neural keel as a coherent mass, in a very different arrangement to that in tetrapods. Because of this pronounced difference in structure, it is difficult to know how similar the cranial NC in zebrafish is to the premigratory NC in tetrapods (Schilling and Kimmel, 1994). Our findings showing a related mediolateral segregation of cell lineage in the mouse trunk suggest that this kind of NC segregation applies to vertebrates in general. However, our findings are not equivalent to zebrafish. In the mouse head, melanocyte progenitors are restricted to the midbrain-hindbrain junction and we have not found evidence for a mediolateral arrangement of NC cell types in this region.
Our observations on the timing of migration are also consistent with previous findings that the timing of migration influences the range of neural crest derivatives (Raible and Eisen, 1994; Serbedzija et al., 1994), and that only late migrating NC cells are melanogenic (Erickson and Goins, 1995; Reedy et al., 1998a; Haller et al., 2001; Wehrle-Haller and Weston, 1995; Yoshida et al., 1996).
A number of studies have traced the fate of individual dorsal NT precursor cells in vivo in tetrapods, and provide strong evidence that these cells are multipotential precursors for both NT cells and different NC lineages (Bronner-Fraser and Fraser,
1989; Bronner-Fraser and Fraser, 1988; Collazo et al., 1993; Frank and Sanes, 1991; Serbedzija et al., 1994). As a large number of clones gave rise to both NT and NC cells, it follows that a large proportion of the traced cells divided and generated two or more cells within the dorsal NT. Within the NT, the individual cells of a developing clone could thus be separately induced to either become a ventrally migrating NC cell, to express Kit and migrate dorsolaterally, or to become an NT cell. This would be consistent both with the multipotentiality of these cells, as well as with melanocyte fate decision within the NT.
How is the melanocyte lineage induced?
If our interpretations are correct, then NT cells right on the dorsal midline must be specifically induced to express Kit and melanocyte fate. Factors that are at their highest concentration on the midline may be involved in the induction process. In zebrafish, the medial expression of Wnts is implicated in melanocyte specification in the head (Dorsky et al., 1998). If Wnt signalling is ablated specifically in NC cells in mice, melanocytes and sensory neurons are lost, but not autonomic neurons (Hari et al., 2002). In avian NC cultures, Wnt3a stimulates melanocyte production but neuron differentiation is inhibited (Jin et al., 2001). Furthermore, the Wnt modulator,
cfrzb1, is expressed in neuronal and glial precursors and not in melanoblasts (Jin et al., 2001). Therefore, it is possible that Wnt signalling results in neural/neuronal specification when
Frzb1 is expressed, and in melanocyte specification in its absence. Precisely where Frzb1 is expressed in the NT needs to be determined. Other signalling pathways may also be involved.
We thank Kerry-Lee Harris, Kirsty Turner and Heather Young for help and suggestions, and Vincent Hearing for the Trp2 antibody. This work was funded by the National Health and Medical Research Council of Australia.
References
Baxter, L. L., Hou, L., Loftus, S. K. and Pavan, W. J. (2004). Spotlight on spotted mice: a review of white spotting mouse mutants and associated human pigmentation disorders. Pigment Cell Res.17, 215-224.
Bernex, F., de Sepulveda, P., Kress, C., Elbaz, C., Delouis, C. and Panthier, J. J. (1996). Spatial and temporal patterns of c-kit-expressing cells in WlacZ/+ and WlacZ/WlacZ mouse embryos. Development122, 3023-3033. Bronner-Fraser, M. and Fraser, S. E. (1988). Cell lineage analysis reveals
multipotency of some avian neural crest cells. Nature335, 161-164. Bronner-Fraser, M. and Fraser, S. (1989). Developmental potential of avian
trunk neural crest cells in situ. Neuron3, 755-766.
Collazo, A., Bronner-Fraser, M. and Fraser, S. E. (1993). Vital dye labelling of Xenopus laevis trunk neural crest reveals multipotency and novel pathways of migration. Development118, 363-376.
Dorsky, R. I., Moon, R. T. and Raible, D. W. (1998). Control of neural crest cell fate by the Wnt signalling pathway. Nature396, 370-373.
Dorsky, R. I., Moon, R. T. and Raible, D. W. (2000). Environmental signals and cell fate specification in premigratory neural crest. Bioessays22, 708-716.
Dupin, E. and le Douarin, N. M. (2003). Development of melanocyte precursors from the vertebrate neural crest. Oncogene22, 3016-3023. Dupin, E., Ziller, C. and le Douarin, N. M. (1998). The avian embryo as a
model in developmental studies: chimeras and in vitro clonal analysis. Curr. Top. Dev. Biol.36, 1-35.
Erickson, C. A. and Goins, T. L. (1995). Avian neural crest cells can migrate in the dorsolateral path only if they are specified as melanocytes.
Development121, 915-924.
root ganglia: analysis in vivo with a recombinant retrovirus. Development
111, 895-908.
Hari, L., Brault, V., Kleber, M., Lee, H. Y., Ille, F., Leimeroth, R., Paratore, C., Suter, U., Kemler, R. and Sommer, L. (2002). Lineage-specific requirements of beta-catenin in neural crest development. J. Cell Biol.159, 867-880.
Henion, P. D. and Weston, J. A. (1997). Timing and pattern of cell fate restrictions in the neural crest lineage. Development124, 4351-4359. Hirata, T., Kasugai, T., Morii, E., Hirota, S., Nomura, S., Fujisawa, H. and
Kitamura, Y. (1995). Characterization of c-kit-positive neurons in the dorsal root ganglion of mouse. Brain Res. Dev. Brain Res.85, 201-211. Hornyak, T. J., Hayes, D. J., Chiu, L. Y. and Ziff, E. B. (2001). Transcription
factors in melanocyte development: distinct roles for Pax-3 and Mitf. Mech. Dev.101, 47-59.
Hou, L., Panthier, J. J. and Arnheiter, H. (2000). Signaling and transcriptional regulation in the neural crest-derived melanocyte lineage: interactions between KIT and MITF. Development127, 5379-5389. Jin, E. J., Erickson, C. A., Takada, S. and Burrus, L. W. (2001). Wnt and
BMP signaling govern lineage segregation of melanocytes in the avian embryo. Dev. Biol.233, 22-37.
Kitamura, K., Takiguchi-Hayashi, K., Sezaki, M., Yamamoto, H. and Takeuchi, T. (1992). Avian neural crest cells express a melanagenic trait during early migration from the neural tube: observations with the new monoclonal antibody, “MEBL-1”. Development114, 367-378.
Le Douarin, N. M. and Kalcheim, C. (1999). The Neural Crest. Cambridge, UK: Cambridge University Press.
Luo, R., Gao, J., Wehrle-Haller, B. and Henion, P. D. (2003). Molecular identification of distinct neurogenic and melanogenic neural crest sublineages. Development130, 321-330.
Motro, B., van der Kooy, D., Rossant, J., Reith, A. and Bernstein, A. (1991). Contiguous patterns of c-kit and steel expression: analysis of mutations at the W and Sl loci. Development113, 1207-1221.
Mujtaba, T., Mayer-Proschel, M. and Rao, M. S. (1998). A common neural progenitor for the CNS and PNS. Dev. Biol.200, 1-15.
Murphy, M. and Bartlett, P. F. (1993). Molecular regulation of neural crest development. Mol. Neurobiol.7, 111-135.
Murphy, M., Reid, K., Williams, D. E., Lyman, S. D. and Bartlett, P. F. (1992). Steel factor is required for maintenance, but not differentiation, of melanocyte precursors in the neural crest. Dev. Biol.153, 396-401. Nakayama, A., Nguyen, M. T., Chen, C. C., Opdecamp, K., Hodgkinson,
C. A. and Arnheiter, H. (1998). Mutations in microphthalmia, the mouse homolog of the human deafness gene MITF, affect neuroepithelial and neural crest-derived melanocytes differently. Mech. Dev.70, 155-166. Nichols, D. H. (1981). Neural crest formation in the head of the mouse embryo
as observed using a new histological technique. J. Embryol. Exp. Morphol.
64, 105-120.
Opdecamp, K., Nakayama, A., Nguyen, M. T., Hodgkinson, C. A., Pavan, W. J. and Arnheiter, H. (1997). Melanocyte development in vivo and in neural crest cell cultures: crucial dependence on the Mitf basic-helix-loop-helix-zipper transcription factor. Development124, 2377-2386.
Osumi-Yamashita, N., Ninomiya, Y., Doi, H. and Eto, K. (1994). The contribution of both forebrain and midbrain crest cells to the mesenchyme in the frontonasal mass of mouse embryos. Dev. Biol.164, 409-419. Pavan, W. J. and Tilghman, S. M. (1994). Piebald lethal (sl) acts early to
disrupt the development of neural crest-derived melanocytes. Proc. Natl. Acad. Sci. USA 91, 7159-7163.
Raible, D. W. and Eisen, J. S. (1994). Restriction of neural crest cell fate in the trunk of the embryonic zebrafish. Development120, 495-503. Reedy, M. V., Faraco, C. D. and Erickson, C. A. (1998a). The delayed entry
of thoracic neural crest cells into the dorsolateral path is a consequence of the late emigration of melanogenic neural crest cells from the neural tube.
Dev. Biol.200, 234-246.
Reedy, M. V., Faraco, C. D. and Erickson, C. A. (1998b). Specification and migration of melanoblasts at the vagal level and in hyperpigmented Silkie chickens. Dev. Dyn.213, 476-485.
Reid, K., Nishikawa, S., Bartlett, P. F. and Murphy, M. (1995). Steel factor directs melanocyte development in vitro through selective regulation of the number of c-kit+ progenitors. Dev. Biol.169, 568-579.
Reid, K., Turnley, A. M., Maxwell, G. D., Kurihara, Y., Kurihara, H., Bartlett, P. F. and Murphy, M. (1996). Multiple roles for endothelin in melanocyte development: regulation of progenitor number and stimulation of differentiation. Development122, 3911-3919.
Richardson, M. K. and Sieber-Blum, M. (1993). Pluripotent neural crest cells in the developing skin of the quail embryo. Dev. Biol.157, 348-358. Sambrook, J., Fritsch, E. F. and Maniatis, T. (1989). Molecular cloning. A
laboratory manual. Cold Spring Harbor, NY: Cold Spring Harbor Laboratory Press.
Schilling, T. F. and Kimmel, C. B. (1994). Segment and cell type lineage restrictions during pharyngeal arch development in the zebrafish embryo.
Development120, 483-494.
Serbedzija, G. N., Fraser, S. E. and Bronner-Fraser, M. (1990). Pathways of trunk neural crest cell migration in the mouse embryo as revealed by vital dye labelling. Development108, 605-612.
Serbedzija, G. N., Bronner-Fraser, M. and Fraser, S. E. (1992). Vital dye analysis of cranial neural crest cell migration in the mouse embryo.
Development116, 297-307.
Serbedzija, G. N., Bronner-Fraser, M. and Fraser, S. E. (1994). Developmental potential of trunk neural crest cells in the mouse.
Development120, 1709-1718.
Sieber-Blum, M. and Cohen, A. M. (1980). Clonal analysis of quail neural crest cells: they are pluripotent and differentiate in vitro in the absence of noncrest cells. Dev. Biol.80, 96-106.
Steel, K. P., Davidson, D. R. and Jackson, I. J. (1992). TRP-2/DT, a new early melanoblast marker, shows that steel growth factor (c-kit ligand) is a survival factor. Development115, 1111-1119.
Stemple, D. L. and Anderson, D. J. (1992). Isolation of a stem cell for neurons and glia from the mammalian neural crest. Cell71, 973-985. Theiler, K. (1989). The house mouse. Atlas of embryonic development. New
York, NY: Springer-Verlag.
Tsukamoto, K., Jackson, I. J., Urabe, K., Montague, P. M. and Hearing, V. J. (1992). A second tyrosinase-related protein, TRP-2, is a melanogenic enzyme termed DOPAchrome tautomerase. EMBO J.11, 519-526. von Schack, D., Casademunt, E., Schweigreiter, R., Meyer, M., Bibel, M.
and Dechant, G. (2001). Complete ablation of the neurotrophin receptor p75NTR causes defects both in the nervous and the vascular system. Nat. Neurosci.4, 977-978.
Wakamatsu, Y., Mochii, M., Vogel, K. S. and Weston, J. A. (1998). Avian neural crest-derived neurogenic precursors undergo apoptosis on the lateral migration pathway. Development125, 4205-4213.
Wehrle-Haller, B. and Weston, J. A. (1995). Soluble and cell-bound forms of steel factor activity play distinct roles in melanocyte precursor dispersal and survival on the lateral neural crest migration pathway. Development121, 731-742.
Wehrle-Haller, B., Meller, M. and Weston, J. A. (2001). Analysis of melanocyte precursors in Nf1 mutants reveals that MGF/KIT signaling promotes directed cell migration independent of its function in cell survival.
Dev. Biol.232, 471-483.
Wilkie, A. L., Jordan, S. A. and Jackson, I. J. (2002). Neural crest progenitors of the melanocyte lineage: coat colour patterns revisited.
Development129, 3349-3357.