APPLICATION OF DIGITAL IMAGE PROCESSING
TECHNOLOGY IN DYNAMIC TRIAXIAL TEST OF SOIL
MECHANICS
1Shao Longtan*, 2Yang Song, 3Sang Yong, 4Huang Chuan, 5Guo Xiaoxia
1
Prof., Department of Engineering Mechanics, Dalian University of Technology, 116024, Dalian, China
2
Assoc. Prof., Department of Engineering Mechanics, Dalian University of Technology, 116024, Dalian, China
3Assoc. Prof., Department of Mechanical Engineering, Dalian University of Technology, 116024, Dalian, China 4Assoc. Prof., Department of Computer Science, Wuhan Polytechnic University, 430022, Wuhan, China 5Assoc. Prof., Department of Mechanical Engineering, Dalian University of Technology, 116024, Dalian, China
E-mail: [email protected], [email protected], [email protected], [email protected] 5[email protected]
ABSTRACT
Soil stability problems caused by vibratory loading, such as that of earthquakes and wind, have been increasingly observed. Designs and developments, which include a soil dynamic triaxial testing apparatus and a triaxial sample surface dynamic deformation measurement method based on the digital image processing technology, have been proposed to study the characteristics of soil under dynamic loads. The sub-pixel coordinates of corner points of squares on rubber membrane wrapping soil sample can be extracted using a high-speed camera that synchronously shoots images of soil surface dynamic deformation combined with the Canny operator and the Harris method. In accordance with the concept of the four-node isoparametric element in a finite element analysis, the dynamic deformation of soil sample can be calculated. The test results show that the dynamic deformation measurement method involving the use of digital image processing technology is effective in measuring the characteristics of the axial and radial deformation of the strain field, thereby provides a strong experimental foundation to study the mechanical characteristics of soil samples.
Keywords: Digital image Processing, Geotechnical Test, Dynamic Triaxial, Transformation Measurement
1. INTRODUCTION
The stability and deformation problems of soils under dynamic loads are becoming increasingly significant, especially those problems concerning the damage, instability, and deformation of foundation caused by vibratory loads such as earthquakes, wind, and waves are issues that need to be solved as soon as possible. Current research on these complex soil dynamic mechanics issues often rely on simulation tests conducted in laboratories. Dynamic triaxial tests are conducted to study parameters such as soil liquefaction resistance, dynamic elastic modulus, dynamic damping ratio, and so on under different vibration stresses. These tests analyze the deformation characteristics of soil during and after liquefaction, thereby providing a parameter basis for numerical calculation[1].
The digital image processing technology, which is economical, practical, and simple to operate, is used as the research method in tests performed in
geotechnical engineering. The technology has a wide application in the field of geotechnical experimental mechanics and has been acknowledged by scholars locally and abroad. White [2], Alshibli [3]used digital image processing technology to study issues such as the deformation process in sand pile diving and the thickness of the shear zone. Liu [4], Shi [5],and Zhou [6] ,and others use digital image processing technology to study the soil microcosmic structure. Zhao [7], Li [8], Lei
deformation, and application in large deformation measurements of triaxial samples. Any measuring section can be chosen to measure the axial and radial deformation of the triaxial sample directly, and the entire process of the triaxial test during the deformation measurement can be photographed to analyze and study the sample deformation after the test. However, until now, the digital image processing technology is mostly applied in static loading issues, whereas dynamic loading in triaxial testing is complex and has numerous impact factors, which explains why digital image processing technology is rarely applied in dynamic tests locally or abroad.
A digital image measurement system that involves the use of the digital image processing technology was established to measure the surface deformation of soil samples and to satisfy the need for a groundbreaking study of soil tests based on a set of self-developed hydraulic dynamic deformation measurement hardware. We used this measuring system to obtain the corner point coordinates, and the surface deformation field of the soil sample was then calculated. At the end of this paper, a triaxial test was conducted under dynamic loads on specific tailings, and the results were used as an example to verify the feasibility and reliability of this system in practical application.
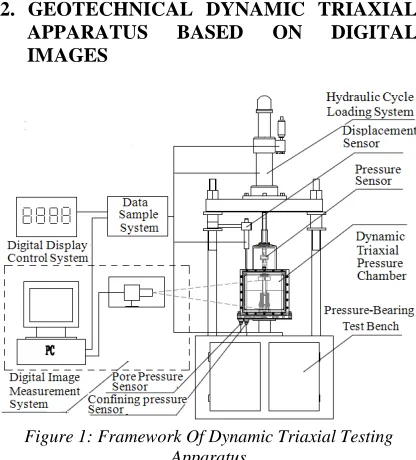
[image:2.612.320.515.134.264.2]2. GEOTECHNICAL DYNAMIC TRIAXIAL APPARATUS BASED ON DIGITAL IMAGES
Figure 1: Framework Of Dynamic Triaxial Testing Apparatus
The geotechnical dynamic triaxial test apparatus developed in this paper is mainly composed of a hydraulic cycle loading system, a pressure test rig, a specially designed pressure chamber, a digital control system, an image measurement system, a high-frequency dynamic monitoring and control
[image:2.612.90.298.423.653.2]system, and so on. The entire framework and appearance are shown in Figure.1 and Figure.2, respectively.
Figure 2: Dynamic Triaxial Testing Apparatus
2.1 Working Principle for Dynamic Triaxial Apparatus
A hydraulic cyclic loading system is the core module of the triaxial test apparatus, which can obtain the static and dynamic loading of force and displacement. We decided to use the hydraulic servo for loading to ensure that the loading servo system has good dynamic response and steady-state accuracy. The hydraulic cyclic loading system consisted of hydraulic oil source (hydraulic station, 21 mPa, 30 L/min), servo amplifier, servo cylinder, servo valves, and accumulators, which can obtain high-frequency response for dynamic loading. This system has good dynamic performance, high reliability, large power—to—weight ratio, flexible configuration, convenient power transmission and control, and large loading rigidity. A pressure rig connects the servo cylinder to a special pressure chamber, which is designed as a gate-like structure with a beam that moves up or down depending on the size of the pressure chamber. The pressure rig can also adjust its perpendicularity during loading to ensure an accurate, reliable, and homogeneous loading force on the axial direction of the sample. The pressure chamber is designed as a special structure with a flat glass to facilitate the image measurement of soil deformation, to ensure the quality of measurement, and to achieve the basic functions of the fixed sample. This specially designed pressure chamber has a pressure of 1,000 kPa.
components, the computer is mainly responsible for the operation of various control algorithms, high-frequency loading waveform generation, data display, data reporting, and storage. The built-in force sensors have high-accuracy and precision. Its force measurement accuracy can reach up to 0.3 N, its control accuracy up to 1 N, and its displacement measurement accuracy up to 0.002 mm. The test curves have a number of sampling points. Each oscillator has 500 sampling points, which can truly reflect the entire process of soil stress, deformation, and pore pressure as they vary over time, thereby demonstrating the entire transient process better.
The dynamic triaxial test apparatus involves the following workflow: a high-frequency dynamic monitoring and control system generates a high-frequency dynamic waveform according to the test requirements and calculates the output value of the controller. The hydraulic cyclic loading system receives the information and starts to complete the high-frequency dynamic loading while triggering the image measurement system to work and record the surface deformation data of the sample under that dynamic loading process. In addition, the digital control system displays real-time data during the test.
2.2 Digital Image Measurement System
The ordinary video camera is slow and cannot capture subtle changes in the soil surface under dynamic loading. Therefore, our system used an industrial high-speed camera (Germany AVT Pike F-100C high-speed camera, which has the fastest-image acquisition speed of 60 frames at a resolution 1000*1000 pixels; 1394 B interface, high data transfer rate, and is programmable to multiple trigger mode) to shoot the real-time deformation images of the sample surface under dynamic loading. Circular LED lights were installed in the pressure chamber, which provided an even and stable light source to ensure the quality of captured images. Given the limitation of computer processing capacity and data capacity, the extraction of corner point coordinates was not accomplished in real-time. Therefore, we saved the images during the test and processed these images afterwards. A latex membrane was wrapped around a cylindrical tailings soil sample, and the membrane was regularly printed with squares having a side length of 12 mm and a spacing of 10 mm between each other. The membrane was made black and the squares were made white to improve recognition accuracy of corner points.
During the test, we synchronized the vibration of triaxial dynamic system and the camera shooting.
The dynamic triaxial test apparatus had a sampling frequency of 250 kHz, which records 500 displacement data in 1 second. The camera was set to capture 50 images per second, which means that it shot a picture at every 10 sampling interval, to achieve the contrast of the measuring data. The triaxial high-frequency dynamic monitoring and control system, as the major synchronization controller, periodically sent a 5-V TTL pulse signal to a high-speed camera at the same time that the vibration began. The camera immediately shot pictures upon receiving the external pulse. When the test ended, the monitoring and control software stopped sending pulse signals, and the camera stopped recording. The aforementioned synchronous operation effectively guaranteed a match between the displacement data collected by the sensors and the displacement data in subsequent calculations.
The implementation process of the digital image processing system is described as follows: the high-speed camera was installed on a solid tripod, arranged at approximately 0.6 meters away from the pressure chamber. Its lens had the same height as the middle of the pressure chamber. The camera was focused so that the sample clearly appeared in the view field of shooting. When the camera started shooting, it located corner points of white squares on the latex membrane as tracking targets. Once the test began, the camera started to work under synchronous instruction from a the high-frequency monitoring and control software periodically shot surface images of the sample, and sorted the images by shooting sequence, which were then stored. When the test was finished, a post-processing program was employed to read images in sequence, track the coordinates of target corner points by using digital image measurement algorithm in the following context, and calculate the surface deformation of the sample based on the changes of coordinates.
3. DIGITAL IMAGE MEASUREMENT METHOD FOR SURFACE DEFORMATION OF GEOTECHNICAL SAMPLE
3.1 Digital Image Measurement Method
Figure 3: The Flow Chart Of The Proposed Algorithm
The image enhancement algorithm was used to improve the contrast of the black rubber membrane and the white squares, which resulted in better edge extraction. The captured images inevitably contained noise. In the process, a 5 * 5 Gaussian pyramid [15] was used in image filtering to eliminate the impact of noise effectively, which is shown in Figure. 4 The Canny operator [16] was employed to extract the contour of white squares. The high threshold and low threshold of the Canny can detect strong and weak contour, respectively. The method is not susceptible to noise interference and is capable of detecting true weak edges. The Canny operator uses Gaussian smoothing function:
(
)
2 2 2 21
, exp
2 2
X Y G X Y
pσ
σ
+
= −
(1)
where
G
x andG
yare the derivatives ofG x y
( )
,
to
X
andY
, respectively.A
=
G
x2+
G
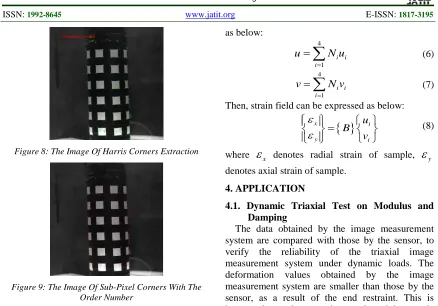
2y is the edge strength. After the non-maxima suppression of the edge strength, the edge points were determined, as shown in Figure. 6. The complete outline of the grid can be obtained in the case of ideal illumination and image quality. However, the grid contour extraction is often incomplete because of the lighting quality in practice. In this paper, we used a mathematical morphology 3 * 3 square structure element to conduct dilation and erosion operations on the images, and we connected the broken edges to close the rectangles. Although the rectangles could be closed after the morphological operations, their borders became wider. Therefore, the “insect following”[17] algorithm was used to extract a single pixel from the outer boundary of the contours. The Douglas-Peucker [18] algorithm was used to fit the obtained polygons. The number of the edges of the polygon were considered, and if it is not equal to four (that is quadrilateral), the polygon was then discard to complete the filtering of the non-target information, as shown in Figure.7. For the extraction of the rectangles’ vertex position, the highly accurate Harris [19] algorithm was employed to obtain the pixel level coordinates of the corner points and to exclude corner points far from the four vertices of the small square, as shown in Figure. 8. The sub-pixel corner detection algorithm proposed by Chiistoph [20] was used toobtain more precise coordinates of the corner points and their number, and to sort the coordinates, as shown in Figure. 9. The aforementioned algorithms were employed to process the captured images, calculate the transformation of specific positions, and obtain the deformation information based on the calculating principle of the deformation field.
[image:4.612.360.476.460.579.2]Figure 4: The Image Of Soil Sample
[image:4.612.360.476.599.712.2]Figure 5: The Image Of Gray-Scale Enhancement And Filtering
Figure 6: The Image Of Canny Edge Detection
Figure 8: The Image Of Harris Corners Extraction
Figure 9: The Image Of Sub-Pixel Corners With The Order Number
3.2. Method for Calculating Strain Field of the Sample
The distance of each object must be normalized and converted into a two-dimensional coordinate system (unit: pixels) of same object distance, that is, the data must be normalized based on the same pixel equivalent to take full advantage of the measurement data on the corner points on the sample surface in calculating the axial and radial strain. Combined with the concept of the four-node isoparametric element in the finite element analysis, the interpolation calculation was conducted on the normalized coordinates of corner points so that the coordinates of the plane at any point could be obtained.
4
1 i i i
x
N X
=
=
∑
(2)4
1 i i i
y
N Y
=
=
∑
(3)Where
X
i andY
i are corner point coordinates,i
N
is shape function. LetX
i0 andY
i0be initial corner point coordinates,then displacement of each corner point can be got from these initial coordinates:0
i i i
u =X −X (4)
0
i i i
v =Y −Y (5) Then, displacement of any point can be represented
as below:
4
1 i i i
u
N u
=
=
∑
(6)4
1 i i i
v
N v
=
=
∑
(7)Then, strain field can be expressed as below:
{ }
x i y i
u B
v
ε
ε
=
(8)
where
ε
x denotes radial strain of sample,ε
y denotes axial strain of sample.4. APPLICATION
4.1. Dynamic Triaxial Test on Modulus and Damping
The data obtained by the image measurement system are compared with those by the sensor, to verify the reliability of the triaxial image measurement system under dynamic loads. The deformation values obtained by the image measurement system are smaller than those by the sensor, as a result of the end restraint. This is because the gap between the sample and the sample cap, base, porous stone and filter paper will be compressed under the loads, which makes the axial strain obtained by the external sensor larger than the real deformation of the sample.
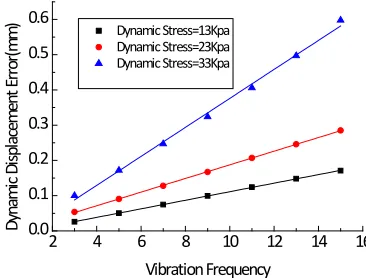
The difference in dynamic displacement and in dynamic strain between the two methods is analyzed with different vibration frequencies. As shown in Figure.10, under the same vibration frequency, the difference in dynamic displacement between the two methods increases (but not linearly) with the increase of dynamic stress. In addition, as vibration frequency increases, the difference between the two methods is greater. It can be imagined that in the dynamic damage tests with a small-value but high-frequency load, the deformation value obtained by the sensor is much higher than that by the image measurement system. In this case, the sensor data have already reached the damage level, but the data from image measurement system have not yet reached the damage level. In other words, the traditional measurement method would probably underestimate the dynamic strength of constructions.
frequency increases. The difference between the two methods increases as dynamic stress increases.
5 10 15 20 25 30 35 0.0
0.1 0.2 0.3 0.4 0.5 0.6
Vibration Frequency=3 Vibration Frequency=8 Vibration Frequency=14
Dy
na
mi
c D
isp
lac
e E
rro
r(mm)
Dynamic Stress(kPa)
(A) Curve Of Dynamic Displacement Error And Dynamic Stress
5 10 15 20 25 30 35
0.000 0.001 0.002 0.003 0.004
0.005 Vibration Frequency=3
Vibration Frequency=8 Vibration Frequency=14
Dy
na
m
ic S
tra
in E
rro
r
Dynamic Stress(kPa)
(B) Curve Of Dynamic Strain Error And Dynamic Stress Figure 10: Relation Of The Error Of Dynamic Displacement And Dynamic Strain To Dynamic Stress
2 4 6 8 10 12 14 16
0.0 0.1 0.2 0.3 0.4 0.5 0.6
Dynamic Stress=13Kpa Dynamic Stress=23Kpa Dynamic Stress=33Kpa
Dy
na
mi
c D
isp
lac
eme
nt
Er
ro
r(mm)
Vibration Frequency
(A) Relation Between Dynamic Displacement Error And Vibration Frequency
2 4 6 8 10 12 14 16
0.000 0.001 0.002 0.003 0.004 0.005
Dynamic Stress=13Kpa Dynamic Stress=23Kpa Dynamic Stress=33Kpa
Dy
na
m
ic S
tra
in E
rro
r
Vibration Frequency
[image:6.612.321.517.79.247.2](B) Relation Between Dynamic Strain Error And Vibration Frequency
Figure 11: Relation Of The Error Of Dynamic Displacement And Dynamic Strain To Vibration
Frequency
4.2. Dynamic Deformation and Damage Test
One of the salient advantages of digital image measurement is that it can directly obtain the axial and radial strain fields of the sample at any moment under a dynamic load, as shown in Figure. 12 and Figure. 13. From the surface deformation fields at different moments, the occurrence and expanding of soil deformation and the ultimate damage of the soil can be observed under a dynamic load. The deformation morphology can also be captured.
[image:6.612.109.294.96.285.2]
(A) Radial Strain Field At The Beginning (B) Axial Strain Field At The Beginning
Figure 12: Strain Field At The Beginning
(A)Radial Strain Field At The End (B) Axial Strain Field At The End
[image:6.612.99.288.303.447.2] [image:6.612.101.284.513.652.2]5. CONCLUSIONS
We have developed a geotechnical dynamic triaxial test loading system that uses the hydraulic servo technology and a built-in high-precision force sensor for effective stress collection, which can accurately reflect the deformation of soil samples under dynamic loads, and can provide a prerequisite for geotextile dynamic triaxial tests. The digital image processing method was performed on the geotextile dynamic load tests, a dynamic deformation measurement method was established based on image processing technology, and radial and axial deformation measurements were implemented. In addition, this method can also detect the dynamic axial strain and dynamic radial strain field of the samples at any moment, reflect the local deformation characteristics of sample more comprehensively, and enrich the deformation information on samples for measurement.
ACKNOWLEDGEMENT
The work described was completed in the Geotechnical laboratory at the Faculty of Engineering Mechanics, Dalian University of Technology. It was partially supported by National Natural Science Foundation of China (Grant No.50905022), National Hi-tech Research and Development Program of China (973 Program, Grant No.2010CB7315022), State Key Laboratory of Structural Analysis for Industrial Equipment special funds (Grant No.S09104), and the Fundamental Research Funds for the Central Universities (Grant No.DUT12LK21).The system in focus was produced at the Dalian university of Technology, Dalian, by Mr. Yong Sang and his co-workers. These contributions are gratefully acknowledged.
REFERENCES:
[1] H. L. Liu, Y. D. Zhou. and Y. F. Gao., “Study on the Behavior of Barge Ground Displacement of Sand due to Seismic Liquefaction”, Chinese Journal of Geotechnical Engineering, Vol. 24, No.3, 2002, pp. 142-146.
[2] White. D. J., Take. W. A., Bolton. M. D., “Measuring Soil Deformation in Geotechnical using Digital Images and PIV Analysis”, 10th
International Conference on Computer Methods and Advances in Geotechanics, Tucson, 2001, pp. 997-1002.
[3] Alishibli. K. A.,Sture.S., “Sand Shear Band Thickness Measurement by Digital Imaging Technique”, Journal of Computing in Civil Engineering, Vol. 13, No. 2, 1999, pp. 103-109.
[4] J H Liu, B. N. Hong, and H. B. Zhang, “A New Experimental Method of Soil Microstructure Changing Process”, Rock and Soil Mechanics, Vol. 24, No. 5, 2003, pp.744-747.
[5] B. Shi, H. T. Jiang, “Research on the Analysis Techniques for Clayey Soil Microstructure”, Chinese Journal of Rock Mechanics and Engineering, Vol. 20, No 6, 2001, pp. 864-870.
[6] J. Zhou, D. D. Shi, F Wu et al., “Visualized Cyclic Triaxial Tests on Sand Liquefaction using Digital Imagimg Technique”, Chinese Journal of Geotechnical Engineering, Vol. 33, No. 1, 2011, pp. 81-86.
[7] Y. H. Zhao, H. H. Liang, C Y Xiong et al., “Deformation Measurement of Rock Damage by Digital Image Correlation Method”, Chinese Journal of Rock Mechanics and Engineering, Vol. 21, No. 1, 2002, pp. 73-76. [8] Y. H. Li, H. W. Jing., “Software Development
of a Digital Speckle Correlation Method and its Application”, Journal of China University of Mining & Technology, Vol. 37, No. 5, 2008, pp. 635-640.
[9] D. Lei, P. Z. Qiao, A Li et al., “High-Speed Digital Image Correlation Studies for Dynamic Damage of Rock”, Journal of China Coal Society, Vol. 36, No. 2, 2011, pp. 274-277.
[10] W. B. Liu, Z. Y. Chen, L. J Su., “Study on the Triaxial Text of Reinforced Soil based on Digital Image Processing Technique”, China Civil Engineering Journal, Vol. 44, 2011, pp. 41-45.
[11] J. T. Wang, H. L. Cao, M. Y. Ding et al. “Digital Image Measurement of Specimen Deformation in Triaxial Test based on Digital Camera”, Journal of HUST, Vol. 6, 2004, pp.1-3,15.
[12] L T Shao, Z P Wang, Y L Liu. “Digital Image Processing Technique for Measurement of the local Deformation of soil Specimen in Triaxial Test”, Chinese Journal of Geotechnical Engineering, Vol. 24, No. 2, pp. 159-163.
[14] J. Wang and Y. Guo. “Deformation Study on Triaxial Specimen using the Digital Image Measuring System”, Northwestern Seismological Journal, Vol. 33, 2011, pp. 175- 180.
[15] N. Lin, We C Yu, James S. Duncan., “Combinative multi-scale level set framework for echocardiographic image segmentation”, Medical Image Analysis, Vol. 7, No. 4, 2003, pp. 529–537.
[16] J. Canny, “A Computational Approach to Edge Detection”, IEEE TransPAMI-8, Vol. 6, 1986, pp. 679-698.
[17] L F Zhou, Z X Hu, Y M Xiao et al. “A New Algorithm on Objects Boundary Tracking of Binary Image”, Micro-Computer Information, Vol. 23, No.(2-3), 2007, pp.259-261.
[18]Douglas D H,Peucker T K. “Algorithm for the Reduction of the Number of Points Required to Represent a Digitized Line or its Caricature”, The Canadian Cartographer, Vol.10, No.2, 2001, pp. 112- 122.
[19] Harris C, Satephoens M J. “A Combined Corner and Edge Detector”, In Alvey Vision Conference, Manchester, 1988, pp. 147-152. [20] Chiistoph Stock, Ulrich Muhlmann. “Subpixel