© 2017, IRJET | Impact Factor value: 5.181 | ISO 9001:2008 Certified Journal | Page 884
Static Analysis of the Roll Cage of an All-Terrain Vehicle (SAE BAJA)
Shivam Mishra
Undergraduate Student, Mechanical Engineering, Guru Nanak Dev Engineering College, Punjab (Ludhiana), India
---***---Abstract -
An all-terrain vehicle (ATV) as defined by theAmerican National Standards Institute (ANSI) is a vehicle that travels on low pressure tires, with a seat that is straddled by the operator, along with handlebars for steering control. Roll cage is the structural element of the vehicle. Load coming from the road bumps, cornering etc. are taken by the roll cage. It also protects the driver from the impacts and roll over inci-dents. The objective of the study is to design and optimize the roll cage under a set of particular rules given by Society of Automotive Engineers (SAE).Static analysis of the roll cage is done using ANSYS Workbench (static structural) for different collisions like front, side, rear and roll over.The main objective of analysis is to obtain a roll cage which should be very strong to bear such adverse conditions and at the same time it should be light in weight to improve the performance of vehicle
Key Words: SAE BAJA, ATV, Roll Cage, Static Structural,
Ansys workbench, Meshing, FEA.
1. INTRODUCTION
The objective of the study is to design and develop the roll cage for All-Terrain Vehicle.The design factor contains safe-ty, easy manufacturing, durability & maintenance of the frame and a compact, lightweight & ergonomic design.This paper focus on various loading tests like Front Impact, Rear Impact, Side Impact, Roll over to check whether the roll cage can bear all types of impacts. A software model is prepared in Solidwork software. Later the design is analysed against all modes of failure by conducting various simulations and stress analysis with the aid of Ansys Software. Based on the result obtained from these tests the design is modified ac-cordingly.
[image:1.595.61.266.653.717.2]Following are some of the factors which are taken into ac-count while designing the Roll Cage:
Table -1: Design Considerations
CONSIDERATIONS PRIORITY
Human Ergonomics HIGH Manufacturability ESSENTIAL STRENGHT/WEIGHT HIGH
2. Design and Development
The design and development process of the roll cage in-volves various factors; namely material selection,
cross-section determination, frame design, and finite element analysis.
2.1. Material Selection
To build roll cage steel must be used according to the rules. There are many different types of steel available. Material selected for the chassis is AISI 4130 steel.The roll cage will be made from tubular sections. Tubular sections offer supe-rior loading capabilities per kg when compared to solid sec-tions or square secsec-tions.
Table -2: Material Properties
Material Grade Alloy Steel AISI4130 Elastic Modulus 205GPa
(Outer Diameter)X
(Thickness) (mm) 31.75mmx1.65mm 25.4mmx1mm Tensile Strength 650MPa
Yield Strength 624MPa Bending Strength 690MPa Carbon Content 0.30%
2.2. Roll Cage Design
To begin the initial design of the frame, some design guide-lines were required to be set. They included intended trans-mission, steering and suspension systems and their place-ment, mounting of seat, design features and manufacturing methods. It is also required to keep a minimum clearance of 6 inches between the driver and the roll cage members. It is also necessary to keep weight of the roll cage as low as pos-sible to achieve better acceleration. It is necessary to keep the center of gravity of the vehicle as low as possible to avoid toppling.
Once modeling of the roll cage structure is done by using Solidwork, the designed roll cage is then evaluated in the
© 2017, IRJET | Impact Factor value: 5.181 | ISO 9001:2008 Certified Journal | Page 885
Fig -1: Top and Side View of Roll Cage
Fig -2: Physical parameters of chassis
Fig -3: Design Model of the Chassis, primary tube (red), secondary tube (green)
3. Analysis Methodology
Once modeling of the roll cage structure is done by using Solidwork, this design is checked by Finite Element Analysis. Ansys Workbench has been used for this purpose. A coordi-nate file is created in notepad and that has been imported in Ansys via import geometry, then specified material, defined the cross-section.
4. FEM Analysis
As the Roll cage was developed by plotting key points, so every member of the roll cage is considered to be properly constrained at every joint.After finalizing the frame along with its material and cross section, it is very essential to test the rigidity and strength of the frame under severe condi-tions. The frame should be able to withstand the impact, tor-sion, roll over conditions and provide utmost safety to the driver without undergoing much deformation. Following tests were performed on the roll cage:
(1) Front Impact, (2) Rear Impact, (3) Side Impact, (4) Front roll over, (5) Side roll over, (6) Front Bump and (7) Rear Bump
4.1. Meshing
The result of any FEA software depends mainly upon the kind and the quality of the mesh. Mesh size is calculated by checking the mesh independency, mesh size has been calcu-lated by plotting the mesh convergence curve.
Following are some points that are considered during mesh generation:
Midside node has been used for better accuracy.
Pipe Idealization is applied on bends to get accu-rate results.
Fine meshing is done particularly in areas having higher stress gradient.
[image:2.595.37.288.96.273.2] [image:2.595.35.290.304.491.2] [image:2.595.36.296.519.727.2] [image:2.595.306.558.585.744.2]© 2017, IRJET | Impact Factor value: 5.181 | ISO 9001:2008 Certified Journal | Page 886
4.2. Front Impact Analysis
This analysis is done to simulate those conditions when the ATV may hit a tree, another ATV or a wall. Under such condi-tions, the amount of forces generated reacts at the front most portion of vehicle.
Analysis Condition:
Using the projected vehicle + driver mass of 220 kg, the impact force was calculated base on a G-load of 10, was applied to the front most members of chas-sis.
Rear suspension points are fixed.
F = ma …. (1)
10F = 220*9.81*10 = 21,582 N (approx).
Fig -5: Front Impact Displacement
Fig -6: Front Impact Stress
Result discussion- Maximum combined stress induced is 274.98MPa. Hence FOS =2.269 with maximum deformation of 5.4372mm which is within the permissible limit.
4.3. Rear Impact Analysis
This analysis is done to simulate those conditions when an-other ATV is going to hit ATV on its rear part. Under such conditions, the amount of forces generated reacts at the rear most portion of vehicle.
Analysis Condition:
Using the projected vehicle + driver mass of 220 kg, the impact force was calculated base on a G-load of 10, was applied to the rear most members of chas-sis.
Front most nodes are fixed.
F = ma …. (1)
10F = 220*9.81*10 = 21,582 N (approx).
Fig -7: Rear Impact Displacement
[image:3.595.305.559.299.493.2] [image:3.595.39.285.302.476.2] [image:3.595.39.570.489.714.2] [image:3.595.228.551.529.722.2]© 2017, IRJET | Impact Factor value: 5.181 | ISO 9001:2008 Certified Journal | Page 887
Result discussion- Maximum combined stress induced is 130.4MPa. Hence FOS =4.785 with maximum deformation of 2.172mm which is within the permissible limit.
4.4. Side Impact Analysis
This analysis is done to simulate those conditions when an-other ATV will hit ATV on side. Under such conditions, the amount of forces generated reacts at the side most portion of vehicle.
Analysis Condition:
Using the projected vehicle + driver mass of 220 kg, the impact force was calculated base on a G-load of 5, was applied to the one of side most members of chassis.
Other side of nodes are fixed.
F = ma …. (1)
5F = 220*9.81*5 = 10,791 N (approx).
[image:4.595.305.560.347.527.2]Fig -9: Side Impact Displacement
Fig -10: Rear Impact Stress
Result discussion- Maximum combined stress induced is 222.23MPa. Hence FOS =2.807 with maximum deformation of 7.26mm which is within the permissible limit.
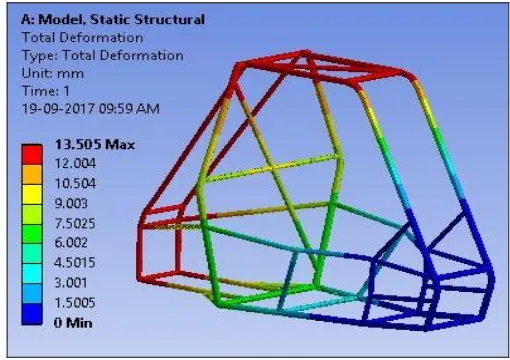
4.5. Front Roll Analysis
This analysis is done to simulate those conditions when the ATV is considered to be dropped on its roof on road or ground from a height. Under such conditions, the amount of forces generated reacts at the top most portion of vehicle.
Analysis Condition:
Using the projected vehicle + driver mass of 220 kg, the impact force was calculated base on a G-load of 2.5, was applied to the Front Lateral Cross members of chassis.
Base Plane members are fixed.
F = ma …. (1)
2.5F = 220*9.81*2.5 = 5,395.5 N (approx).
Fig -11: Front Roll Displacement
[image:4.595.40.288.349.527.2] [image:4.595.45.562.558.745.2]© 2017, IRJET | Impact Factor value: 5.181 | ISO 9001:2008 Certified Journal | Page 888
Result discussion- Maximum combined stress induced is 243.2MPa. Hence FOS =2.56 with maximum deformation of 13.505mm which is within the permissible limit.
4.6. Side Roll Analysis
This analysis is done to simulate those conditions when the ATV rolls sideways due to some excessive cornering angle. Under such conditions, the amount of forces generated re-acts at the Side most portion of vehicle.
Analysis Condition:
Using the projected vehicle + driver mass of 220 kg, the impact force was calculated base on a G-load of 5, was applied to the Side members of chassis.
Base Plane members are fixed.
F = ma …. (1)
[image:5.595.34.566.277.797.2]5F = 220*9.81*5 = 10,791 N (approx).
[image:5.595.308.560.300.503.2]Fig -13: Side Roll Displacement
Fig -14: Side Roll Stress
Result discussion- Maximum combined stress induced is 62.632MPa. Hence FOS =9.96 with maximum deformation of 1.347mm which is within the permissible limit.
4.7. Front Bump Analysis
This analysis is done to simulate those conditions when the front wheels of ATV pass over a bump, roll cage is subjected to a moment.
Analysis Condition:
40% of the vehicle weight (863.28 N) is equally dis-tributed to front suspension mounting member.
[image:5.595.38.288.339.520.2] Rear suspension mounting member of roll cage is fixed.
Fig -15: Front Bump Displacement
[image:5.595.61.555.538.750.2]© 2017, IRJET | Impact Factor value: 5.181 | ISO 9001:2008 Certified Journal | Page 889
Result discussion- Maximum combined stress induced is 82.085MPa. Hence FOS =7.60 with maximum deformation of 2.732mm which is within the permissible limit.
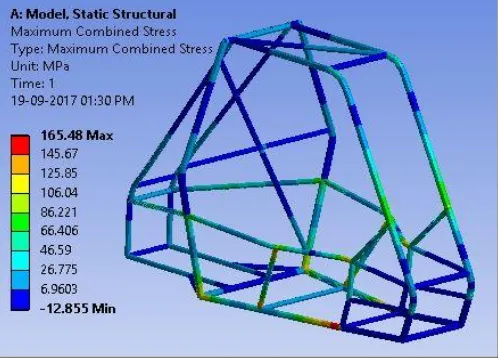
4.8. Rear Bump Analysis
This analysis is done to simulate those conditions when the rear wheels of ATV pass over a bump, roll cage is subjected to a moment
Analysis Condition:
60% of the vehicle weight (1,294.92 N) is equally distributed to rear suspension mounting member.
[image:6.595.38.288.302.477.2] Front suspension mounting member of roll cage is fixed.
Fig -17: Rear Bump Displacement
Fig -18: Rear Bump Stress
Result discussion- Maximum combined stress induced is 165.48MPa. Hence FOS = 3.77 with maximum deformation of 8.887mm which is within the permissible limit.
5. Results of Analysis
[image:6.595.38.287.515.696.2]The results of the above analysis have been tabulated be-low:-
Table -3: Analysis Result
Front
Impact Rear Impact Side Impact Front roll Side Roll Front Bump Rear Bump
Stress 274.9 130.4 222.2 243.2 62.6 82.08 165.4
Displace place-ment
5.43 2.17 7.36 13.50 1.34 2.732 8.88
F.O.S 2.26 4.78 2.80 2.56 9.96 7.60 3.77
6. Conclusion
The FEA analysis demonstrated the structural superiority while maintaining a lower weight to strength ratio. Safety is of utmost concern in every respect; for the driver, crew & environment. The analysis was helpful in finding out the maximum deformation, Von Mises stress and the factor of safety.
The design of the vehicle is kept very simple keeping in view its manufacturability. The design, development and fabrica-tion of the roll cage is carried out successfully. The roll cage is used to build an ATV by integrating all the other automo-tive systems like transmission, suspension, brakes, steering, etc.
REFERENCES
[1] BAJA SAE INDIA Rulebook , 2018. [2] Automobile Engineering, Kirpal Singh.
[3] Popov,“Engineering Mechanics of solid”,Pearson. [4] Shigley’s, “Mechanical Engineering Design”. [5] Pratical finite Element Analysis, Nitin S Gokhale.
BIOGRAPHIES
Shivam Mishra is currently in 3rd year