http://dx.doi.org/10.4236/ajibm.2015.54017
How to cite this paper: Mao, H.Q., Jin, X.Y. and Zhu, L. (2015) Methods of Measuring Influence of Bank Customer Using So-cial Network Model. American Journal of Industrial and Business Management, 5, 155-160.
http://dx.doi.org/10.4236/ajibm.2015.54017
Methods of Measuring Influence of Bank
Customer Using Social Network Model
Huaqing Mao, Xinyuan Jin
*, Li Zhu
Oujiang College, Wenzhou University, Wenzhou, China
Email: [email protected], *[email protected], [email protected]
Received 9 March 2015; accepted 5 April 2015; published 8 April 2015
Copyright © 2015 by authors and Scientific Research Publishing Inc.
This work is licensed under the Creative Commons Attribution International License (CC BY). http://creativecommons.org/licenses/by/4.0/
Abstract
As the development of economic today, Bank business deeply integrates into our lives. Thousands of transactions generate the large amounts of data. Traditional bank customer management sys-tem simply classifies and counts these data, and the syssys-tem is deficient in customer relationship management. However, the social network model can provide the influence between the bank customers for the bank. In this paper, we construct a social network by calculating the relation-ship between bank customers. In order to explore how bank customers in the bank customer network affect each other, we use three indicators: the average path length L, clustering coeffi-cient C and degree distribution p (x) to conduct a comprehensive analysis. Consequently, we find that there evidently exist influential customers in this network.
Keywords
Social Network Model, Influence Analysis, Bank Customer Management
1. Introduction
With the progress of financial science and technology, a large number of efficient computer application systems arise at the historic moment. Those applications are used in bank business widely, which greatly improves the service quality, and benefits for the efficiency and quality of service processing [1]-[5]. In the meantime, the rapid developments of information technology and cyber economy cause the strong business competition of bank. The scale advantage formed by expansion of financial organization is fading away. The development of bank is turning from pursuing scale advantage into digging customer advantage, and provides the different ser-vice and production to different customers [6]-[9]. Therefore, how to determine the influence and importance of customer and identify the value of customer become the core issues. The effective method and the theory to
• Each customer made the same influence to any of the other customers.
• The relationship between the influence of the customer and the frequency of his cooperation with Bank is linear.
2.2. Conventions
In our social network model, we made the following conventions:
• The average path length L is the mean value of he path length in the network between any pair of nodes.
• Clustering coefficient Ci. It describes the network connection nodes in the network between neighboring
nodes connected to measure the likelihood of any one of the network nodes. In other words, it is the ratio that neighboring nodes are actually connected to edges and the theoretical side edges.
• Degree of node degree distribution p (k) as the probability of node k. That is the number of nodes of degree k appears with the number of nodes in all degrees appeared ratio.
• Degree centrality CD. By calculating the point of the degree, makes clear who is the central character in the
team, that is, who is the most powerful and influential person in the team. We use the number of contact to indicate the degree of the nodes, for node = ai, the degree of the nodes = d (ai).
• Degree centrality with the weights Cw (ai). Sowiis made to serve as the weights of the node ai considering the
influence by the weights of the direct link node of ai upon ai.
3. Social Network Analysis of Bank Customer
3.1. Establish the Model
Studying social network of bank customer, namely the establishment of the social network model of the rela-tionship (hereinafter referred to as social network model). In order to establish the social network model, we need to get all inter-linked customer with a known customer named Li. Those customers who are not directly connected with Li should be excluded from the model. In addition, because of their influence can be ignored, customers who are not connected with most of the customers (secondary customers of connected components) should also be excluded from the model. The above approach, simplifying the model won’t have much impact on the results. Finally, the remaining customers are sorted in alphabetical order numbers. Steps are as follows:
Step 1: Importing data.
Step 2: Delete customers who are not directly connected with Li. Step 3: Get the link between the customers (not including Li).
Step 4: Keep the main branch connectivity (Delete the secondary branch connectivity). Step 5: The customers are sorted in alphabetical number.
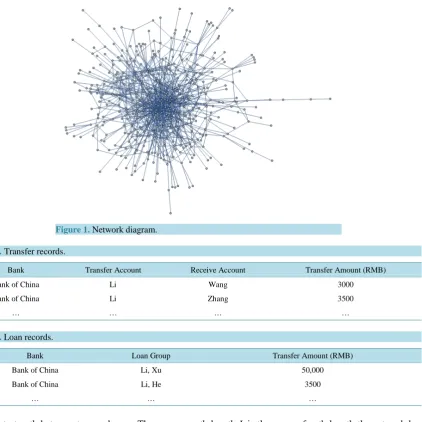
Step 6: Draw network diagrams (Shown in Figure 1).
The data of bank records have two types (Shown in Table 1 and Table 2), one is the transfer records, and the other is loan records. Those two types of records contain the information about the relationship between the bank customers.
To build a social network for analysis, we select the characteristic attributes of several networks as following sections:
3.2. Average Path Length
Figure 1. Network diagram.
Table 1.Transfer records.
Bank Transfer Account Receive Account Transfer Amount (RMB)
Bank of China Li Wang 3000
Bank of China Li Zhang 3500
… … … …
Table 2.Loan records.
Bank Loan Group Transfer Amount (RMB)
Bank of China Li, Xu 50,000
Bank of China Li, He 3500
… … …
the shortest path between two nodes on. The average path length L is the mean of path length the network be-tween any pair of nodes, which is calculated as follows:
(
1 1)
i j ijL l
N N ≠
=
−
∑
(1)The average length determines the size of the effective cable network, which reflects the average degree of separation of the network, describes the randomness and dynamics of the network, indicating that the new in-formation and the fastest dissemination speed of relationship between two customers [13]. The longer the short-est path between two customers is, the slower relationship transmission speed will be and the lower the rate of relationship acquisition will be accordingly, but for shorter-distance networks, the network connection will be relatively stronger with a stronger stability.
3.3. Clustering Coefficient
In the above formula, N is the number of nodes in the network. The average clustering coefficient is an im-portant global indicator in a complex network. Obviously, C 0,1∈
[ ]
. When C = 0, all nodes are isolated points. When C = 1, the network between any two nodes is directly connected.3.4. Degree Distribution
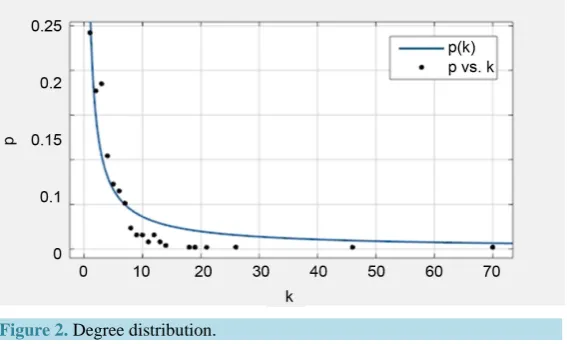
The node of degree distribution is an important statistical property for network. A node is the number of other nodes directly connected to the node. We define the degree of node degree distribution p (k) as the probability of node k. It reflects the complexity of the network connection between nodes and edges, and it is the overall de-scription of the nature of the network.
3.5. Results and Analysis
Obtained by calculation:The number of nodes of the network is 508, the average path length is 4.3, and the clustering coefficient is 0.05.Figure 2 shows that the formula of degree distribution for the p (k) = 0.27k-0.88 is a power law distribution.
This network has 508 nodes, and the average path length is 4.3, which shows that the customers’ relationship is close. The clustering coefficient is only 0.05, indicating that the direct relationship shows the evacuation among the authors. Viewed from above data we find that the relationship between these network customers is primarily indirect. It means only few customers maintain the overall relationship of the network, that is to say, they may have greater influence in the network. By observing the degree distribution and based on the characte-ristics of power law distribution we finally get this conclusion.
4. Centrality Analysis of Social Network Model
Centrality is one of the main analysis indicators of social network analysis methods. Researchers often use de-gree centrality (CD) to check the actors’ position in the network, which, to some extent, tells whether the actors
are important or not and measures their superiority and social status and reputation [16] [17].
Degree centrality, by calculating the point of the degree, makes clear who is the central character in the team, that is, who is the most powerful and influential person in the team. If a point is directly connected with a num-ber of other points, it will have a higher CD. In other words, this point will be in the center of the network, being
closer to the other actors in the network. We use the number of contact to indicate the degree of the nodes, for node = ai, the degree of the nodes = d (ai), we get:
( )
( )
1
i
D i
d a
C a
N =
− (4)
In the above formula: N = total network journals (node); N − 1 = the maximum degree of any node.
While measuring the degree centrality on the basis of the node degree, we should note that this measurement does not take the information known to the node itself into consideration, which may affect the validity of the conclusions. Therefore, we improve the degree centrality, adding the concept of node weights to it.
Figure 2. Degree distribution.
tact with him or her.
So, wi is made to serve as the weights of the node aiconsidering the influence by the weights of the direct link
node ai of upon ai. Modifying the Formula (4), we get:
( )
1-1
m
ij j
w i i
w
C a w
N =
=
∑
(5)In the Formula (5):
Cw (ai) is the weights that have a direct link between ai and the node set.
wij and ai are directly connected with the right node weight aij.
m is degree of ai.
5. Conclusions
Social network analysis has been an important part of social studies. Social network analysis methods employed by this paper to conduct customers’ network analysis from the average path length, the clustering coefficient, the centrality and the calculation method are hereby improved. Meantime, this paper puts forward weighting cen-trality, providing a brand-new perspective for customers’ network analysis.
As the data used this paper are accurate and easy to obtain, it guarantees the accuracy of the model to some extent. Our model effectively achieves all of the goals we have set initially. It is fast and can handle large quan-tities of data. The main advantage of our model is that it has great flexibility, and its calculation method is sim-ple, easy to be spread to other areas and fields.
While our approaches and models can extend and expand the results, there remain several types of weak-nesses in our models:
Some special data can’t be found, so we have to do some proper assumptions before the solution is found for our models. A more abundant data resource can guarantee a better result in our models.
Acknowledgements
This work was supported by Soft Science Research Project of Zhejiang Province (2014C35060), Department of Education of Zhejiang Province’s Research Project (Y201430369), Zhejiang Provincial Natural Science Foun-dation of China (LQ13D010001).
References
[1] Luo, Y.H. (2009) Research and Application of Scale-Free Network Model. Master Thesis, Donghua University, Shang- hai.
gence, 28,15-17.
[9] Zuo, M.Y., Wen, X.W. and Hua, X.Q. (2012) Analysis on Co-Authorship Network of Scholars in Knowledge Man-agement. Journal of Information Resources Management, 4, 4-15.
[10] Erdős, P. and Rényi, A. (1960) On the Evolution of Random Graphs. Publication of the Mathematical Institute of the Hungarian Academy of Sciences, 5, 17-61.
[11] Albert, R., Jeong, H. and Barabási, A.L. (1999) Internet: Diameter of the World-Wide Web. Nature, 401, 130-131.
http://dx.doi.org/10.1038/43601
[12] Barabási, A.L. and Albert, R. (1999) Emergence of Scaling in Random Networks. Science, 286, 509-512.
http://dx.doi.org/10.1126/science.286.5439.509
[13] Otte, E. and Rousseau, R. (2002) Social Network Analysis: A Powerful Strategy, Also for the Information Sciences.
Journal of Information Science, 28, 441-453. http://dx.doi.org/10.1177/016555150202800601
[14] Bar-Ilan, J. (2008) Informetrics at the Beginning of the 21st Century—A Review. Journal of Informetrics, 2, 1-52.
http://dx.doi.org/10.1016/j.joi.2007.11.001
[15] Everett, M.G., Sinclair, P. and Dankelmann, P. (2004) Some Centrality Results New and Old. Journal of Mathematical Sociology, 28, 215-227. http://dx.doi.org/10.1080/00222500490516671
[16] Carrington, P.J., Scott, J. and Wasserman, S. (2005) Models and Methods in Social Network Analysis. No. 28, Cam-bridge University Press, CamCam-bridge. http://dx.doi.org/10.1017/CBO9780511811395
[17] Freeman, L.C. (1979) Centrality in Social Networks Conceptual Clarification. Social Networks, 1, 215-239.