© 2017, IRJET | Impact Factor value: 5.181 | ISO 9001:2008 Certified Journal | Page 2345
Experimental investigation of machining parameters using solid and
hollow electrode for EDM of Ti-6Al-4V
V.S.Nimbalkar
1, Prof. M.T.Shete
21Post Graduate Scholar, Department of Mechanical Engineering, Government College of Engineering,
Amravati(Maharashtra),India.
2Assistant Professor, Department of Mechanical Engineering, Government College of Engineering,
Amravati(Maharashtra),India.
---***---Abstract - In this project, Taguchi analysis is used to investigate the effect of three important EDM parameters those are namely: discharge current (Ip), pulse-on-time
(Ton) and gap voltage (V) on Surface Roughness (Ra) of on Electrical Discharge Machined surface. In this study orthogonal array (L9) used for experimentation model and the influence and contribution of process parameters on the responses is been studied with the help of Analysis of Variance (ANOVA) and compared it with mathematical model for validation. A experiment was well designed and it was used to reduce the total number of experiments. Experiment was done on Ti-6Al-4V (Titanium alloy) and copper solid and copper hollow electrodes were used as tool. The response is modeled using Taguchi analysis on experimental values obtained.
Key Words:Electrical Discharge Machining, Titanium alloy,Tool Wear Rate(TWR),Material removal rate
(MRR), Surface Roughness (SR),Taguchi
methodology,ANOVA analysis ,MINITAB 17.
1. INTRODUCTION
Electrical discharge machining also known as EDM has been proven as an alternative process for machining complex and intricate shapes from the conductive ceramic composition. It is a non-conventional machining method. In electrical discharge machining process electrical energy is used to cut the material to final shape and size. Efforts are made to utilize the whole energy by applying it at the exact spot where the operation needs to be carried out. There is no mechanical pressure existing between work piece and electrode as there is no direct contact. Any type of conductive material can be machined using EDM irrespective of the hardness or toughness of the material[2].
2.EDMPROCESSPARAMETERS
The process parameters that influence while electric discharge machining are listed below:
i)Discharge current - It points out the different levels of power that can be supplied by the generator of the EDM machine and represents the mean value of the discharge current intensity.
ii)Pulse-on time - It is the duration of time (µs) the current is allowed to flow per cycle. Material removal is directly proportional to the amount of energy applied during this pulse-on time. This energy is controlled by the discharge current and the duration of the pulse-on time.
iii)Duty cycle - It is a percentage of the pulse-on time relative to the total cycle time. This parameter is calculated by dividing the pulse-on time by the total cycle time (pulse-on time plus pulse-off time). The result is multiplied by 100 for the percentage of efficiency, called duty cycle[5].
3. EDM PERFORMANCE PARAMETERS
The effectiveness of EDM process is evaluated in terms of its machining characteristics. The short product development cycles and growing cost pressures have forced the die and mould making industries to increase the EDM efficiency. The EDM efficiency is measured in terms of its machining characteristics viz. material removal rate, surface roughness and tool wear rate. The most important machining characteristics considered in the present work are:
i)Surface Roughness (Ra): Surface finish is an
© 2017, IRJET | Impact Factor value: 5.181 | ISO 9001:2008 Certified Journal | Page 2346
Where ‘L’ is the length taken for observation and ‘Y’ is the ordinate of the profile curve.
ii)Material removal rate (MRR): Material removal rate is a desirable characteristic and it should be as high as possible to give least machine cycle time leading to increased productivity. Material removal is the difference of weight of work-piece before machining and after machining. It is calculated by the formula as given below.
mm3/ min
Where, is the initial weight of work-piece in g;
is the final weight of work-piece after machining in g; is the machining time in minutes
and is the density of work piece material.
iii)Tool Wear Rate (TWR):Tool wear rate is the difference of electrode weight before and after machining and is expressed as:
mm3/min
Where, Ei is the initial weight of electrode in g; Ef is
the final weight of electrode after machining in g; t
is the machining time in minutes and is the
density of electrode material[5].
4. DETAILS EXPERIMENTAL SET UP
It consists of EDM machine tool used during experimentation, measuring equipment’s like surface roughness tester, digital weighing machine, work material, tool material and dielectric medium used to perform the experiments.
4.1 Machine Tool
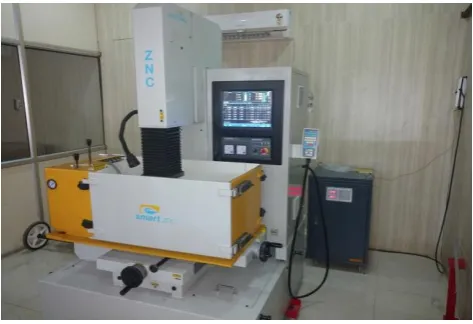
The experimental investigations were carried out on a die-sinking EDM machine (S 50 Spark Generator) of ELECRONICA ZNC India Ltd. Pune, installed at Mechanical Department. Govt. College of
Engineering, Amravati, Maharashtra, India.
ELECTRONICA S 50 spark generators are fitted with anti-arc circuits to prevent any damage to the electrodes and the work piece due to prolonged DC arcing in the spark gap. The machine has additional
[image:2.595.319.556.287.449.2]features like digital readout system, adjustable collets, adjustable current selector switch, adjustable pulse-on and pulse-off settings, auto quill movement, voltmeter and ammeter to record breakdown voltage and discharge current respectively. The machine has a dither (edge finder) system, an audio visual signal device to facilitate the positioning of the electrode and the work piece. All the controls are easily accessible in the front of the generator and circuitry is protected from thermal effects by an efficient cooling system with exhaust fans. The machine can be run on either positive polarity or negative polarity.
Figure 4.1: die- sinking EDM Tool
4.2 Work Piece Material
Titanium alloy is increasingly used in many industrial and commercial applications because of its excellent properties. Titanium alloy finds enormous applications in chemical industry, machine building, shipbuilding and auto industry apart from the fabrication of equipment for the oil and gas industry, food industry, medicine and civil engineering. The largest consumer of titanium alloys is the aerospace industry.Non conventional thermo-electric spark erosion machining process, commonly known as electric discharge machining (EDM) has been success-fully used to machine titanium and its alloys effectively regardless of their chemical and mechanical properties[1].
© 2017, IRJET | Impact Factor value: 5.181 | ISO 9001:2008 Certified Journal | Page 2347
Table 4.1: Chemical Composition of the work
material
Elements Al Fe O Ti V
Percentage
% 6 0.25 Max Max 0.20 90 4
Table 4.2: Thermal properties of the work material
Thermal conductivity
(W/mk) Melting point(
0C)
7.2 1649
5. DESIGN OF EXPERIMENT
5.1 Taguchi Design of Experiment based
Orthagonal array
The choice of points where experiments are performed has very large effect on the accuracy of the response surface. The method for selecting a good set of points for carrying out experiments is known as design of experiments. According to Design of Experiments (DoE) methodology, experiments are designed in which design domain is bounded by upper and lower limits of the factor. It is an effective and systematic approach to experimentation that considers all the factors simultaneously and predicts response over a wide range of values. DoE provides information about the interaction of factors and the way the total system works, something not obtainable by testing one factor at a time (OFAT) while holding other factors constant. Another advantage of DoE is that it shows how interconnected factors respond over a wide range of values, without requiring the testing of all the possible combinations of the factorial values directly. Thus, it drastically reduces the number of experiments to be conducted. Most of the experiments were done by using this method because it reduces the time and money consuming experiments.
Following parameters were kept constant during the experiments:
i) Work Material: Ti-6Al-4V
ii) Electrode material: Copper
iii) Electrode Polarity: Negative.
iv) Work material polarity: Positive.
v) Spark voltage: 50 V, DC.
vi) Flushing type: Submerged in dielectric.
vii) Machining depth: 1.00 mm.
[image:3.595.38.275.138.188.2]viii) Dielectric : EDM oil (Grade 30)
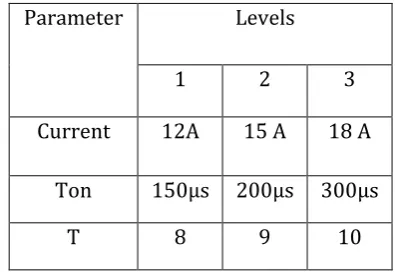
Table 5.1.1 Shows the level and parameter
Parameter Levels
1 2 3
Current 12A 15 A 18 A
Ton 150µs 200µs 300µs
T 8 9 10
Table. 5.1.2 Generation of DOE by using Taguchi Method L9 Array is as Below.
Sr.no Current Ton T
1 12 150 8
2 12 200 9
3 12 300 10
4 15 150 9
5 15 200 10
6 15 300 8
7 18 150 10
8 18 200 8
[image:3.595.337.535.201.339.2] [image:3.595.358.517.412.697.2]© 2017, IRJET | Impact Factor value: 5.181 | ISO 9001:2008 Certified Journal | Page 43
6. PERFORMANCE ANALYSIS:
6.1 Experimentation
Work piece material selected for experimentations was titanium alloy (Ti-6Al-4V) alloy whereas tool materials were Copper solid and copper hollow . Experiments were designed and conducted according to DoE methodology. Experimentation was carried out to investigate the effect of discharge current, pulse-on time and duty cycle on the machining characteristics e.g. surface roughness, material removal rate and tool wear rate.
6.2 Actual experimentation
After Performing the Experiments the data related to MRR, TWR and SR are collected as below.
A. Electrode material – copper (solid)
B.Electrode material –copper (Hollow)
6.3Statistical and Regression analysis
A. Electrode – Copper SOLID
i) MRR
Regression equation
MRR = 0.00157 + 0.000164 current + 0.000003 ton + 0.000015 duty cycle
1 8 1 5 1 2 -45.0
-45.5
-46.0
-46.5
-47.0
300 200
1 50 8 9 1 0
current
M
ea
n
of
S
N
r
at
io
s
ton duty cycle
MRR(coppersolid tool) -Main Effects Plot for SN ratios
Data Means
Signal-to-noise: Larger is better
Graph 6.3.1 Main effect plot for SN ratio MRR – copper solid
Exp no
MRR (gm/min)
TWR (gm/min)
SR (Ra in µm)
1. 0.00428 0.000581 9.2
2. 0.00446 0.000637 9.4
3. 0.00497 0.000598 10.1
4. 0.00433 0.000911 11.3
5. 0.00446 0.000939 10.6
6. 0.00460 0.001060 13.0
7. 0.00522 0.001410 13.4
8. 0.00568 0.001170 12.5
9. 0.00576 0.001500 10.3
Exp
no MRR (gm/min) TWR (gm/min) SR (Ra in µm)
1. 0.00136 0.000080 9.3
2. 0.00365 0.001690 9.5
3. 0.00280 0.000874 9.7
4. 0.00424 0.003190 11.3
5. 0.00256 0.001850 12.4
6. 0.00372 0.002260 13.3
7. 0.00305 0.003280 13.0
8. 0.00416 0.003630 13.3
© 2017, IRJET | Impact Factor value: 5.181 | ISO 9001:2008 Certified Journal | Page 44
The graph 6.3.1 shows that as the current increases the MRR decreases slightly and then suddenly increases to maximum, as the pulse on time increases the MRR increases linearly and as the duty cycle increases the MRR first slightly decreases and then increases.
ii) 1.2 TWR
Regression Equation
TWR = -0.001368 + 0.000126 current
+ 0.000001 ton + 0.000023 duty cycle
Graph 6.3.2 Main effect plot for SN ratio TWR – COPPER SOLID
The graph 6.3.2 shows that as the current increases the TWR decreases, as the pulse on time increases the TWR decreases and as the duty cycle increases the TWR is decreases first and then slightly increases.
iii) SR
SR = 4.9916 + 0.417 current 0.00052 ton 0.100 duty cycle
Graph 6.3.3 Main effect plot for SN ratio SR - Brass
The graph 6.3.3 shows that as the current increases the SR value decreases, as the pulse on time increases the SR value first increases and then decreases and as the duty cycle increases the SR value first increases and then decreases.
B. Electrode – Copper HOLLOW
i) MRR
Regression equation
MRR = 0.00231 + 0.000146 current + 0.000002 ton - 0.000138 duty cycle
Graph 6.3.4 Main effect plot for SN ratio MRR - Copper
The graph 6.3.4 shows that as the current increases the MRR increases at first and then becomes constant, as the pulse on time increases MRR at first increases then decreases and as the duty cycle increases the MRR at first increases and then decreases.
ii) TWR
Regression equation
© 2017, IRJET | Impact Factor value: 5.181 | ISO 9001:2008 Certified Journal | Page 45
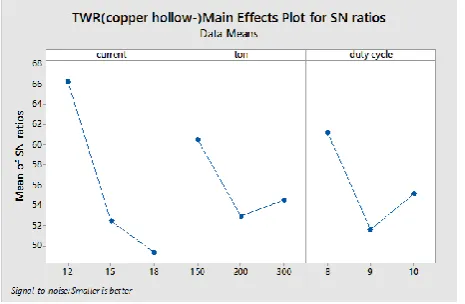
Graph 6.3.5 Main effect plot for SN ratio TWR – Copper
The graph 6.3.5 shows that as the current increases the TWR decreases, as the pulse on time increases the TWR first decreases and then increases and as the duty cycle increases the TWR first decreases and then increases.
iii) SR
Regression equation
SR = 2.638 + 0.622 current + 0.00590 ton 0.133 duty cycle
Graph 6.3.6 Main effect plot for SN ratio SR – Copper
The graph 6.3.6 shows that as the current increases the SR value decreases, as the pulse on time increases the SR value decreases and as the duty cycle increases the SR value increases and then decreases.
7. CONCLUSION
In this study the experiment was conducted by considering three variable parameters namely current, pulse on time and duty cycle. The objective was to study the effects of the variable parameters on these characteristics; Material Removal Rate, Surface Roughness and Tool wear rate. The tool material was taken as copper solid tool and copper hollow tool and the workpiece was chosen as Ti-6Al-4V . Taguchi’s signal to noise ratio is applied in
this work to improve the performance
characteristics such as MRR, TWR and SR on the asTi-6Al-4V alloy during EDM process.The conclusion of this work are summarized as follows
[image:6.595.43.276.100.252.2]A) For copper solid tool
Table 7.1 The optimal parameters combination when copper solid was used as electrode
Sr.no Ip
T-on t from SN Value
ratio
Value from regressio
n equation
% erro
r
1.MR
R 18 300 10 0.0058222 0.005572 4.29
2.TW
R 12 200 8 0.0005008 0.0005274 5.05
3.SR 1
2 20
0
[image:6.595.39.280.469.625.2]9 8.55556 8.9916 4.85
Table 7.2 The optimal parameters combination when copper hollow tool was used as electrode
Sr.no Ip
T-on t Value from SN
ratio
Value from regressio n
equation % erro r
1.MR
R 18 200 9 0.0042456 0.004100 3.42
2.TW
R 12 150 8 0.0005627 0.0005368 4.6
3.SR 1
2 15 0
9 8.72222 9.20 5.19
© 2017, IRJET | Impact Factor value: 5.181 | ISO 9001:2008 Certified Journal | Page 46
brass and copper tool electrodes. The changes in magnitudes of MRR and TW have been compared. Surface characteristics of hole surfaces have also been examined .The following conclusions have been reached:
A) Incase of Ti-6Al-4V when Copper solid
electrodes are use for machining-
By analysing the results of the experiments on Ti-6Al-4V when Copper solid electrodes materials, the following conclusions are arrived at:
Current is the most influencing process parameter is observed .Material removal rate gets increased with the increasing current drastically. Tool wear rate decreases by the increasing current. Also With increase in pulse on time, material removal rate gets linearly increased .
B) Incase of Ti6Al4V when Copper hollow
electrodes are use for machining.
By analysing the results of the experiments on Ti6Al4V with Copper hollow electrode materials, the following conclusions are arrived at:
The MRR, EWR and SR increased when the current increased.Copper electrode offers low electrode wear. It is also observed that the thermal conductivity of electrode material plays a major role in electrode wear. Copper electrode undergoes less wear because higher thermal conductivity facilitates rapid heat transfer through the body of the electrode.
REFERENCES
[1] Anoop Kumar Singh ,Sanjeev Kumar ,V.P Singh
,Electrical Discharge Machining Of Superalloys :A Review ,IJRMET Vol 3,Issue 2 ,May-Oct 2013 |ISSN : 2249-5762|
[2] J.P.Nobre ,J.C.Outeiro ,Evaluating Residual
Stresses Induced By Drilling Of Ti-6Al-4V Alloy By Using Experimental-Numerical Methodology
,15th CIRP Conference on Modelling of
Machining Operations ,Procedia CIRP 31 (2015) 215-220.
[3] A.T.Bozdana O.Yilmaz,M.A..Okka.I.H.Filiz ,A
Comparative Experimental Study On Fast Hole
EDM Of Inconel 718 And Ti-6Al-4v,5th
international conference and exhibition on design and production of machines and dies and moulds.18-21 June 2009.
[4] Mitali Mhatre.Sagar U.Sapkal And Raju
S.Pawade ,Electro Discharge Machining
Characteristics Of Ti-6Al-4v Alloy:A Grey Relational Optimization ,International
Conference On Advances In Manufacturing And Materials Engineering.AMME 2014,Procedia Materials Science 5 (2014)2014-2022.
[5] A.W.S.Ram.Prasad,Koona Ramji,G.L.Dutta,An
Experimental Study Of Wire EDM On Ti-6Al-4V Alloy, International Conference On Advances In Manufacturing And Materials
Engineering.AMME 2014,Procedia Materials Science 5 (2014)2567-2576.
[6] Goutam Devaraya Revankar, Raviraj Shetty,
Shrikantha Srinivas Rao ,Vinayak Neelakanth Gaitonde ,Wear resistance enhancement of titanium alloy(Ti–6Al–4V) by ball burnishing process,JMRTEC-212.
[7] Apiwat Muttamara, Comparison Performances
of EDM on Ti6Al4V with Two Graphite Grades, International Journal of Chemical Engineering and Applications, Vol. 6, No. 4, August 2015.
[8] SaeedDaneshmand,EhsanFarahmand
Kharizi,Esmail Abedi,M.Mir Abdolhosseini ; Influence Of Machining Parameters On Electro Discharge Machining Of Niti Shape Memory Alloys ,Int.J.Lectrochem.Sci.,8(2013) 3095-3104.
[9] Asokan T., Reddy S.S., Costa P.D.E.,“Electrical
discharge drilling of titanium alloys for aerospace applications”, Proceeding19th AIMTDR Conf., IIT Madras, Chennai, pp. 161-165, 2000.
[10] Pradhan B.B., Masanta M., Sarkar B.R.,
Bhattacharyya B.,“Investigation of
electrodischarge micro-machining of titanium super alloy”, International Journal of Advanced Manufacturing Technology, 2008.
[11] Lin Y.C., Yan B.H., Chang Y.S.,“Machining
characteristics of titanium alloy (Ti-6Al-4V) using a combination process of EDM with USM”, Journal of Material Processing Technology, Vol. 104, pp. 171-177, 2000.
[12] Hascalik A., Caydas U.,“Electrical discharge
machining of titanium alloy (Ti–6Al–4V)”, Applied Surface Science, Vol. 253, pp. 9007-9016, 2007.
[13] Malhotra Navdeep, Rani Sona, and Sheikh
© 2017, IRJET | Impact Factor value: 5.181 | ISO 9001:2008 Certified Journal | Page 47
Engineering Research and Studies, 2(4), pp.228-233.
[14] Kao, J. Y., Tsao, C. C., Wang, S. S. and Hsu, C. Y.,
2010, “Optimization of the EDM Parameters on Machining Ti–6Al–4V with Multiple Quality Characteristics,” International Journal of Advance Manufacturing Technology, 47, pp. 395-402.
[15] Lin, J.L., Wang, K.S., Yan, B.H., and Tarng, Y.S.,
2000, “Optimization of Electrical Discharge Machining Process based on the Taguchi Method with Fuzzy Logics,” Journal of Material Processing Technology, 102, pp. 48-55.
[16] Ramasawmya, H., and Blunt, L., 2004, “Effect
of EDM Process Parameters on 3D Surface Topography,” Journal of Material Processing Technology, 148, pp.155-164.
[17] George, P.M., Raghunath, B.K., Manocha, L.M.,