© 2017, IRJET | Impact Factor value: 5.181 | ISO 9001:2008 Certified Journal
| Page 86
Modal Analysis Of Cracked Continuous Beam Using ANSYS
1
P. Y. Ghodke,
2D. H. Tupe ,
3G. R. Gandhe
Department of Civil Engineering, Deogiri Institute of Engineering and Management Studies, Dr. BAMU University,
Aurangabad, Maharashtra, India.
---***---Abstract: In this present work, the important task is to determine the effect of crack on the beam structure. The presence of cracks in structure is changes the physical properties and its dynamics response. The effect on structure are analysed using ANSYS software and then it compare with the regression analysis. In vibration analysis the crack location and crack depth is the main parameter to determine the natural frequencies and its changes in mode shape. The natural frequencies is decreases when increasing the crack depth at same location of beam. It results the reduction of natural frequencies and change their mode shape of crack and without crack beam. ANSYS V15 software is used for FE analysis of both crack and uncrack simply supported continuous beam with two different materials one is structural steel and another aluminium. Creo software is used to designing of I section simply supported continuous beam model.
Keywords:- ANSYS, Creo, Natural frequency, Crack, Modal analysis, Simply supported continuous beam .
INTRODUCTION
Vibration analysis method is a very good approach to crack detection in beams. All most all types of beam operated under different kinds of loading conditions, which may be causes damages and cracks in overstressed zones. Cracks is also found in mechanical foundations due to different reasons. Generally in structural members like beam the presence of crack causes the reduction in stiffness which is depends on two parameters; location of crack and depth of the crack. In now a days it is very important to know whether the
beams is crack free or any crack is present in beam and to detect the crack position of beam for our safety purpose. A crack or local defect is affects on the vibration response of the structural member. It results in the changes of natural frequencies and its mode shapes of crack and uncrack structure. Also crack may be classified on the basis of geometry and its orientation as cracks parallel to shaft axis are known as longitudinal cracks, cracks that are open and close when affected part of material is subjected to alternative stresses are known as breathing crack, crack which are perpendicular to the axis of shaft are known as transverse crack, the cracks on surface which is not visible known as sub-surface crack, crack which appear on the surface are known as surface crack.
What is Vibration.
The term vibration describes repetitive motion that can be measured and observed in a structure. Unwanted vibration can be causes fatigue or degrade the performance of the structure. Therefore it is desirable to reduce the effects of vibration. In other cases, vibration is not able to be avoided or even desirable. In this case, the goal is to understand the effect on the structure, or to control or to modify the vibration, or isolate it from the structure and minimize structural response.
What is Free Vibration.
© 2017, IRJET | Impact Factor value: 5.181 | ISO 9001:2008 Certified Journal
| Page 87
and its vibration is be understand by examining the structure's mechanical properties. For example, when we pluck a string of a guitar, it vibrates at the tuned frequency and it generates the desired sound.
LITERATURE SURVEY
P. Amit et al. [1] scrutinized the vibration analysis of cantilever beam in different location and size of a crack. They used ANSYS workbench software to get the natural frequencies of cracked and un-cracked beam. Sharma P.K. et al. [2] studied in the experiment that the presence of crack leads to lower the natural frequencies. They used ANSYS software for FE analysis of both cracked and un-cracked beam by taking input file as established in CATIA. Muhannad Al-Waily [3] conducted studies on cracked of beam with different supports. The analytical results is reveal the effects of a crack in a continuous beam and the parameters calculated were the equivalent stiffness, Youngs modulus and moment of inertia for a rectangular beam is to involve an exponential function with depth and location of crack effect, with the solution of assuming equivalent stiffness of the beam (EI) by using of Fourier series method. And, the beam materials are studied were low carbon steel, Alloys Aluminium, and Bronze materials with different beam length and different depth. A comparison made between the analytical results from theoretical solution of general equation of motion of beam with crack effect with numerical by ANSYS results, where the biggest error percentage is about the (1.8 %).Ertugrul Cam et. al. [4], was presented information about the location and depth of cracks in cracked beams. For this purpose, vibrations as the result of impact shocks were analyzed. The signals are obtained in defect-free and cracked beams were compared in the frequency domain. The results of a study suggest to determine the location and depth of cracks by analyzing the from vibration signals. Experimental results and simulations obtained by the
software ANSYS are in good agreement. Yamuna and Sambasivarao [5] concluded from their study that the lowest natural frequency achieved at the mid span of simply supported beam and rises from there on. Jagdale and Chakrabarti [6] presented free vibration study of a beam with open edge crack. They found that the natural frequency fluctuates due to cracks at various crack position and depth. Hai-Ping Lin [7] has studied an analytical transfer matrix method, is used to solve direct and the inverse problems of simply supported beams with an open crack. The crack is modeled as the rotational spring with sectional flexibility. The natural frequencies of a cracked system can easily be obtained through many of the structural testing methods. When any two natural frequencies of a cracked simply supported beam are obtained from measurements, the location and a sectional flexibility of the crack can then be determined from the identification equation and the characteristic equation.
3. Finite Element Model Using ANSYS
In the present research the ANSYS is used as a tool to model and simulate a beam with a crack, to observe the variation in its vibrational characteristics. The beam model is design in software such as creo and it is imported to ANSYS workbench for the analysis. Now, after importing the model file, its geometry is modify and divide the entire structure into meshes by using FEM and has been solved for the modes of frequencies. The meshing size is increases so that it uniformly covers the entire structure. After the model is properly mesh and solve by using FEM, the various frequency values is obtaine for a particular combination of crack location and depth.
The above procedure is detailed as follows.
© 2017, IRJET | Impact Factor value: 5.181 | ISO 9001:2008 Certified Journal
| Page 88
2. Modify geometry, click on mesh, and increase the meshing size and select meshing type. 3. Provide free support .
4. Apply pressure or load. 5. Click on solve.
6. Click on deformation.
A. Design of Simply supported continuous Beam without crack
The model of simply supported continuous beam has been design in ANSYS for frequency analysis. The length (L),width (W) and depth (D) of the beam are considered as 3000 mm, 140 mm and 275 mm respectively .Aluminium alloy and mild steel is taken as the material for the simply supported continuous beam and its properties taken as for aluminium Young's modulus as 71 GPa, Poisson's ratio as 0.33 and density as 2700 kg/m3.For steel Young's modulus as 200 GPa, Poisson's ratio as 0.3 and density as 7850 kg/ The simply supported continuous beam considered for modeling in ANSYS is shown in Fig.
B. Design of Simply supported continuous Beam with Crack
A triangular crack is considered having original dimension of 6mm width. The initial location of the crack is taken at middle 1500 mm from one end of the simply support beam. The crack depth is taken as 3mm mm and later on the depth increases to 6mm, 9mm, 12mm and 15mm respectively. The cracked simply supported continuous beam with the volumetric model built in ANSYS is shown in Fig.
4. Modal Analysis of Simply supported
continuous Beam with Crack and without Crack
A triangular crack is introduced in the simply supported continuous beam model for frequency analysis. Initially the triangular crack is assumed to be located at middle of beam model. The first five natural frequencies of the simply supported continuous beam are obtained in ANSYS. The crack depth of beam varies at middle of the simply supported continuous beam. The Relative natural frequency for various crack depth with respect to same crack location of the beam respectively.A] Analysis of structural steel beam
The modal analysis of structural steel I section simply supported continuous beam Without crack and crack is done to determine its natural frequency with various mode.
Analysis of simply supported continuous beam without crack.
Table 1 Frequencies of structural steel without crack beam
Mode Frequency[Hz] ANSYS
Frequency[Hz] Reg. Analysis 1 0.087118 -4.5017
2 35.114 47.6402
3 102.48 92.4307
4 129 129.86
[image:3.595.37.288.475.566.2]© 2017, IRJET | Impact Factor value: 5.181 | ISO 9001:2008 Certified Journal
| Page 89
Mode1
Mode2
Analysis of simply supported continuous beam with crack.
Table 2 Frequencies structural steel crack beam by ANSYS
Crac k dept h
3mm 6mm 9mm 12mm 15mm
mod e Freq. [Hz] Freq. [Hz] Freq. [Hz] Freq. [Hz] Freq. [Hz] 1 0.06845
1
0.0684 0
0 0 0
2 19.571 19.405 0.0683 8
0.068 3
0.068 2 3 104.87 104.87 104.69 104.4
7
104.3 6 4 125.15 125.13 124.30 123.4
2
123.1 7 5 158.96 158.95 154.80 154.4
5
154.3 4
Table 3 Frequencies structural steel crack beam by Regrassion Analysis
Crack depth
3mm 6mm 9mm 12mm 15mm
mode Freq. [Hz] Freq. [Hz] Freq. [Hz] Freq. [Hz] Freq. [Hz]
1
-8.149 3
-8.1904 -13.449 -13.32 -13.29
2 41.98
7 41.923 4 35.112 4 34.937 6 34.87 3
3 86.92
43 86.860 4 80.219 9 79.843 6 79.71 4
4 126.6
6
126.62 121.87 6
121.38 8
121.2 3
5 161.1
95 161.20 4 160.08 5 159.57 2 159.4 2
Figures:-Natural frequencies at 3 mm on different mode Mode 1
Mode 2
Figures:-Natural frequencies at 6 mm on different mode Mode 1
[image:4.595.37.281.121.311.2] [image:4.595.29.558.411.790.2]© 2017, IRJET | Impact Factor value: 5.181 | ISO 9001:2008 Certified Journal
| Page 90
Figures:-Natural frequencies at 9 mm on different mode Mode 1
Mode 2
Figures:-Natural frequencies at 12 mm on different mode Mode 1
Mode 2
Figures:-Natural frequencies at 15 mm on different mode Mode 1
Mode 2
b] Analysis of aluminium beam
Analysis of simply supported continuous beam without crack.
Table 4 Frequencies of aluminium beam without crack beam
Mode Frequency[Hz] ANSYS
Frequency[Hz] Regression 1 0.087371 0.7538
2 43.614 49.32
3 102.93 90.83
4 113.35 123.76
5 151.31 148.119
Mode 1
[image:5.595.315.559.109.309.2]© 2017, IRJET | Impact Factor value: 5.181 | ISO 9001:2008 Certified Journal
| Page 91
[image:6.595.36.289.186.462.2]Analysis of simply supported continuous beam with crack.
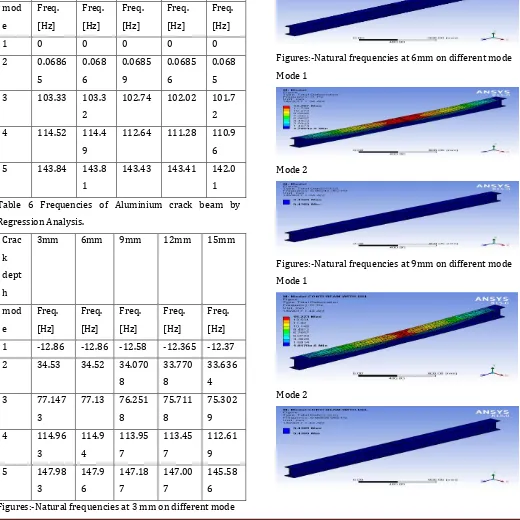
Table 5 Frequencies of Aluminium crack beam by ANSYS
Crac k dept h
3mm 6mm 9mm 12mm 15mm
mod e Freq. [Hz] Freq. [Hz] Freq. [Hz] Freq. [Hz] Freq. [Hz]
1 0 0 0 0 0
2 0.0686 5 0.068 6 0.0685 9 0.0685 6 0.068 5 3 103.33 103.3
2
102.74 102.02 101.7 2 4 114.52 114.4
9
112.64 111.28 110.9 6 5 143.84 143.8
1
143.43 143.41 142.0 1 Table 6 Frequencies of Aluminium crack beam by Regression Analysis.
Crac k dept h
3mm 6mm 9mm 12mm 15mm
mod e Freq. [Hz] Freq. [Hz] Freq. [Hz] Freq. [Hz] Freq. [Hz] 1 -12.86 -12.86 -12.58 -12.365 -12.37 2 34.53 34.52 34.070
8
33.770 8
33.636 4 3 77.147
3
77.13 76.251 8
75.711 8
75.302 9 4 114.96
3 114.9 4 113.95 7 113.45 7 112.61 9 5 147.98
3 147.9 6 147.18 7 147.00 7 145.58 6 Figures:-Natural frequencies at 3 mm on different mode
Mode 1
Mode 2
Figures:-Natural frequencies at 6mm on different mode Mode 1
Mode 2
Figures:-Natural frequencies at 9mm on different mode Mode 1
[image:6.595.39.559.255.775.2]© 2017, IRJET | Impact Factor value: 5.181 | ISO 9001:2008 Certified Journal
| Page 92
Figures:-Natural frequencies at 12 mm on different mode Mode 1
Mode 2
Figures:-Natural frequencies at 15 mm on different mode Mode 1
Mode 2
RESULTS AND DISCUSSION
In this present work, FEM method has been used in order to obtain the analytical solution for simply supported continuous beam with crack and without crack with two different material structural steel and aluminium. In ANSYS, modal analysis is used to determine its natural frequency and mode at different crack depth. The comparision between regression analysis and modal analysis is also done. The results of regression analysis is quite more than modal analysis.
Graph 1 Mode vs Frequency of structural steel and aluminium alloy without crack
Graph 2 Mode vs Frequency structural steel and aluminium at 15 mm crack depth.
CONCLUSION
The main objective of present study is to calculate the natural frequencies and modes of simply supported continuous I section beam with crack and without crack with two materials structural steel and aluminium. It is observed that the when increase the crack depth of beam then the natural frequencies is slightly decreases in both modal and regression analysis. It is also observed that the natural frequencies structural steel are slightly higher than that of aluminum alloy for simply supported continuous beam .
The difference between natural frequency of crack and un cracked beam is also having minium difference.
y = -3.6757x2 + 63.169x - 63.995 R² = 0.9838 y = -4.2878x2 + 62.945x - 59.411
R² = 0.9793
-50 0 50 100 150 200
1 2 3 4 5
Fr
eq
u
en
cy
Mode
St.Fr. Al.Fr
y = -1.6627x2 + 53.155x - 64.786 R² = 0.9022
y = -2.1749x2 + 52.541x - 62.746 R² = 0.8871
-50 0 50 100 150 200
0 2 4 6
Fr
eq
u
en
cy
Mode
St.Fr
© 2017, IRJET | Impact Factor value: 5.181 | ISO 9001:2008 Certified Journal
| Page 93
REFERENCES
[1] P. Amit V., M. Pathak, and P.K.Sharma,“Theoretical and Software analysis of crack detection in structure”, IJERT, Vol. 2, Issue-5, May 2014.
[2] P.K.Sharma, M. Pathak, and P. Amit V., “Alternative Solution to the detection of crack location and crack depth in structure by using software analysis method”, IJARSE, Vol. 3, Issue-8, August 2014.
[3] Muhannad Al-Waily, Theoretical and Numerical Vibration Study of Continuous Beam with Crack Size and Location Effect, International Journal of Innovative Research in Science, Engineering and Technology, Vol. 2, Issue 9, September 2013, pp. 4166-4177.
[4] Ertugrul Cam, Sadettin Orhan, and Murat Luy ‘An analysis of cracked beam structure using impact echo method’ NDT&E International, Vol. 38, 2005.
[5] P.Yamuna, and K.Sambasivarao, “Vibration Analysis of Beam with Varying crack Location”, IJERGS, Vol.2, Issue-6, October- November, 2014.
[6] P.M. jagdale, and M.A.Chakrabarti, “Free Vibration Analysis of Cracked Beam”, IJERA, Vol. 3, Issue 6, Nov-Dec 2013, pp. 1172-1176.
[7] Hai-Ping Lin “Deterministic Direct and inverse methods on free vibration analysis of simply supported beams with a crack” Engineering Structures; 2004; vol.26; pp.427–436.
[8] Patil D.P., Maiti S.K., Detection of multiple cracks using frequency measurements, Engineering Fracture Mechanics 70, (2003), pp.1553–1572.
[9] Patil D.P., Maiti S.K., Experimental verification of a method of detection of multiple cracks in beams based on frequency measurements, Journal of Sound and Vibration 281,(2005),