R E S E A R C H A R T I C L E
Open Access
Assessment of subchondral bone marrow
lesions in knee osteoarthritis by MRI:
a comparison of fluid sensitive and contrast
enhanced sequences
Flemming K. Nielsen
1*, Niels Egund
1, Anette Jørgensen
2, David A. Peters
3and Anne Grethe Jurik
1Abstract
Background:Bone marrow lesions (BMLs) in knee osteoarthritis (OA) can be assessed using fluid sensitive and contrast enhanced sequences. The association between BMLs and symptoms has been investigated in several studies but only using fluid sensitive sequences. Our aims were to assess BMLs by contrast enhanced MRI sequences in comparison with a fluid sensitive STIR sequence using two different segmentation methods and to analyze the association between the MR findings and disability and pain.
Methods:Twenty-two patients (mean age 61 years, range 41–79 years) with medial femoro-tibial knee OA obtained MRI and filled out a WOMAC questionnaire at baseline and follow-up (median interval of 334 days). STIR, dynamic contrast enhanced-MRI (DCE-MRI) and fat saturated T1 post-contrast (T1 CE FS) MRI sequences were obtained. All STIR and T1 CE FS sequences were assessed independently by two readers for STIR-BMLs and contrast enhancing areas of BMLs (CEA-BMLs) using manual segmentation and computer assisted segmentation, and the measurements were compared. DCE-MRIs were assessed for the relative distribution of voxels with an inflammatory enhancement pattern, Nvoxel, in the bone marrow. All findings were compared to WOMAC scores, including pain and overall symptoms, and changes from baseline to follow-up were analyzed.
Results:The average volume of CEA-BML was smaller than the STIR-BML volume by manual segmentation. The
opposite was found for computer assisted segmentation where the average CEA-BML volume was larger than the STIR-BML volume. The contradictory finding by computer assisted segmentation was partly caused by a number of outliers with an apparent generally increased signal intensity in the anterior parts of the femoral condyle and tibial plateau causing an overestimation of the CEA-BML volume.
Both CEA-BML, STIR-BML and Nvoxel were significantly correlated with symptoms and to a similar degree. A significant reduction in total WOMAC score was seen at follow-up, but no significant changes were observed for either CEA-BML, STIR-BML or Nvoxel.
Conclusions: Neither the degree nor the volume of contrast enhancement in BMLs seems to add any clinical
information compared to BMLs visualized by fluid sensitive sequences. Manual segmentation may be needed to obtain valid CEA-BML measurements.
Keywords: Magnetic resonance imaging, Knee osteoarthritis, Bone marrow lesion, DCE-MRI
* Correspondence:flemming.kromann@aarhus.rm.dk
1Department of Radiology, Aarhus University Hospital, Noerrebrogade 44,
8000 Aarhus, Denmark
Full list of author information is available at the end of the article
Background
Pain associated with osteoarthritis (OA) of the knee is one of the main causes for disability in ageing Western populations [1, 2]. Although intensively studied, the pathophysiology and pain-causing mechanism in knee OA are generally unknown [3]. Recent literature evi-dence has shown that bone marrow lesions (BMLs), a non-specific but common feature in knee OA, may or may not be associated with pain [4–6]. There is also limited and conflicting evidence on pain severity being correlated to BML size or not [7–9].
BMLs are defined as poorly delineated areas of increased signal intensity directly adjacent to the sub-chondral bone in the normally fatty epiphyseal marrow on fat-suppressed T2-weighted and contrast enhanced T1-weighted images [10, 11]. On non-contrast MRI, BMLs are optimally evaluated using fluid-sensitive fat-suppressed sequences [12]. Histopathologically, BMLs represent a mixture of bone marrow edema, necrosis and fibrosis, microfractures with bleeding in different stages of healing, and remodeled trabeculae as well as fibrovascular ingrowth [13–15]. The increased vascular-ity explains why areas with BMLs show enhancement on static contrast enhanced (CE) T1-weighted images, pref-erably with fat saturation (T1 CE FS) [11, 16, 17], and dynamic CE MRI (DCE-MRI) sequences [18–20]. The volumetric proportion of detectable enhancement in knee OA using T1 CE FS has been reported to consti-tute 62% of the BML volume using proton density (PD) weighted FS sequences [11]. Comparison with DCE-MRI of BMLs has to our knowledge not been performed, al-though knee OA has been investigated with regard to synovial changes using DCE-MRI [21–23]. The diagnos-tic value of T1 CE FS and DCE-MRI compared to a STIR sequence only needs to be investigated in relation to BMLs. The same applies to a possible relation between contrast enhancing areas of BMLs (CEA-BMLs) and OA symptoms.
The aims of our study were to assess BMLs by con-trast enhanced MRI sequences compared to MRI using STIR images and to analyze the association between these findings and disability and pain.
Methods Patients
The patients were recruited from a previous randomized placebo-controlled trial involving 337 patients with knee OA according to the ACR (American College of Rheumatology) criteria [24] comparing five intra-articular injections of Hyalgan® and placebo, respectively [25]. Twenty-two patients with knee OA affecting the medial femoro-tibial articulation were randomly selected among 83 participants obtaining MRI at both baseline and follow-up. A list of these participants was sorted
according to the day of birth, and the first 22 patients were chosen. Participants gave written informed consent prior to being enrolled in the study, including consent to publish study results and images [26]. The study was approved by the Central Denmark Region Committee on Biomedical and Research Ethics.
Patients filled out the Western Ontario and McMaster Universities Index (WOMAC) questionnaire at baseline and follow-up [27]. The WOMAC items, pain (5 items), stiffness (2 items) and physical function (17 items), were each scored using a 100 mm Visual Analogue scale with the following ranges: pain = 0–500, stiffness = 0–200, physical function = 0–1700, total score = 0–2400.
Imaging
Radiography: Routine radiographic examination consist-ing of standconsist-ing weight-bearconsist-ing postero-anterior and lateral views with the knee in 30° flexion [28] were obtained in all patients at baseline.
MRI consisted of the following sequences: Sagittal STIR and sagittal and axial T1-weighted sequences be-fore contrast. Following intravenous administration of Gadolinium contrast (Gd-DTPA, 0.2 mmol/ml, GE Healthcare AS, Oslo, Norway) using 0.1 mmol/kg with a maximum of 10 mmol DCE-MRI was obtained using a sagittal T1-weighted spoiled gradient echo sequence with four sagittal slices every 5 s with 50–65 repetitions, repetition time (TR) = 50.2 ms, echo time (TE) = 4.1 ms, field of view (FOV) = 16 cm, slice thickness (ST) = 4 mm, matrix = 128 × 128, flip angle 30° and acquisition time (AT) 4.2–5.4min. Finally, sagittal and axial T1 FS post-contrast sequences were performed using the fol-lowing parameters: TR = 860 ms, TE = 20 ms, FOV = 16 cm, ST = 4.0 mm, interslice gap (IG) = 0.8 mm, matrix = 512 × 512, total AT 7.2min. DCE-MRIs were missing in 6 of 44 examinations for technical reasons and follow-up analyses could therefore not be performed in 5 patients.
Details of the MRI protocol are described in an additional file (see Additional file 1).
Image analysis
All images were anonymized and separated before ana-lysis. The radiographic changes were graded according to Ahlbäck [29] by an experienced musculoskeletal radiologist (NE) [30].
All MR sequences were assessed twice by a radio-logical registrar (FKN) with at least a 4-week interval be-tween the assessments; all sequences except DCE-MRI were also assessed by NE. The assessments were pre-ceded by training sessions amongst FKN, NE and AGJ of 15 examinations not included in the present study.
recorded and sections and areas of sections containing both bone marrow and extra-osseous soft tissue such as synovia were strictly excluded. Consequently, only three to four slices of the medial femoral condyle and tibial plateau remained for analyses. When four slices were available, the most medially located three slices were used for BML segmentation.
Images were analyzed for CEA-BMLs and STIR-BMLs by manual segmentation (MS) and computer assisted segmentation (CAS), respectively. Both methods have been tested on STIR images as described in a previous study [31] and all results of segmentation on STIR images have been presented in this publication. For a detailed method description of MS and CAS, please see Additional file 1.
DCE-MRI measurements were performed using Dynamika (DYNAMIKA software, version 3.2.6 (www.imageanalysis.org.uk, Leeds, UK)), a software performing a voxel-by-voxel-based line fit analysis to calculate parametric maps.
One region of interest (ROI), outlined similar to CAS and MS (according to Hunter et al. [32]) (Fig. 1), was
drawn in the medial femoral condyle and tibial plateau, respectively, to obtain quantitative data. Time intensity curves (TICs) expressing the enhancement pattern of each voxel were classified as one of four color-coded models for gadolinium uptake: (i) no enhancement; (ii) persistent enhancement; (iii) plateau (baseline → uptake → plateau); (iv) wash-out (baseline → uptake {→ plateau}→ wash-out) [23]. The volume of voxels with the pattern of ‘plateau’ and ‘wash-out’ enhance-ment were pooled to a value Nvoxel and used as a
measure of the volume of inflammation [22, 23]. The initial rate of enhancement (IRE) and maximal en-hancement (ME) in the segmented area were also re-corded to obtain the heuristic DCE variables IRExNvoxel and MExNvoxel [23]. Due to the applied
method, no reference value was needed for calculating TICs.
Statistical analysis
Data was analyzed using Analyse-it software (Analyse-it for Microsoft Excel (version 2.20) Ltd.; 2009). CEA-BML and STIR-BML were compared in all the 44 examined
[image:3.595.58.542.363.665.2]knees by Bland-Altman analyses, using plots, bias and confidence intervals (CIs) [33] and descriptively using median and quartiles after adjusting for the difference in inter-slice gap.
The inter- and intra-observer reliability were assessed based on all knee examinations irrespective of baseline or follow-up status by Bland-Altman analyses, using plots, bias and confidence intervals (CIs).
The WOMAC scores were analyzed descriptively using medians and ranges. The Spearman rho test was used to determine correlation coefficients be-tween WOMAC scores and CEA-BML, STIR-BML and Nvoxel parameters, respectively. Wilcoxon’s signed
ranked test was used to compare median values between baseline and follow-up. The Spearman rho test and Wilcoxon’s signed ranked test were also per-formed after the segmentations of the femoral condyle and tibial plateau had been merged into one total knee score to express the total CEA-BML, STIR-BML and Nvoxel involvement, respectively. A p value <0.05
was considered significant.
Results
Patient characteristics are shown in Table 1.
Inter- and intra-observer agreement for T1 CE FS and STIR as well as intra-observer agreement for DCE-MRI was high with small bias values (Table 2). Thus, the mean values of CEA-BML and STIR-BML measure-ments of the two assessors were subsequently used.
STIR-BMLs by MS and CAS and CEA-BMLs by MS according to the definition were not found in 13 femoral condyles and 15 tibial plateaus. Four of these femoral condyles and six tibial plateaus demonstrated CEA-BMLs by the CAS segmentation (Fig. 2). Voxels indicat-ing inflammation by DCE-MRI were not seen in 5/38 femoral condyles and 5/38 tibial plateaus; STIR-BMLs by MS and CAS and CEA-BMLs by MS were not found in these examinations either, but CEA-BMLs by the CAS segmentation were seen in one femoral condyle and two tibial plateaus.
The average CEA-BML volumes using MS were smaller than the measured STIR-BML volumes with a negative bias of 3.2–3.5% for CEA-BML measurements compared to STIR-BML measurements (Table 3). How-ever, the measured CEA-BML volumes were 4.1–5.3% larger than the STIR-BML volume using CAS (Table 3).
The positive difference between CEA-BML and STIR-BML measurements using CAS (Table 4) was due to a small but general trend, as well as a number of outliers in the Bland-Altman plots. The 95% limits of agreement were exceeded in five CAS analyses of the femoral con-dyles (>3070 mm3
[image:4.595.57.293.99.183.2]) and in three analyses of the tibial
Table 1Baseline data of the patients
Patient characteristics (n=22)
Age years, median (range) 61 (41–79)
Female gender (%) 18 (82%)
BMI, median (range) 25.7 (19.7–37.7)
Follow-up interval days, median (range) 334 (91–375)
Ahlbäck grading 0/1/2/3, No. 2/9/6/5
Table 2Observer agreement for relative and absolute CEA-BML and STIR-BML measurements, and relative Nvoxel, irrespective of
baseline/follow-up
Method Area Image
sequence
Observer agreement
CEA-BML, STIR-BML and Nvoxel, relative CEA-BML, STIR-BML and Nvoxel, absolute
Biasa,% 95% CI Biasa, mm3/mm2b 95% CI
MS Femur T1 CE FS Inter-observer Intra-observer −
0.86
−0.98 −
2.68 −2.37
0.95
0.42 −
79
−94 −
281 −199 122 11 Tibia Inter-observer Intra-observer − 0.67
−0.89 −
4.2 −2.64
2.8 0.86
18
−58 −
321 −147
358 31
Femur STIR Inter-observer Intra-observer − 0.36 1.15 − 1.45 −0.46 0.73 2.76 7 142 − 129 −41 144 325 Tibia Inter-observer Intra-observer −0.26 1.18 −0.82 −0.06 1.35 2.41 −83 129 −209 6 44 251
CAS Femur T1 CE FS Inter-observer Intra-observer
0.23
−0.37 −
1.22 −1.03
1.68 0.29
108
−71 −
59 −185 276 43 Tibia Inter-observer Intra-observer 0.29 0.18 − 1.57 −0.30 2.15 0.67 14 3 − 94 −36 122 42
Femur STIR Inter-observer Intra-observer
0.01
−0.10 −
0.41 −0.42 0.43 0.21 15 67 − 60 13 89 121 Tibia Inter-observer Intra-observer − 0.10 0.22 − 0.70 −0.04 0.51 0.49 − 74 61 − 140 28 9 94 Dynamika Femur Tibia DCE-MRI Intra-observer Intra-observer − 2.75
−2.5 −
4.56
−5.37 −
0.94
0.37 −
27
−7 −
50
−29 −
5 15
a
Bland-Altman analysis b
[image:4.595.57.537.481.716.2]plateaus. Four of the femoral condyle outliers were ob-served in two patients (baseline and follow-up); in one outlier patient, the high values were observed in both the femoral condyle and tibial plateau at follow-up. The remaining tibial outliers were observed in two different patients at baseline.
The outliers were analyzed in a consensus reading be-tween NE and FKN and revealed an apparent increase in signal intensity in a superficial rim of the medial and lat-eral femoral condyles (Figs. 2 and 3) and, to a smaller extent, the tibial plateaus. Exclusion of the outliers nar-rowed the variation (Table 4) and they were not included in the analyses regarding association with disability and pain, nor with changes during follow-up.
Analyses of DCE-MRI revealed a median relative/abso-lute Nvoxel distribution for all examinations of 27.4%
(range 0.0–93.2%)/284 mm2 (range 0–1077 mm2) and 24.0% (range 0.0–94.8%)/218 mm2 (range 0–786 mm2) in the femoral condyles and tibial plateaus, respectively. Since DCE-MRI measurements were confined to one slice, the results were not directly compared to the data from the static MR sequences.
Clinical and radiological correlation
A significant correlation was seen between the total vol-ume of CEA-BML and STIR-BML in the medial joint compartment and WOMACpainand WOMACtotalscores
using MS and CAS (Table 5). Both WOMACpain and
WOMACtotal scores were significantly correlated with
Nvoxel and MExNvoxel, but not with IRExNvoxel. The ME
value showed very little variation (femur: median 1.11, range 1.04–1.56; tibia: median 1.07, range 1.03–1.48) in the 33 examinations with postitive Nvoxel findings and
the addition of this value did not seem to add any sig-nificant information. The corresponding IRE values were very small (femur: median 0.001, range 0.000–0.006; tibia: median 0.001, range 0.000–0.005) and they only seemed to distort the correlations (Table 5).
There was a significant reduction in total WOMAC score of 286 (p≤ 0.023) from baseline to follow-up. No other significant changes were observed (Table 6).
Discussion
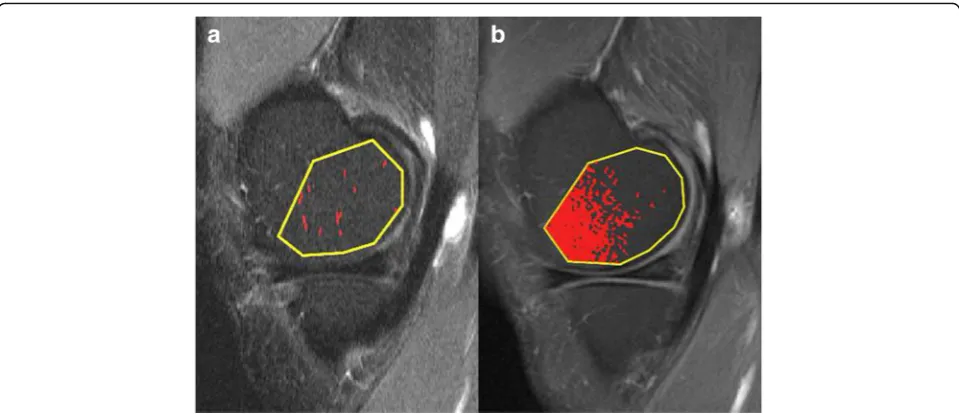
[image:5.595.58.538.87.294.2]Our study showed that the measured volume of CEA-BMLs on average were smaller than the measured Fig. 2aSagittal STIR andbT1 CE FS images through the medial condyle in a patient without STIR-BML or CEA-BML using MS. The marked pixels represent areas above the threshold signal intensity.aRandom clusters of pixels are marked. The segmented area was 9 mm2or 1.1%.bA large number of marked pixels are seen in the anterior part of the condyle. The segmented area was 280 mm2or 33%
Table 3Comparison of CEA-BML and STIR-BML measurements of all 44 examinations, relative and absolute values
Method Area CEA-BML% vs. STIR-BML% CEA-BML vs. STIR-BML, absolute values, mm3
Biasa 95% CI Biasa 95% CI
MS Femur −3.52 −5.93 −1.12 −403 −651 −156
Tibia −3.23 −5.23 −1.22 −616 −860 −373
CAS Femur 5.31 2.36 8.25 675 303 1046
Tibia 4.11 1.72 6.50 237 34 474
a
[image:5.595.57.537.640.723.2]STIR-BML volumes using MS, but CAS measure-ments of CEA-BMLs were not consistently reliable due to signal disturbances in some of the T1 CE FS sequences. There was a positive correlation between CEA-BML/STIR-BML size and pain but no significant correlation between change in CEA-BML/STIR-BML and WOMACpain during follow-up.
Contrast enhanced MRI is not routinely used in OA studies, and the enhancement characteristics have only been evaluated in a few studies [11, 16, 17]. These stud-ies have focused on size measurements of BMLs, com-paring fluid sensitive sequences, i.e., PD FS or STIR, with contrast enhanced T1 FS series; only one study [11] has, however, focused specifically on OA related BMLs. In this study the pathological areas on T1 CE FS were generally smaller than BML-areas on PD FS [11]. In the studies by Schmid et al. and Mayerhoefer et al., only a minor number of patients had “bone marrow edema” due to OA (3.5and 26.7%, respectively), other reasons being osteonecrosis, bone bruise and osteochondral
lesions [16, 17]. Schmid et al. found that the volume of bone marrow edema was slightly larger by STIR, whereas Mayerhoefer et al. found that the volume was largest on T1 CE FS using a gadopentate dose of 0.1 mmol/kg but slightly smaller on T1 CE FS than on STIR using a gado-pentate dose of 0.075 mmol/kg [16, 17].
In line with the study by Roemer et al. [11], we found that the CEA-BML volume by T1 CE FS gener-ally was smaller than the BML volume by STIR using MS. We did, however, find CAS to be unreliable on T1 CE FS sequences in some cases where areas of in-creased signal intensity were seen in the peripheral parts of the femoral condyles and tibial plateaus (Fig. 2). These signal disturbances could be due to the anatomical composition of the knee (Fig. 3), non-uniform fat saturation, magnetic field inhomogeneity, receive coil inhomogeneity or a combination hereof. Since our threshold calculation was performed using the most central slices in the lateral femoral condyle and tibial plateau, the signal disturbances did not affect the threshold calculation.
We found a positive correlation between CEA-BML/ STIR-BML volume and symptoms and also between
Nvoxel and MExNvoxel and symptoms. However, there
was no indication that CEA-BMLs or the dynamic pa-rameters Nvoxelor MExNvoxelwere better correlated with
pain than STIR-BMLs. Thus, the results cannot support that changes in vascularization in BMLs play a role in the symptomatology of BML. Therefore, the use of contrast agents for visualization of BMLs in OA seems unnecessary in clinical practice.
[image:6.595.56.292.110.230.2]The median scores for pain decreased during follow-up but it was not accompanied by a corresponding de-crease of BMLs by MRI. This indicates that other knee joint changes are of importance. Consistent with this,
Table 4Comparison of CEA-BML and STIR-BML volume in all 44 examinations, absolute values
Segmentation method
Area Median CEA-BML and STIR-BML volume (25th - 75th quartile), mm3
T1 CE FS STIR
MS Femur 655 (0–2435) 812 (0–3203)
Tibia 439 (0–1848) 942 (0–3032)
CAS Femur 1281 (251–3715) 568 (150–2399)
Tibia 597 (207–2633) 295 (137–1591)
CASa Femur 881 (199–2614)a N.A.
Tibia 384 (195–2082)a N.A.
N.A.not applicable a
Outliers excluded
[image:6.595.57.540.523.684.2]other factors have been reported to be associated with OA symptoms [5, 23].
Our study has a number of limitations, especially the small number of participants. We only analyzed sub-chondral bone marrow changes and did not look for other pathologies known to be correlated with pain, e.g., synovitis or meniscal damage [23]. There could be ana-tomical and technical reasons for the occurrence of al-tered signal intensity by CEA-BML, which was not analyzed further. In our material, this was evident both as a small general trend and in a minor number of con-siderable outliers on the T1 CE FS-sequences, underlin-ing both the need for high quality images and the fact that images cannot solely be analyzed by computer software.
The strength of our study is the use of an exact defin-ition of the slices and areas used for segmentation. By
excluding sections with partial volume artifacts from the surrounding soft tissue, our data was not distorted by signal intensity changes from the synovia and/or joint fluid. We have not found similar restrictions of ROI defi-nitions in other OA analyses of BMLs [10, 32, 34–36]. In the illustrations of the scoring system proposed by the Canadian CareArthritis [36], areas affected by partial volume from synovitis seems to be included in the regis-tration of BMLs.
Conclusions
In conclusion, we found that contrast enhancing areas of BMLs on average were smaller than STIR-BMLs although the differences were small and that manual segmentation may be needed to obtain valid CEA-BML volumes. The CAS method proved suitable for BML segmentation on fluid sensitive sequences being quickly performed and reproducible. Both CEA-BMLs and STIR-BMLs were similarly correlated to symptoms. The volume of voxels indicating inflammation by the DCE-MRI sequence were equally correlated to symptoms.
Additional file
Additional file 1:Supplementary imaging protocol, method description and figures. (ZIP 5644 kb)
Abbreviations
BML:Bone marrow lesion; CAS: Computer assisted segmentation; CE: Contrast enhanced; CEA-BML: Contrast enhancing area of bone marrow lesion; CI: Confidence interval; DCE-MRI: Dynamic contrast enhanced-MRI; IRE: Initial rate of enhancement; ME: Maximum enhancement; MS: Manual segmentation; OA: Osteoarthritis; PD: Proton density; ROI: Region of interest; TIC: Time intensity curve; WOMAC: Western Ontario and McMaster Universities Index
Acknowledgements
[image:7.595.56.540.99.223.2]We thank all study participants and Kristian Stengaard-Pedersen for collecting patient material.
Table 5Comparison of WOMAC scores with CEA-BML, STIR-BML and Nvoxel–parameters
Method Segmentation parameter
WOMAC - pain WOMAC - total
Correlation coefficienta 95% CI 2-tailed p Correlation coefficienta 95% CI 2-tailed p
MS CEA-BML 0.47 0.20 0.67 0.001 0.49 0.23 0.69 0.001
BML 0.46 0.19 0.67 0.002 0.49 0.23 0.69 0.001
CAS bCEA-BML 0.40 0.12 0.63 0.008 0.37 0.08 0.61 0.014
BML 0.37 0.09 0.60 0.012 0.39 0.11 0.62 0.009
Dynamika Nvoxel 0.37 0.06 0.62 0.022 0.44 0.14 0.66 0.006
ME x Nvoxel 0.39 0.08 0.63 0.016 0.45 0.15 0.67 0.005
IRE x Nvoxel 0.20 −0.12 0.49 0.22 0.28 −0.04 0.55 0.086
Data was analyzed using imaging data from the entire medial knee joint, irrespective of baseline/follow-up. BML and Nvoxelwere calculated based on the relative involvement. MExNvoxeland IRExNvoxelwere calculated by multiplying the absolute number of Nvoxelby ME and IRE, respectively
a
Spearman’s rank correlation data b
5 femoral and 3 tibial outliers excluded
Table 6Median differences in change of WOMAC scores and imaging parameters from baseline to follow-up
Method Segmentation parameter
Baseline, median (range)
Follow-up, median (range)
p-values*
WOMACtotal N.A. 794 (76–1444) 234 (9–1782 0.023
WOMACpain N.A. 140 (18–311) 44 (3–373) 0.054
MS CEA-BML 6.5 (0–67.0) 7.5 (0–79.4) 0.21
BML 8.1 (0–70.5) 11.4 (0–86.8) 0.71
CAS CEA-BMLa 8.1 (0.1–44.9) 8.6 (1.0–81.3) 0.18 BML 5.6 (0.1–39.8) 5.3 (0.6–79.8) 0.97
Dynamika Nvoxel 29.3 (0.0–99.3) 18.8 (0.0–86.1) 0.13
MExNvoxel 379.4 (0.0–
1442.1)
281.6 (0.0– 1679.5)
0.13
IRExNvoxel 0.2 (0.0–3.3) 0.2 (0.0–4.1) 0.45
Data was analyzed using imaging data from the entire medial knee joint. CEA-BML, BML and Nvoxelwere calculated based on the relative involvement. MExNvoxeland IRExNvoxelwere calculated by multiplying the absolute number of Nvoxelby ME and IRE, respectively
N.A.not applicable
*Changes from baseline to follow-up, Wilcoxon’s signed rank test a
[image:7.595.56.293.515.673.2]Funding
The study was financially supported by A.P. Møller og Hustru Chastine Mc-Kinney Møllers Fond til Almene Formal by donation of the MR equipment.
Availability of data and materials
The datasets supporting the conclusions are included in the manuscript. Please contact the corresponding author if you wish to access the material in more details.
Authors’contributions
FKN, NE and AGJ were all involved in the design and coordination of the study, including data collection and measurement as well as the manuscript preparation. AJ selected the patients and collected clinical data. DP developed the software for computer assisted segmentation and was involved in the analysis and interpretation of the data. All authors meet the requirements for authorship including final approval of the manuscript submitted.
Authors’information
FKN: Department of Radiology, Aarhus University Hospital, Noerrebrogade 44, 8000, Aarhus, Denmark: PhD student within MRI of knee disorders including osteoarthritis.
NE: Musculoskeletal radiologist, DMSc and Professor. Department of Radiology, Aarhus University Hospital, Noerrebrogade 44, 8000, Aarhus, Denmark.
AJ: Rheumatologist, PhD, Department of Rheumatology, Aarhus University Hospital, Noerrebrogade 44, 8000, Aarhus, Denmark.
DP: Medical Engineer, PhD, Department of Biomedical Engineering, Aarhus University Hospital, Noerrebrogade 44, 8000, Aarhus, Denmark.
AGJ: Musculoskeletal radiologist, DMSc and Professor. Department of Radiology, Aarhus University Hospital, Noerrebrogade 44, 8000, Aarhus, Denmark.
Competing interests
The authors declare that they have no competing interests.
Consent for publication Not applicable.
Ethics approval and consent to participate
The study was approved by the Central Denmark Region Committee on Biomedical and Research Ethics. Prior to enrolment in the study, all participants gave signed informed consent after receiving written and oral information, including consent to publish study results and images.
Author details
1Department of Radiology, Aarhus University Hospital, Noerrebrogade 44,
8000 Aarhus, Denmark.2Department of Rheumatology, Aarhus University Hospital, Noerrebrogade 44, 8000 Aarhus, Denmark.3Department of
Biomedical Engineering, Aarhus University Hospital, Noerrebrogade 44, 8000 Aarhus, Denmark.
Received: 17 September 2016 Accepted: 9 November 2016
References
1. Guccione AA, Felson DT, Anderson JJ, Anthony JM, Zhang Y, Wilson PW, Kelly-Hayes M, Wolf PA, Kreger BE, Kannel WB. The effects of specific medical conditions on the functional limitations of elders in the Framingham Study. Am J Public Health. 1994;84:351–8.
2. Felson DT, Zhang Y. An update on the epidemiology of knee and hip osteoarthritis with a view to prevention. Arthritis Rheum. 1998;41:1343–55. 3. Felson DT, Niu J, Guermazi A, Roemer F, Aliabadi P, Clancy M, Torner J,
Lewis CE, Nevitt MC. Correlation of the development of knee pain with enlarging bone marrow lesions on magnetic resonance imaging. Arthritis Rheum. 2007;56:2986–92.
4. Barr AJ, Campbell TM, Hopkinson D, Kingsbury SR, Bowes MA, Conaghan PG. A systematic review of the relationship between subchondral bone features, pain and structural pathology in peripheral joint osteoarthritis. Arthritis Res Ther. 2015;17:228.
5. Yusuf E, Kortekaas MC, Watt I, Huizinga TW, Kloppenburg M. Do knee abnormalities visualised on MRI explain knee pain in knee osteoarthritis? A systematic review. Ann Rheum Dis. 2011;70:60–7.
6. Xu L, Hayashi D, Roemer FW, Felson DT, Guermazi A. Magnetic resonance imaging of subchondral bone marrow lesions in association with osteoarthritis. Semin Arthritis Rheum. 2012;42:105–18.
7. Felson DT, Chaisson CE, Hill CL, Totterman SM, Gale ME, Skinner KM, Kazis L, Gale DR. The association of bone marrow lesions with pain in knee osteoarthritis. Ann Intern Med. 2001;134:541–9.
8. Lo GH, McAlindon TE, Niu J, Zhang Y, Beals C, Dabrowski C, Le Graverand MP, Hunter DJ, OAI Investigators Group. Bone marrow lesions and joint effusion are strongly and independently associated with weight-bearing pain in knee osteoarthritis: data from the osteoarthritis initiative. Osteoarthritis Cartilage. 2009;17:1562–9.
9. Kornaat PR, Kloppenburg M, Sharma R, Botha-Scheepers SA, Le Graverand MP, Coene LN, Bloem JL, Watt I. Bone marrow edema-like lesions change in volume in the majority of patients with osteoarthritis; associations with clinical features. Eur Radiol. 2007;17:3073–8.
10. Peterfy CG, Guermazi A, Zaim S, Tirman PF, Miaux Y, White D, Kothari M, Lu Y, Fye K, Zhao S, Genant HK. Whole-Organ Magnetic Resonance Imaging Score (WORMS) of the knee in osteoarthritis. Osteoarthritis Cartilage. 2004; 12:177–90.
11. Roemer FW, Khrad H, Hayashi D, Jara H, Ozonoff A, Fotinos-Hoyer AK, Guermazi A. Volumetric and semiquantitative assessment of MRI-detected subchondral bone marrow lesions in knee osteoarthritis: a comparison of contrast-enhanced and non-enhanced imaging. Osteoarthritis Cartilage. 2010;18:1062–6.
12. Crema MD, Roemer FW, Hayashi D, Guermazi A. Comment on: Bone marrow lesions in people with knee osteoarthritis predict progression of disease and joint replacement: a longitudinal study. Rheumatology (Oxford). 2011;50:996–7.
13. Zanetti M, Bruder E, Romero J, Hodler J. Bone marrow edema pattern in osteoarthritic knees: correlation between MR imaging and histologic findings. Radiology. 2000;215:835–40.
14. Saadat E, Jobke B, Chu B, Lu Y, Cheng J, Li X, Ries MD, Majumdar S, Link TM. Diagnostic performance of in vivo 3-T MRI for articular cartilage
abnormalities in human osteoarthritic knees using histology as standard of reference. Eur Radiol. 2008;18:2292–302.
15. Muratovic D, Cicuttini F, Wluka A, Findlay D, Wang Y, Otto S, Taylor D, Humphries J, Lee Y, Labrinidis A, Williams R, Kuliwaba J. Bone marrow lesions detected by specific combination of MRI sequences are associated with severity of osteochondral degeneration. Arthritis Res Ther. 2016;18:54.
16. Mayerhoefer ME, Breitenseher MJ, Kramer J, Aigner N, Norden C, Hofmann S. STIR vs. T1-weighted fat-suppressed gadolinium-enhanced MRI of bone marrow edema of the knee: computer-assisted quantitative comparison and influence of injected contrast media volume and acquisition parameters. J Magn Reson Imaging. 2005;22:788–93.
17. Schmid MR, Hodler J, Vienne P, Binkert CA, Zanetti M. Bone marrow abnormalities of foot and ankle: STIR versus T1-weighted contrast-enhanced fat-suppressed spin-echo MR imaging. Radiology. 2002;224:463–9. 18. Aaron RK, Dyke JP, Ciombor DM, Ballon D, Lee J, Jung E, Tung GA. Perfusion
abnormalities in subchondral bone associated with marrow edema, osteoarthritis, and avascular necrosis. Ann N Y Acad Sci. 2007;1117:124–37. 19. Lee JH, Dyke JP, Ballon D, Ciombor DM, Tung G, Aaron RK. Assessment of
bone perfusion with contrast-enhanced magnetic resonance imaging. Orthop Clin North Am. 2009;40:249–57.
20. Seah S, Wheaton D, Li L, Dyke JP, Talmo C, Harvey WF, Hunter DJ. The relationship of tibial bone perfusion to pain in knee osteoarthritis. Osteoarthritis Cartilage. 2012;20:1527–33.
21. Ostergaard M, Stoltenberg M, Lovgreen-Nielsen P, Volck B, Sonne-Holm S, Lorenzen I. Quantification of synovistis by MRI: correlation between dynamic and static gadolinium-enhanced magnetic resonance imaging and microscopic and macroscopic signs of synovial inflammation. Magn Reson Imaging. 1998;16:743–54.
23. Riis RG, Gudbergsen H, Henriksen M, Ballegaard C, Bandak E, Rottger D, Bliddal H, Hansen BB, Hangaard S, Boesen M. Synovitis assessed on static and dynamic contrast-enhanced magnetic resonance imaging and its association with pain in knee osteoarthritis: a cross-sectional study. Eur J Radiol. 2016;85:1099–108.
24. Altman R, Asch E, Bloch D, Bole G, Borenstein D, Brandt K, Christy W, Cooke TD, Greenwald R, Hochberg M. Development of criteria for the classification and reporting of osteoarthritis. Classification of osteoarthritis of the knee. Diagnostic and Therapeutic Criteria Committee of the American Rheumatism Association. Arthritis Rheum. 1986;29:1039–49.
25. Jorgensen A, Stengaard-Pedersen K, Simonsen O, Pfeiffer-Jensen M, Eriksen C, Bliddal H, Pedersen NW, Bodtker S, Horslev-Petersen K, Snerum LO, Egund N, Frimer-Larsen H. Intra-articular hyaluronan is without clinical effect in knee osteoarthritis: a multicentre, randomised, placebo-controlled, double-blind study of 337 patients followed for 1 year. Ann Rheum Dis. 2010;69:1097–102.
26. Jørgensen A. Knee osteoarthritis hyaluronan treatment, pain modalities and magnetic resonance imaging: Ph.D.-thesis. Faculty of Health Sciences, University of Aarhus; 2006.
27. Bellamy N. Western Ontario and McMaster Universities Osteoarthritis Index (WOMAC). 2015. http://www.rheumatology.org/I-Am-A/Rheumatologist/ Research/Clinician-Researchers/Western-Ontario-McMaster-Universities-Osteoarthritis-Index-WOMAC. Accessed 13 Apr 2016.
28. Skou N, Egund N. Patellar position in weight-bearing radiographs compared with non-weight-bearing: significance for the detection of osteoarthritis. Acta Radiol. 2016. Published online before print June 10, 2016. doi:10.1177/ 0284185116652013.
29. Ahlback S. Osteoarthrosis of the knee. A radiographic investigation. Acta Radiol Diagn (Stockh). 1968;Suppl 277:7–72.
30. Rytter S, Jensen LK, Bonde JP, Egund N. MR imaging of intra- and periarticular cyst-like lesions of the knee joint in workers with occupational kneeling. Int J Rheumatol. 2012;2012:843970.
31. Nielsen FK, Egund N, Peters D, Jurik AG. Measurement of bone marrow lesions by MR imaging in knee osteoarthritis using quantitative segmentation methods–a reliability and sensitivity to change analysis. BMC Musculoskelet Disord. 2014;15:447.
32. Hunter DJ, Lo GH, Gale D, Grainger AJ, Guermazi A, Conaghan PG. The reliability of a new scoring system for knee osteoarthritis MRI and the validity of bone marrow lesion assessment: BLOKS (Boston Leeds Osteoarthritis Knee Score). Ann Rheum Dis. 2008;67:206–11.
33. Bland JM, Altman DG. Statistical methods for assessing agreement between two methods of clinical measurement. Lancet. 1986;1:307–10.
34. Hunter DJ, Guermazi A, Lo GH, Grainger AJ, Conaghan PG, Boudreau RM, Roemer FW. Evolution of semi-quantitative whole joint assessment of knee OA: MOAKS (MRI Osteoarthritis Knee Score). Osteoarthritis Cartilage. 2011;19: 990–1002.
35. Kornaat PR, Ceulemans RY, Kroon HM, Riyazi N, Kloppenburg M, Carter WO, Woodworth TG, Bloem JL. MRI assessment of knee osteoarthritis: Knee Osteoarthritis Scoring System (KOSS)–inter-observer and intra-observer reproducibility of a compartment-based scoring system. Skeletal Radiol. 2005;34:95–102.
36. Canadian CareArthritis. The Knee Inflammation MRI Score (KIMRISS) Training Module. 2016. https://www.carearthritis.com/kimriss/. Accessed 23 June 2016.
• We accept pre-submission inquiries
• Our selector tool helps you to find the most relevant journal
• We provide round the clock customer support
• Convenient online submission
• Thorough peer review
• Inclusion in PubMed and all major indexing services
• Maximum visibility for your research
Submit your manuscript at www.biomedcentral.com/submit