A Monthly Double-Blind Peer Reviewed Refereed Open Access International e-Journal - Included in the International Serial Directories
International Research Journal of Natural and Applied Sciences (IRJNAS)
Website: www.aarf.asia. Email: editoraarf@gmail.com , editor@aarf.asia Page 57
ALLELIC AND PHENOTYPIC DIVERSITY OF ABO AND RHESUS (D)
BLOOD GROUPS IN THE MEDICAL AND DENTAL APPRENTICES
OF A UNIVERSITY OF HARYANA, INDIA
Bhuvnesh Yadav1, Anupuma Raina2, Anil Kumar1, SK Bansal1, TD Dogra1
1
Shree Guru Gobind Singh Tricentenary University, Gurgaon, Haryana All India Institute of Medical Sciences, New Delhi, India.
ABSTRACT
Human blood group phenotypes are important for blood transfusion programs,
disease association and population genetics studies. This study is designed to report the
phenotypic and allelic distribution of ABO and Rhesus (Rh) groups in various caste groups of
the students enrolled in Medical and Dental Colleges of SGT University. ABO and Rhesus
blood groups and self-identified ethnicity was obtained from 570 medical students of this
University. Ethnicity has been classified into six major (caste) groups: Jat, Yadav, Brahmin,
Baniya, Punjabi and Others. ABO allelic frequencies were determined using the Bernstein
method. Differences in phenotypic distribution of blood groups were assessed using the
chi-square test. The frequencies of the antigens of blood groups ABO*O, ABO*A, ABO*B and
ABO*AB in the target group observed were 31.4%, 24.04%, 38.25% and 6.32%,
respectively; and Rhesus-positive was 92.63%. The allelic frequencies of ABO*O, ABO*A
and ABO*B genes were 0.5752, 0.2578 and 0.16699 respectively. Phenotypic frequencies of
the blood groups in the general study population and in the different ethno-linguistic groups
were in agreement with Hardy–Weinberg equilibrium expectations (P > 0.05). This study
provides the first data, based on ethnic distribution of ABO and Rhesus blood groups in the
Medical students of Haryana and suggests that its general profile is similar to those of
several sub- populations of the region. However, we found some significant differences in
phenotypic distribution amongst major caste groups of Haryana; a close proximity was
observed between Brahmin students of the present study with that of previously studied
groups. Yadav students were found distanced from the other caste groups in the study. This
data will contribute for blood donor recruitment policy and blood transfusion services in the
Medical Colleges.
A Monthly Double-Blind Peer Reviewed Refereed Open Access International e-Journal - Included in the International Serial Directories
International Research Journal of Natural and Applied Sciences (IRJNAS)
Website: www.aarf.asia. Email: editoraarf@gmail.com , editor@aarf.asia Page 58 INTRODUCTION
Blood, being a specialized connective tissue with complete and unchangeable identity,
is useful in identity testing. ABO along with Rh antigens is the major clinically significant
blood group antigens out of identified 400 blood grouping antigens for transfusion purposes
and anthropological studies (Adeyemoet al., 2006). The credit for putting forward the ABO
blood group system goes to Karl Landsteiner (Landsteiner&Weiner, 1940). The genes coding
for ABO and Rh (D) are located on Chromosome nine and one respectively. The antibodies
against red blood cell antigens are called agglutinins and individuals are divided into four
major blood groups i.e. A, B AB and O, according the presence of these antigens and
agglutinins (Ganonget al., 2005). The ABO system derives its importance from the fact that
A and B are strongly antigenic; and anti A and anti B occur naturally in the serum of persons
lacking the corresponding antigen(Bauer,1982). In addition, these antibodies are capable of
producing haemolysis in vivo(Plapp& Beck, 1984). Since last four decades, these antigens
are playing an important role in the studies related to evolution, diseases management and
environment, blood transfusion, organ transplantation, forensic pathology, anthropology and
establishment of ancestral relationship of human (Mollisonet al.,1993) and also facilitates
prevention of complications due to Rhesus Incompatibility (Olubayodeet al., 2013).
Large biological data of Indian populations has been generated by anthropological
studies, andis being extensively used to comprehend the population structure of India;
however, few studies for the state of Haryana’s population are available (Khurana 1956;
Kushwahaet al.1990a, b; Yadav et al. 2001, Singh et al., 2013, Jaggi& Yadav, 2014). The
earlier studies divulges that 72% Indian blood group belongs to the Indo-Aryan, 25% tothe
Dravidian while only 3% belongs to theMongoloid and other ethnic groups
(http://www.bloodbook.com/world-abo.html).The biological variations observed at serological and genetic level facilitates in establishing relationships amongst individuals and
population groups. The uniqueness of Indian population structure lies in division of ethnic
population groups on the basis of caste system.
Haryana (Sanskrit “the Abode of God”), is aNorth West landlockedstate of India.
According to census 2011, Haryana’s population is 2.53 billion, and comprises of 1.35 billion
A Monthly Double-Blind Peer Reviewed Refereed Open Access International e-Journal - Included in the International Serial Directories
International Research Journal of Natural and Applied Sciences (IRJNAS)
Website: www.aarf.asia. Email: editoraarf@gmail.com , editor@aarf.asia Page 59
approximately88.23% of the population, they are followed by the Sikh 6% and the
Muslims 5.78% (mainly Meos). Even though the sex ratio in India has undergone a
commendable improvement since the past decade; Haryana, still has one of the lowest sex
ratio (877 female to 1000 of males) when compared to the national sex ratio of 943:1000. The
state’sdecreasing female sex population is a cause of concern for the state administration and
NGOs working in this field.Haryana has a literacy rate of 75.55% with significant difference
in literacy ratio of male and female (84.06: 56.91). Compounding this problem is Gurgaon,
where SGT University is located, has the lowest sex (854/1000) ratio, amongst the districts,
and has the highest literacy rate in state of 84.7%.
The present study was carried out with the aim of providing information on the
distribution of ABO and Rhesus blood groups among Medical students in Shree Guru Gobind
Singh Tricentenary (SGT) University, Gurgaon, Haryana, India and also to determine the
most common blood groups for purpose of emergency blood transfusion.
MATERIAL AND METHODS
The study was conducted on the randomly selected medical and dental students (age
group 18-22 years) of the SGT University, Gurgaon, Haryana, India. The blood samples were
collected from 570 students after obtaining their consent. The samples were analysed for
blood groups ABO and Rh(D). The basic techniques used were given by Bhasin and Chahal
(1995) and the blood analysis was done using Eryclone monoclonal antibodies. The data were
statistically analysed(expected frequencies and Chi square test forHardy Weinberg
equilibrium (HWE) using S2ABO Frequency Estimator
(http://alf1.cii.fc.ul.pt/~pedro/Soft/ABOestimator/). After analysis, students of the state were further divided into sub-categories as majority of them belong to prominent caste groups. The
sub-categories in which these students were divided are: Jat, Yadav, Baniya, Brahmin,
Punjabi and Other. Other group included students of other castes of Haryana and those
hailing from other states. The students of other state group being statistically in-significant
were excluded from the study. The evolutionary relationship among the studied populations
was also calculated by DISPAN software (http://oat.bio.indiana.edu) and phylogenetic tree was constructed with Mega 6 software (Tamura et al. 2013). The major focus was
A Monthly Double-Blind Peer Reviewed Refereed Open Access International e-Journal - Included in the International Serial Directories
International Research Journal of Natural and Applied Sciences (IRJNAS)
Website: www.aarf.asia. Email: editoraarf@gmail.com , editor@aarf.asia Page 60
with the other Indian populations already published in the literature to get the clear picture of
the genetic makeup of the population and serological diversity of the population.
RESULTS AND DISCUSSION:
Blood samples of 570 medical students were analysed in this study. Amongst these
students, there were 222 male and 348 female students. The scope of the study was restricted
to the students of Haryana state only; and comprised of 179 males and 303 female students. It
is interesting to note here; beside low sex ratio and literacy rate in females of Haryana, the
number of fairer sex studying medical science was pretty high, as compared to the male
gender.
The results of ABO blood groups of students including observed number, reflecting
observed and expected frequencies is given in Table 1. Overall phenotypic frequency for the
complete students was in the following order i.e. ABO*B> ABO*O> ABO*A> ABO*AB.
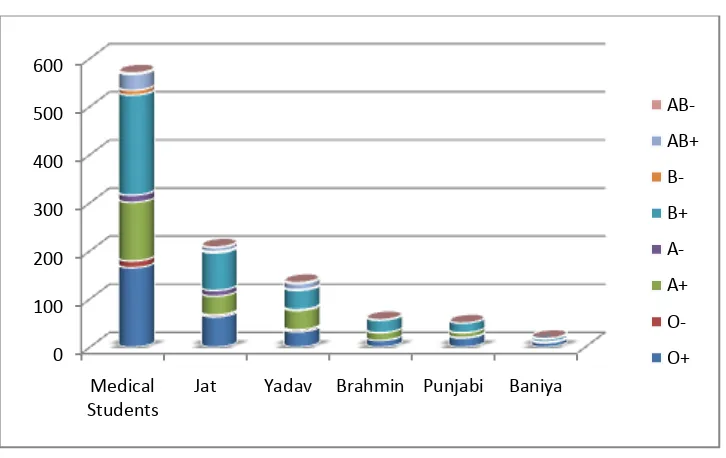
The phenotypic frequencies were highest for ABO*B (38.6%) followed by ABO*O
(30.29%)(Figure 1). The frequencies of ABO*A was observed as 25%, whereas frequency of
ABO*AB group was observed to be comparatively very low (6.02%). Similar pattern was
observed for Jat, Punjabi and Baniya students. However, variation was observed in Yadav
and Brahmin students where the frequency of ABO*A blood group was higher than
ABO*O.Similar observations of high frequency of ABO*A in Brahmin students in
accordance of previous studies(Meitei et al., 2010, Yadav et al., 2011). The observed and
expected allelic frequencies of ABO markers, their standard errors and the percentage of
observed blood groups are also listed in Table 1. There was no significant variation between
the observed and expected frequencies. The allelic frequencies observed for medical students
belonging to Haryana were in the order of ABO*O (0.569148), ABO*B (0.258767) and
ABO*A (0.172085). For Jat students, considerable variations were observed between
observed and expected frequencies; however, no such variation was observed in the case of
other students of Haryana.
Table 1. ABO Data for Medical and Dental Students of SGT University
Pop Blood group
Observed numbers
Percentage frequency
Expected numbers
Allelic frequency
Standard errors
A
ll
S
tud
en
t
s
A 137 24.04 125.39 0.166988 0.011568
B 218 38.25 206.94 0.257817 0.014000
A Monthly Double-Blind Peer Reviewed Refereed Open Access International e-Journal - Included in the International Serial Directories
International Research Journal of Natural and Applied Sciences (IRJNAS)
Website: www.aarf.asia. Email: editoraarf@gmail.com , editor@aarf.asia Page 61
AB 36 6.32 49.08
Total 570 100 569.99 1
H aryan a S tud en ts
A 121 25.01% 108.69 0.172085 0.012751 B 186 38.59 174.25 0.258767 0.015246
O 146 30.29 166.80 0.569148 0.017445
AB 29 6.02 42.93
Total 482
Ja
t
S
tud
en
ts A 51 24.52 44.26 0.158750 0.018718
B 81 38.94 74.59 0.250389 0.022895
O 67 32.21 72.62 0.590861 0.026200
AB 9 4.33 16.54
Total 208 100 208.01 1
Y ad av S tud en ts
A 42 28.97 39.40 0.218562 0.025828
B 53 36.55 50.47 0.269037 0.028222
O 36 24.83 38.07 0.512402 0.032687
AB 14 9.66 17.05
Total 145 100.01 128 0.9999
B rahmi n S tud en ts
A 16 28.07 12.09 0.1677 0.0366
B 26 45.62 22.33 0.2837 0.0460
O 14 24.56 17.15 0.5486 0.0514
AB 1 01.75 5.42
Total 57 100 56.99 1
P un jab i S tud en ts
A 10 18.52 10.16 0.139159 0.034589
B 20 37.04 20.15 0.254318 0.045245
O 20 37.04 19.87 0.606524 0.050962
AB 4 07.41 3.82
Total 54 100.01 54 1
B an iya S tud en ts
A 2 18.52 2.31 0.086584 0.047954
B 6 37.04 6.29 0.216899 0.073232
O 9 37.04 8.73 0.696517 0.081401
AB 1 07.41 0.68
Total 18 100.01 18 1
Overall Heterozygosity(Table 2) observed was 0.577 for all the medical students,
whereas, observed heterozygosity for Haryana students only, in these courses was found to be
0.58066. Highest heterozygosity was observed in Yadav Students 0.62216, followed by
Brahmin students (0.60097). The least heterozygosity was shown in students of the Baniya
community (0.4874).
Table 2.AvarageHetrozygosity of Various Caste Groups
Sr.
No. Caste Group
Average Heterozygosity
Sr.
No. Caste Group
A Monthly Double-Blind Peer Reviewed Refereed Open Access International e-Journal - Included in the International Serial Directories
International Research Journal of Natural and Applied Sciences (IRJNAS)
Website: www.aarf.asia. Email: editoraarf@gmail.com , editor@aarf.asia Page 62 1 All Medical Students* 0.577002 18 HaryanaBanjara 0.666621 2 Haryana students* 0.58066 19 HaryanaKumhar 0.64968 3 Jat students* 0.565758 20 HaryanaSaini 0.646378 4 Yadav Students* 0.62216 21 North Indian
Saraswats
0.613036
5 Brahmin Students* 0.600972 22 Assam 0.557573
6 Punjabi Students* 0.558454 23 Andhra Pradesh 0.482271
7 Baniya Students* 0.487422 24 Goa 0.567205
8 Haryana Meos 0.58621 25 HP 0.628846
9 Haryana Sunni
Muslims 0.600312
26
Jammu and kashmir 0.558857
10 HaryanaJat 0.577001 27 Kerala 0.599202
11 HaryanaAhir 0.582915 28 Maharashtra 0.522222
12 HaryanaRor 0.634935 29 MP 0.587732
13 Saini 0.602925 30 Orissa 0.531328
14 Kamboj 0.590859 31 Rajasthan 0.578474
15 Kumhar 0.564896 32 Sikkim 0.584421
16 HaryanaChamar 0.59656 33 UP 0.607711
17 HaryanaMullah 0.509395 34 West Bengal 0.570949
35 Punjab 0.658973
[image:6.595.135.498.428.657.2] Data from current study
Figure 1. Community Based Blood Group Frequencies in Medical Graduates
Intra population comparison of populations under observation indicated the close
proximity between Baniya and Punjabi students, whereas Jat, Brahmin and Yadav students
were clustered on the other branch (Figure 2).
0 100 200 300 400 500 600
Medical Students
Jat Yadav Brahmin Punjabi Baniya
AB-AB+
B-B+
A-A+
A Monthly Double-Blind Peer Reviewed Refereed Open Access International e-Journal - Included in the International Serial Directories
International Research Journal of Natural and Applied Sciences (IRJNAS)
[image:7.595.117.473.407.749.2]Website: www.aarf.asia. Email: editoraarf@gmail.com , editor@aarf.asia Page 63 Figure 2.Evolutionary Relationships among the Studied Groups.
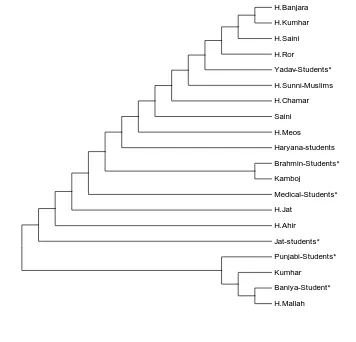
In comparative analysis of current data with thirteen earlier studies of Haryana
populations (Figure 3), it was observed that Haryana students showed maximum genetic
distance from Haryana MullahPopulation (Jaggi& Singh, 2014),but theleast genetic distance
from Meos and Sunni Muslims(Singh et al., 2013). Baniya population had shown the
maximum distance from the Banjara population (Jaggi& Yadav, 2014) of Haryana. The gene
diversity (GST) per loci amongst the 19 populations was 0.0176.
Yadav-Students* Brahmin-Students*
Medical-Students* Jat-students*
Punjabi-Students*
Baniya-Student*
0.001
H.Banjara
H.Kumhar
H.Saini
H.Ror
Yadav-Students*
H.Sunni-Muslims
H.Chamar
Saini
H.Meos
Haryana-students
Brahmin-Students*
Kamboj
Medical-Students*
H.Jat
H.Ahir
Jat-students*
Punjabi-Students*
Kumhar
Baniya-Student*
A Monthly Double-Blind Peer Reviewed Refereed Open Access International e-Journal - Included in the International Serial Directories
International Research Journal of Natural and Applied Sciences (IRJNAS)
[image:8.595.80.512.446.753.2]Website: www.aarf.asia. Email: editoraarf@gmail.com , editor@aarf.asia Page 64 Figure 3. Evolutionary Relationships of 20 Taxa of the Current and Previously Studied
Haryana Populations
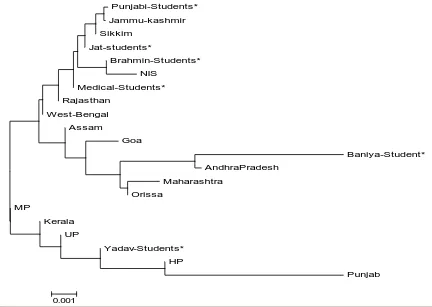
ABO system plays an important role in transplantation, hereditary diseases, genetic
studies and in determining migration of races. Therefore, for the purpose of investigating the
pattern of clustering and affinity with 15 previously studied populations from that of other
states of India, phylogenetic trees were constructed (Figure 4). The average heterozygosity
values ranged from 0.4823 (Andhra Pradesh) (Roychoudhuryet al., 1992) to 0.66662
(Banjara community of Haryana(Jaggi& Yadav, 2014)). The Jat students were clustered with
the previously studied Jat population (Yadav et al., 1997). But the Yadav community from
past study was distanced from the Yadav students of the current study. In contrast to this, it is
interesting to note that Yadav students under study have shown consistently high genetic
distances with other population groups and was clustered in second row.This spectrum
difference for Yadav students from other communities may be attributedto sampling error,
genetic factors, naturalselection which is affected mainly by traditionsand habits (exogamy,
endogamy). The comparison of data study related to the other Indian populations had shown
a close relationship between Brahmins of Haryana and other North Indian Brahmins (Yadav
et al, 2011), pointing towards a common ancestry of these populations.
Punjabi-Students* Jammu-kashmir Sikkim
Jat-students*
Brahmin-Students* NIS
Medical-Students* Rajasthan
West-Bengal
Assam
Goa
Baniya-Student* AndhraPradesh
Maharashtra Orissa
MP
Kerala
UP
Yadav-Students* HP
Punjab
A Monthly Double-Blind Peer Reviewed Refereed Open Access International e-Journal - Included in the International Serial Directories
International Research Journal of Natural and Applied Sciences (IRJNAS)
Website: www.aarf.asia. Email: editoraarf@gmail.com , editor@aarf.asia Page 65 Figure 4. Evolutionary relationships of studied group with Indian population The evolutionary history was inferred using the Neighbor-Joining method. The optimal tree with the
sum of branch length = 0.04306261 is shown. Evolutionary analyses were conducted in MEGA6.
In the analysis of data for Rh (D) factor, 92.632% of the students were observed to be
the Rh+ve and 7.368% Rh-ve; the ratio being 92.946% and 7.0539 (for Haryana students).
Further observations indicate that, Rhesus factor was comparatively higher in females as
compared to males. The high Rhesus negative in the female population is considered
adebilitating issue because of the complexity of Rhesus negative during pregnancy and
childbirth phase of life (Gunston& Botha, 1980).
CONCLUSION
This study has provided additional data which wouldassist in finding the prevalence
of blood group according to the communities; however, fresh data will have to be compiled to
make for changes in inter-caste marriages which is now the current trend.The association of
different blood groups with diseases has been established, as some of the blood groups are
particularly prone to developing certain diseases. The study confirmed that blood group
ABO*B was the commonest of the ABO blood group system in the population studied
(Haryana), while AB blood group was the least. In addition, comparatively high Rhesus
negative in female students warrantsenhanced medical care in the marital life of such
students.
The knowledge of the distribution of ABO and Rh factor in blood groups in the
medical students will be immense use in health care planning, allocation of resources and
targeting the population that need counselling. Such information, well managed can make a
major difference in the quality of decisions that individuals can make especially with regards
to marriage, blood transfusion and other medical issues.
ACKNOWLEDGEMENTS:
We are grateful to all the individuals who volunteered to participate in this study. We also
owe sincere thanks to Mr. SS Chauhan for providing assistance to carry out the research.
A Monthly Double-Blind Peer Reviewed Refereed Open Access International e-Journal - Included in the International Serial Directories
International Research Journal of Natural and Applied Sciences (IRJNAS)
Website: www.aarf.asia. Email: editoraarf@gmail.com , editor@aarf.asia Page 66
1. Adeyemo, O.A., Soboye, J.O. &Omolade, B. (2006) Frequency distribution of ABO, RH blood groups and blood genotype among cell biology and genetics students of University Lagos, Nigeria. African Journal of Biotechnology, 5: (22) 2062 – 2065.
2. Bamidele, O., Arokoyo, D.S. &Akinbola, A.O. (2013) Distribution of ABO and rhesus blood groups among medical students in Bowen University, Iwo, Nigeria.Annals of Biological Research, 4 (11):1-6
3. Bauer, J. D. (1982) Clinical Laboratory Methods, 9th.edition. Mosby Company,
Missouri, pp: 353-76.
4. Ganong, W.F. (2005) Blood types In: Review of Medical Physiology, 22nd ed. Stanford, CT. USA, Appleton and Lange, A Simon And Schuster Co. 537-539
5. Gunston, K.D. & Botha, I. (1980) Rhesus and other blood group incompatibilities in pregnancy.South African Medical Journal, 18;58(16):639-41.
6. Jaggi, S. & Yadav, A.S. (2014) Distribution of ABO and Rh (D) allele frequency among four endogamous populations of Haryana.International Journal of Research in Applied, Natural and Social Sciences. Vol. 2 (2), 77-80
7. Khurana, B.K. (1956) ABO blood group investigation among the Jat of Rohtak
(Punjab).Man in India, 36: 224-227.
8. Khan, M. I., Micheal, S., Akhtar, F., Naveed, A., Ahmed, A. &Qamar R. (2009)
Association of ABO blood groups with glaucoma in the Pakistani population.
Canadian Journal of Ophthalmology, 44: 582–586.
9. Kushwaha, K.P.S., Chahal, S.M.S., Bansal, I.J.S., Chugh, O.P. & Sarojani, S. (1990). Serogenetic Variation in Four Caste Populations of Haryana, India.Human Heredity. 40:262–266.
10.Landsteiner, K. & Weiner, A.S. (1940).An agglutinable factor in human blood
recognized by immune sera for rhesus blood.Proceedings of the Society for
Experiental Biology and Medicine, 43: 223-224.
11.Meitei S.Y., Asghar, A., Achoubi, N.D., Murry, B., Saraswathy, K. N. &Sachdeva. M.P., Distribution of ABO and Rh(D) blood groups among four populations in Manipur, North East India. Anthropological Notebooks 16 (2): 2010, 19–28.
12.Mollison, P.L., Engelfriet, C.P. &Conteras, M.(1993) ABO, Lewis Ii and P Groups. In Blood Transfusion in Clinical Medicine, (Ed: Mollison PL, Engelfriet CP, Conteras M), Oxford: Blackwell Scientific Publications, 9th Edition, 4,150-51.
A Monthly Double-Blind Peer Reviewed Refereed Open Access International e-Journal - Included in the International Serial Directories
International Research Journal of Natural and Applied Sciences (IRJNAS)
Website: www.aarf.asia. Email: editoraarf@gmail.com , editor@aarf.asia Page 67
14.Seeley, R.R., Stephens, T.D. & Tate, P. (1998) Anatomy and Physiology. 4th Edn.,
The McGraw Hill Companies, Inc., USA, pp: 1098
15. Roychoudhury, A.K. (1992)Genetic relationships of the populations in eastern
India.Annals of Human Biology, 19(5): 489-501
16.Singh, S. & Yadav, A.S. (2013) Serological Variation in Meos and Sunni Muslims
and Comparison with Other Castes of Haryana.Anthropologist, 15(2): 245-248.
17.Tamura, K., Stecher, G., Peterson D., Filipski, A. & Kumar, S. (2013) MEGA6: Molecular Evolutionary Genetics Analysis version 6.0. Molecular Biology and Evolution, 30 2725-2729.
18. Worlledge, S., Ogiemudia, S.E., Thomas, C.O., Ikoku, B.N. &Luzzutto, L. (1974) Blood group antigens and antibodies in Nigeria. Annals of Tropical Medicine and Parasitology, 68: 249-264.
19.Worlledge, S., Mourant, A.E., Kopec, A.C. &Domaniewskasobczak, K. (1966) The Distribution of the Human Blood Groups and Other Polymorphsisms. Oxford University Press, London, pp: 117-122.
20.Yadav, B., Raina A., Abdullaha T. &Dogra T.D. (2011) Serological Polymorphisms
at ABO and Rh(D) Blood Groups among Saraswat Brahmin Community of four
North Indian States. The Anthropologist, 13(1): 17-20.