2018 International Conference on Computer, Communications and Mechatronics Engineering (CCME 2018) ISBN: 978-1-60595-611-4
Vertical Tank Bottom Increment Measurement System
Based on Wireless Sensor Network
Jia-nan SHI
1,*, Rong-qi YANG
2, Bin SUN
1and Yu-xiao ZHAO
11China Jiliang University, Hangzhou 310018, Zhejiang Province, China
2Shanghai Merchant Ship Design and Research Institute, Shanghai 201203, China
*Corresponding author
Keywords: Bottom increment, Vertical tank, Wireless network.
Abstract. Aiming at the problem that the large vertical tank bottom increment is difficult to accurately measure, a bottom incremental field measurement system based on wireless sensor network was developed. The high-precision pressure sensor is used to measure the height difference of the measuring points inside the tank, and the bottom increment value and the three-dimensional figure at the corresponding temperature are output. The system realized the wireless networking of the on-site measurement nodes, which is quick to install and requires no wiring. The experimental results show that the method meets the requirements of field application and has good use value.
Introduction
At present, the measurement of the vertical tank is still offline, is that, manual geometric measurement or three-dimensional laser scanning measurement is performed in the empty can state. The vertical tank bottom incremental wireless measurement system mentioned in this paper can measure the bottom increment in real time in the vertical tank filled with liquid by arranging the wireless level measurement module at the bottom measurement point.
Basic Principle of Bottom Increment Measurement
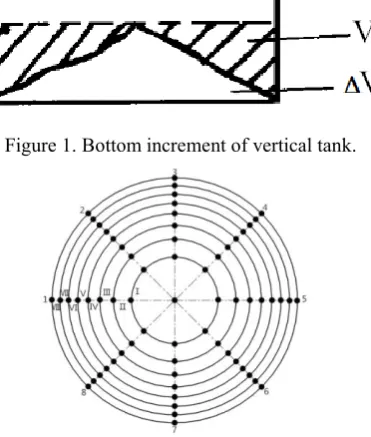
As shown in Figure 1, the bottom of the vertical tank is irregular in shape, and the bottom increment is the tank bottom capacity below the highest point plane of the tank bottom [1]. Calculating the bottom increment and its unevenness correction value can regard the bottom of the tank as a non-standard cone, and divide the bottom circle of the cone into m concentric circles, the distance from the center of the tank bottom to the concentric circle is determined by the condition that the area of the divided circle (the center is the circle) is equal. These concentric circles divide the cone into a small cone and a plurality of circular truncated cone. Each concentric ring evenly distributes n points which are shown in Figure 2. Measuring the heights of n points to the center of the can bottom and adding the volume of each ring, we can get the unevenness correction value, such as equations (1):
∆𝑣𝑐 = 𝜋𝑟2[1
3𝑘∑ ℎ0+
𝑛
1 6𝑘7 ∑ ℎ𝑛1 1+𝑘1∑ (ℎ𝑛1 Ⅱ+ ℎⅢ+ ⋯ + ℎ𝑚−1)]. (1)
Where: k is the number of divided pieces at the bottom of the tank, k=m*n; r is the bottom radius of the tank;
h0 is the height of the center point of the tank bottom;
hm-1 is the height of the measuring point on the circumference (m-1).
Accordingly, the bottom increment of the tank vi can be obtained by following the equations (2):
𝑣𝑖 =𝜋𝑟
2
𝑛 ∑ ℎ0
𝑛
Figure 1. Bottom increment of vertical tank.
Figure 2. Distribution of measurement points at the bottom of the tank.
The Composition of The Wireless Measurement System
Working Principle of The System
This design uses a level measurement module based on pressure measurement [2]. As shown in Figure 3, the liquid level measuring module is fixed to each measuring point. When a liquid of a certain height is injected into the vertical tank, the pressure of each measuring point is different due to the deformation of the bottom. The liquid level module measures the pressure value pi of the measuring point and converts pi to the height hi (the vertical distance from each measurement point to the reference liquid level), and sends it to the upper computer through the wireless network. The flow chart is shown in Figure 4.
Figure 3. Overall structure of the system. Figure 4. System work flow chart.
Module Hardware Composition
As shown in Figure 5, the liquid level measuring module is mainly composed of diffused silicon sensor, PT100 temperature sensor, AD conversion circuit, and wireless module.
The diffused silicon pressure sensor[3] is used to get the pressure at the measuring point. The selected sensor output full range voltage is about 100 mV, after signal amplification and conversion circuit converted to 0-5V output [4].
[image:2.595.92.504.482.607.2]The function of the ad conversion circuit is to convert the sensor output voltage into a digital signal. The system uses the 24-bit ad chip ads1256 which has the advantages of low nonlinearity, high sampling rate [7]. The controller stm32f103c8t6 communicates with the ads1256 via spi.
The wireless module uses a 170M low frequency wireless module. Due to the large signal attenuation in the water, the use of low-frequency wireless modules can greatly reduce the loss of wireless signals. It communicates with stm32 via ttl.
Software System
This system uses labview software as the development platform of the host computer software, and calls the matlab program script in labview for data processing.
The software system has the functions of data acquisition, calculation, display and forming three-dimensional graphics of vertical tank bottom. The flow chart of the operation is shown in Figure 6 below.
[image:3.595.192.402.601.758.2]
Figure 5. Hardware connection diagram of the module. Figure 6. Software running process.
Verification Experiment
Simulation Verification Experiment
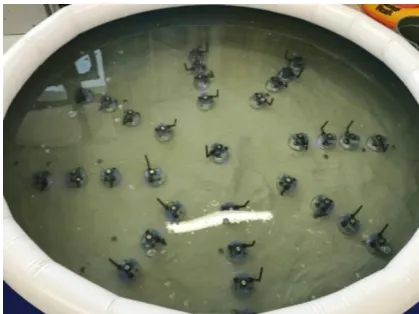
In order to verify the practicability of the system, we first carried out the bottom amount simulation experiment. A sink with a diameter of 2.3m was built indoors, and 140 dm3 quartz sand was placed in the tank to simulate the deformation of the bottom of the vertical tank. Due to the small size of the water tank, the liquid level measuring module is distributed according to the 4-ring (8 points per ring), injecting water until it reaches a certain distance from the highest point of the sand pile, as shown in Figure 7 below.
After the liquid level is stabilized, the liquid level values at each point are measured, and the obtained values are shown in Table 1 below.
Table 1. Simulated bottom incremental measurements (25.3 ° C).
Radius number
Height of each point[mm]
0 I II III IV
0-1 190 250 290 301 308
0-2 190 248 295 305 313
0-3 190 262 285 300 311
0-4 190 258 278 293 307
0-5 190 270 295 305 313
0-6 190 280 290 302 310
0-7 190 230 275 298 309
0-8 190 228 283 300 310
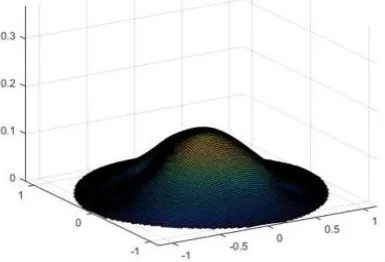
[image:4.595.204.397.316.447.2]According to the Eq. 1, we can calculate that Δvc=144.9dm3, and the measurement error was 3.5% while the bottom three-dimensional map was obtained as shown in Figure 8 below.
Figure 8. 3D diagram of the bottom of the simulation experiment.
Vertical Tank Experiment
In order to verify the accuracy of the measurement system in the actual measurement, this experiment selected 5000m3 vertical tank of an oil storage base in Zhoushan Zhejiang province as the experimental object. We used the total station scanning method and the wireless measuring system device to make a comparative measurement of the bottom increment of the vertical tank.
The total station scanning experiment adopts the tps1101 total station instrument produced by Leica Company of Switzerland. Under the drive of special software, the total station can automatically measure the horizontal section according to a certain vertical spacing.
[image:4.595.194.406.658.756.2]The basic working principle of the total station in the vertical tank measurement is shown in Figure 9 above. Using the total station to measure the height of each plate, and then scan to obtain the radius data in Table 2, according to the data obtained can be compiled for the tank capacity, the results are shown in Table 3. From this table, the vertical tank bottom amount is 95.896 m3.
Table 2. Height of the measuring point at the bottom of the vertical tank (28.5 ° C).
Radius number
Height of each point[mm]
0 I II III IV V VI VII VIII
[image:5.595.100.497.253.409.2]0-1 1224 1286 1328 1363 1351 1374 1393 1413 1418 0-2 1224 1280 1329 1367 1378 1407 1416 1404 1418 0-3 1224 1291 1327 1359 1386 1407 1406 1417 1422 0-4 1224 1284 1322 1358 1358 1373 1402 1409 1418 0-5 1224 1302 1312 1351 1358 1378 1402 1409 1420 0-6 1224 1286 1343 1356 1380 1405 1416 1412 1413 0-7 1224 1305 1316 1354 1364 1381 1390 1406 1417 0-8 1224 1280 1347 1364 1369 1391 1402 1404 1408
Table 3. Bottom incremental reference volume.
Reference height: 17863[mm] Capacity unit: [dm3]
Height [cm]
Height[mm]
0 1 2 3 4 5 6 7 8 9
0 237 304 386 480 574 668 784 905 1049 1214
1 1391 1589 1788 2020 2252 2484 2716 2948 3181 3413 2 3645 3877 4120 4363 4617 4882 5148 5413 5678 5954
. . . . . . . . . . . . . . . . . . . . . . . . . . . . . . . . . 17 82358 83035 83712 84389 85066 85743 86420 87097 87773 88450 18 89127 89804 90481 91158 91835 92512 93189 93865 94542 95219
19 95896 / / / / / / / / /
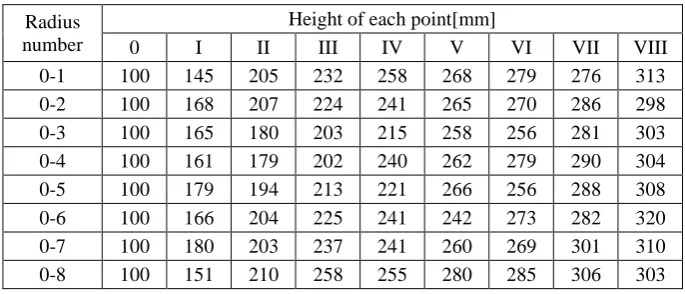
In the vertical tank to be tested, the liquid level measuring module is distributed according to the measuring point shown in Figure 2. The scene is shown in Figure 10. Injecting water until it reaches a certain distance from the highest point of the bottom. After the liquid level is stabilized, measuring the liquid level values at each point, and the obtained values are shown in Table 4 below.
[image:5.595.104.509.473.597.2] [image:5.595.314.508.474.596.2][image:5.595.126.469.631.778.2]
Figure 10. Field experiment diagram. Figure 11. 3D diagram of the bottom of the vertical tank. Table 4. Height of the measuring point at the bottom of the vertical tank (28.5 ° C).
Radius number
Height of each point[mm]
0 I II III IV V VI VII VIII
0-1 100 145 205 232 258 268 279 276 313
0-2 100 168 207 224 241 265 270 286 298
0-3 100 165 180 203 215 258 256 281 303
0-4 100 161 179 202 240 262 279 290 304
0-5 100 179 194 213 221 266 256 288 308
0-6 100 166 204 225 241 242 273 282 320
0-7 100 180 203 237 241 260 269 301 310
According to the Eq. 1, vi=93237.7 dm3, with the total station measured value of 95896 dm3 as the standard value, the measurement error is 2.8%, and the bottom three-dimensional shape is obtained as shown in Figure 11 above.
Conclusion
This paper develops a set of bottom wireless measurement system based on the vertical measurement method of vertical tank bottom. The system includes a host computer based on labview and matlab software and a wireless liquid level measurement module made of diffused silicon pressure sensor. It can measures the bottom increment of the vertical tank and forms a three-dimensional graphic at the bottom.
The wireless measurement system has the advantages of high precision, convenient construction and installation, high cost performance, and less wiring, and has a good application prospect in the field of incremental measurement at the bottom of the vertical tank.
References
[1] JJG168- 2002 Verification Regulation of Vertical Metal Tank Capacity. Beijing: China Institute of Metrology, 2002.
[2] Salah I. Yahya. A Multi-Level Storage Tank Gauging And Monitoring System Using A Nanosecond Pulse, J. International Journal of Engineering Trends and Technology (IJETT). 5(1)(2013) 17-24.
[3] P. Ciam polini, A. Rossi, A. Pierantoni, M. Rudan. Electro-elastic simulation of a piezoresistive pressure sensor, J. Microelectronics Journal, 26(2)(1995) 256-272.
[4] Hu Xiufang, Zhang Ai, Chen Yan. A Circuit Design of 4~20mA Pressure Transmitter, J. China Instrumentation. 5(2002) 17-18.
[5] Wen-Tsai Sung, Jui-Ho Chen, Ching-Li Hsiao. Data fusion for PT100 temperature sensing system heating control model, J. Measurement, 52(2014) 94-101.
[6] Jin Weizheng. The New Kind of 4—wire Temperature Measure Circuit Using Pt100, J. Electronic Measurement Technology, 2(2000) 27-28.