2019 International Conference on Artificial Intelligence, Control and Automation Engineering (AICAE 2019) ISBN: 978-1-60595-643-5
Study on Optimization of Drag Characteristics of Large Civil Airliners
Lu YE, Gan-chao ZHAO and Yu WANG
Flight Technology College, Civil Aviation Flight University of China, Guanghan 618307, China
Keywords: Large Civil Airliners, Optimization of Drag Characteristics, Vortex Generator, After Body End Plate, Vertical Section add to the Lateral Section of Winglets Style.
Abstract. In order to reduce the drag of large civil airliners and improve the economy of their operation, this paper chooses the shape of a typical large civil airliner as the research object, analyses the causes and classifications of the drag of large civil airliners, and puts forward the drag reduction measures for different sources of drag by means of numerical simulation. The results show that the frictional drag can be reduced by installing vortex generator on the rear body of the fuselage, the form drag can be significantly reduced by installing the after body end plate, improving high angle of Attack Performance and the induced drag can be further reduced by using the vertical section add to the lateral section of the winglets. The results can lay a theoretical foundation for aerodynamic shape design and optimization of large civil airliners.
Introduction
Through the statistical analysis of QAR monitoring data of civil aircraft fleet of airlines, it can be seen that the drag of aircraft has a tremendous impact on the economy of airline operation, especially the economy of fuel. It can be seen that by optimizing the drag characteristics of aircraft, the range can be increased, the cruise lift-to-drag ratio can be increased, the fuel can be saved, and the payload can be increased. And reduce the direct operating costs of aircraft. In addition, reducing drag can reduce the emission of aircraft exhaust, thereby reducing environmental pollution, which is particularly important in the rapid development of science and technology today.
Based on the previous research results, this paper analyses the classification and causes of the drag of large civil airliners, and puts forward corresponding measures for reducing and optimizing the drag according to the characteristics and proportion of different types of drag[1].
Analysis of Drag Source of Large Civil Aircraft
At present, the cruising speed of large civil aircraft is generally around Mach 0.8, which belongs to the subsonic range. For low-speed and subsonic civil aircraft, drag is mainly divided into two categories: one is caused by air viscosity, called Parasite Drag, which includes friction drag, form drag and interference drag; the other is caused by lift, called induced drag[2].
According to the theory of boundary layer, when air flows through an airplane, the velocity of air close to the surface of the airplane is always equal to zero. According to Newton's third law, the air with zero velocity will inevitably give a reaction force to the surface of the airfoil. The direction of the reaction force is opposite to the direction of motion, that is, friction drag. Friction drag is closely related to the type of boundary layer. The position of transition point determines the magnitude of friction drag. The flight speed and the roughness of the aircraft surface determine the position of the transition point. With the increase of flight speed, the transition point moves forward, and the friction drag increases. The rougher the surface of the aircraft, the forward of the transition point, and the friction drag increases. Furthermore, the frictional drag is also related to the size of the aircraft's contact area. The larger the surface area of the aircraft is, the greater the friction drag [1,2].
wing. The magnitude of form drag is related to the location of separation point. The position of separation point depends mainly on the angle of attack. The larger the angle of attack, the forward of the separation point and the greater the form drag[2].
The airflow flows through the joint of the wing and the fuselage. In the middle part of the joint, because the wing surface and the fuselage surface protrude outwards, the flow tube shrinks, the flow velocity accelerates, and the pressure decreases. In the latter section, because the wing and fuselage surfaces are bent inward, the flow tube expands, the flow velocity decreases, and the pressure increases. In this way, the counter pressure gradient of the wing-body junction is increased, the separation point of the airflow is moved forward, and the eddy region behind the wing-body junction is enlarged, resulting in additional drag. This drag is caused by the interaction of airflow, which is called interference drag.
When the airflow flows through the wing, the downwash of the airflow is caused by the existence of tip vortices, which changes the direction of the original relative airflow velocity, and makes the lift lean backward. The backward leaning lift decomposes a force that hinders the aircraft from advancing in the direction of the relative airflow velocity, which is the induced drag [2].
Among the four types of drag mentioned above, friction drag accounts for 50% of the total drag, induced drag 30%, form drag 15% and interference drag 5%.Therefore, reducing friction, form and induced drag is of great significance for optimizing the drag characteristics of aircraft. However, at present, the reduction of drag at home and abroad is limited to the conventional drag reduction methods, such as reducing the roughness of the aircraft surface, streamlining the aircraft shape and installing traditional winglets. On this basis, this paper proposes to further optimize the drag characteristics by installing a vortex generator, after body end plate and vertical section add to the lateral section of winglets style [3].
Research Methods
In this paper, three-dimensional Reynolds average N-S equation is used as the governing equation. Selection k-ε of turbulence model [4].
Control Equation
The general form of three-dimensional Reynolds average N-S equation in Cartesian coordinate system can be written as follows:
i j
W F G
t x x
Among them: xi yi zi ij j u pi u v pj v
w w pk
E E pv v
0 V ˆ V ˆ V
W F G
ˆ V q ˆ V , ,
In the formula: is density; u,v,w is three components of velocityV; P is static pressure; E is total energy; is viscous shear stress term; qis heat conductivity.
Discrete Schemes for Control Equations
Turbulence Model
Taking RNG turbulence model, the equation is as follows:
2 2 2
k eff t t
i i
Dk k
S M
Dt x x
2 2 1 2 eff t i i D
C S C R
Dt x x k k
Among them: t C k2
, a2
k Mt
, S 2SijSij ,
3 2 0 3 1 1 u C R k
In the formula, K is the unit volume turbulent flow energy; is the unit volume turbulent flow energy dissipation rate; kandεis the inverse effect of Prandtl pair respectively tok and ; a is the
local sound velocity; R is the addition term; 1 2 j i ij i j u u S x x
is the strain rate tensor, C1 , C2
, C, ,
0
η is the constant.
The boundary conditions are non-slip at the surface and free flow at the far field. The convergence accuracy of the residual error is 5
10 .
Grid Generation
The main reason for the deviation of drag prediction is the uncertainty of grid and turbulence model. Therefore, for different grid topological structures, O-H grid is selected, the basic configuration is used to calculate the total number of grids of 6 million, the first grid size is 10-5 cA (cA is the average aerodynamic chord length of the whole machine), and the growth ratio of boundary layer is 1.16[4] There is no slip condition at the surface and free flow condition at the far field. The accuracy of residual convergence is 10-5[8].
Study on the Influence of Vortex Generator on Friction Drag
The vortex by the vortex generator brings the high momentum air flow outside the boundary layer into the boundary layer, increases the mixing of the air flow inside and outside the boundary layer, increases the momentum of the air flow inside the boundary layer, increases the ability to overcome the pressure gradient, delays the separation of the air flow, and achieves the effect of increasing lift and reducing drag. Based on the previous research results, the parameters of the micro-vortex generator designed for the rear body of the fuselage are considered as follows: the position of the separation line of the rear body and the thickness of the boundary layer therein; the geometric parameters of the vortex generator; the installation position and angle of the vortex generator on the fuselage; the layout of the vortex generator on the fuselage, including the arrangement of the vortex generator, and the thickness of the boundary layer therein. Spacing and rotation direction, etc. The layout and local magnification of the vortex generator are shown in Fig. 1. The computational grid is shown in Fig 2.
[image:3.595.77.510.117.222.2]
Figure 1. The figure of vortex generator Arrangement Position. Figure 2. Grid for Model.
The numerical results of the original model and the model with vortex generator show that the friction coefficient of the original model is 0.00631, and that of the model with vortex generator is 0.00583, which reduces the friction drag by about 7%.
drag. This is because the vortex generator changes the flow pattern in the rear body boundary layer, makes the velocity and kinetic energy in the boundary layer increase, enhances the anti-separation ability of the boundary layer, and leads to the reduction of frictional drag. At the same time, the thickness of the boundary layer decreases with the eddy current generator near the busbar below the rear body symmetry plane.
Figure 3. Streamline and Pressure Distribution Diagram after adding vortex generator.
Study on the Influence of after Plate on Form Drag
The main reason for the form drag is that the boundary layer separation occurs in the airflow behind the aircraft, resulting in vortices. The pressure difference caused by the low pressure of the vortices and the high pressure in front of the aircraft is the form drag. By installing the after plate on the fuselage rear body, the vortex generated by the after plate can effectively control the airflow separation and vortices in the fuselage rear body flow field, and achieve the purpose of reducing the form drag [6]. The layout of the after plate is shown in Figure 4. The computational grid is shown in Figure 5.
[image:4.595.373.525.366.414.2]
Figure 4. The figure of rear body end plate Arrangement Position. Figure 5. Grid for Model.
[image:4.595.104.500.571.626.2]Figure 6 shows the streamline and pressure distribution of the original model and the after plate of the rear body. It can be seen that, compared with the reference shape, the separation line of the rear body surface with after plate still exists, but the strength decreases. From the pressure distribution of the fuselage rear body, the pressure coefficient of the fuselage rear body is changed after the after plate is installed, the low pressure of the fuselage rear body is reduced, and the form drag performance is improved. Moreover, the after plate can effectively rectify and isolate the upper and lower surface streamlines, the convergence of the limit streamlines is weakened, and the parallelism with the horizontal datum line of fuselage structure is obviously improved. The streamlines pass through the rear body smoothly, without obvious three-dimensional separation flow and wake formation [7].
Figure 6. Streamline and Pressure Distribution Diagram after Adding rear body end plate.
According to the flow situation of the rear body of the fuselage in Fig. 7, there are two pressure gradients in the direction of flow and circumference after the after plate is installed, but the pressure gradients in both directions are reduced to varying degrees, so that the form drag decreases.
[image:4.595.87.231.697.754.2][image:4.595.320.497.706.754.2]
Study on the Influence of Vertical Section Add to the Lateral Section of Winglets on Induced Drag
[image:5.595.133.464.200.265.2]The mechanism of induced drag shows that reducing the intensity of tip vortices can reduce induced drag. At present, the traditional method is to install winglets at the tip of the wing, that is, to add a vertical section at the tip of the wing. Based on the traditional vertical section, the lateral section is added to optimize the induced drag performance of the wing. The model is shown in Figure 8. The computational grid is shown in Figure 9.
Figure 9. Grid for Model.
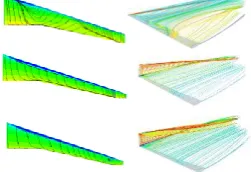
The numerical results show that the induced drag coefficient of the basic wing is 0.00163, and the induced drag coefficient is 0.00148 when the vertical and lateral wing tips are installed, which reduces the induced drag by about 9%. Fig. 10 shows three wing flow patterns at M=0.6 and a=7 degrees. At this time, the basic wing has stalled. With the addition of vertical section, the surface flow of the basic wing changes greatly. The secondary separation flow along the leading edge of the wing no longer exists. Instead, the leading edge separation bubble is replaced by the secondary separation flow, and then the flow is re-attached to. For vertical section add to the lateral section of winglets, the surface flow of basic wing is further improved compared with that with vertical wing. The secondary separation zone on the trailing edge outside the turning point of the wing has disappeared, stall characteristics have been improved, lift has increased and drag has decreased.
Figure 10. Streamline Diagram after Vertical Section add to the Lateral Section of Winglets.
From the point of view of tip vortices, a large area of separated wake vortices from the outer and outer wings of the basic wing is involved in the tip vortices, which increases the strength of the tip vortices. The distribution of the wake vortices along the extended streamlines and vortices behind the wing with vertical section is more uniform, and the tendency of wake vortices rolling up downstream of the wing tip is more distant; the distribution of the extended streamlines and vortices behind the wing with horizontal section is more uniform, and there are signs of loose wake vortices rolling up at the wing tip, but the intensity is very weak. As a result, compared with the basic wing, the induced aerodynamic performance of the conventional winglet with lateral section on the vertical section is improved by about 11%, and the induced aerodynamic performance of the conventional winglet with vertical section is improved by about 4%.
Summary
[image:5.595.235.361.432.518.2](1) The vortex generator increases the kinetic energy in the boundary layer and makes the friction drag significantly smaller.
(2) Installing rear body after plate can effectively improve the flow of aircraft rear body, weaken the strength of vortices, and reduce form drag.
(3) A new type of wingtip winglet withvertical section add to the lateral section of winglets greatly weakens the strength of tip vortices, improves the flow on the wing surface and reduces the induced drag.
Acknowledgement
This research was financially supported by the National Science Foundation. Name:Research on Joint Planning Method for Hub Network and Fleet of Large Network Airlines; Number: U1733127
References
[1] Liu Peiqing, Zhang Wen, Guo Hao. Drag Reduction Technique For Large Transport Aircraft[J]. Mechanics in Engineering, 2018, 40(2): 129-139.
[2] Ye Lu, Chen Hongying, Zhou Zeyou. Aerodynamics and Flight Principles[M].Dalian: Maritime University Press, 2019:59-68.
[3] Zhang Yongsheng, Liu Dan, Lang Weidong. Effects of Geometry Parameters on Drag about Afterbodies of Transport Aircraft[J]. Chinese Quarterly of Mechanics. 2013, 34[4]: 114-118.
[4] Zhang Jianjun, Zhang Binqian, Wang Yuanyuan, et al. A Study of Drag Reduction of Strakes for the Upswept Afterbody of a Transport Aircraf. Mechanical Scienceand Technology for Aerospace Engineering, 2009, 28[6]: 26-29.
[5] Ye Lu, Zhou Zeyou. Drag Characteristics of Civil Aircraft Fuselage's Afterbody End Plate[J]. Chinese Hydraulics & Pneumatics, 2018, (12): 25-29.
[6] Barckmann K, Tropea C, Grundmann S. Attenuation of Tollmien-Schlichting Waves Using Plasma Actuator Vortex Generators. AIAA Journal, 2015, 53(5): 1384-1388
[7] Shahinfar S, Sattarzadeh SS, Fransson JHM, et al. Revival of Classical Vortex Generators Now for Transition Delay. Physical Review Letters, 2012, 109(7): 074501