IN Ke 3 DECAY
Thesis by
John Daniel Gallivan
In Partial Fulfillment of the Requirements For the Degree of
Doctor of Philoso~hy
California Institute of Technology Pasadena, California
1971
:LL
/\CKNO WL~DGBMEN'm
The experiment described in this thesis was a major effort, even by the standards of high energy physics, and its success de-pended on a large number of physicists, technicians, prograrrrrners and
scanners. In the course of this work, the author was influenced by many people. It is a pleasure to thank Professor Charles Peck, as
academic advisor, for his patient and sympathetic guidance, and
Professor Frank Sciulli, who supervised most of the research described herein, and who taught by example as much as by persuasion. The
author also acknowledges the stimulating environment of the Caltech User's Group, in particular Professors David Binnie, Ricardo Gomez,
and Alvin Tollestrup, and the cooperation of Michael Mallary as fellow graduate student on the experiment.
The Bevatron operations staff and members of the Lofgren Group at the Lawrence Radiation Laboratory gave invaluable assistance during the preparation and operation of this experiment at the
Bevatron. A. Lake, D. Sell, W. Friedler, H. Grau, S. Sedleniek, and D. Toomer contributed to the design and construction of the equip-ment. Messrs. D. Chu, P. Walden, K. Young, G. Murata, and J. Stanley assisted in the setup and running stages of the experiment. Messrs. C. Lam, D. Molodowitch, J. Tam, and L. Young assisted materially in the data analysis. The scanning and measuring staff was supervised by J. Ferrari and included J. Edwards, M. Jolli.ff, M. Jordan, J. Lyon
author much acs is tan cc in progranuning and computer opernt:i.onn. 'J'hc contribut:i.ons of Dr. Bruce Sherwood who des:i.gned. the PDP-II progrrun
EXPO, and Dr. James Van Putten who designed and built the lead plate spark chambers, are sincerely appreciated. Finally, this manuscript is evidence of Virginia Franklin's typing skill.
iv
ABSTRACT
The complex quantity X
=
(amplitude of the 68=
-t::.Q process ~~ ~-e+v/amplitude of the 68= +6Q process
K0~ ~-e+ v) has been measured in a counter-spark-chamber eXJ>eriment at the LRL Bevatron. Assuming CPr invariance, ImXI
0 implies CP-violation in the decay. K0- mesons were produced in two brass targets by 2.85 GeV/c pions. A series of veto counters and hodoscopes selected neutral decays into two charged particles. The electron and pion were identified by (1) pulse height in a Freon 12 threshold Cerenkov counter, (2) visual appearance in three radiation lengths of lead, and (3) pulse height in a set of fourteen shovrer counters. From 240K pictures, 1,079 events were isolated with a (2 ~ 1)% background level. A maximumlikelihood fit to the ~-e+ and ~+e- time distributions gave the result: Rex = -.069 ~ .036
I.mX ~ +. 108 +.092 -.074
This result is within two standard deviations of X = 0 and therefore consistent with it (relative probability= 0.25). It is, on the other hand, more than four standard deviations from the existing world
average (+0.14, -0.13) and therefore inconsistent with it (relative probability< 3.3 x 10⁻⁴). Sensitivity of the result to a large number of possible sys~ematic effects was investigated and it was
PART
I.
II.
III.
TV.
v.
T.f\.BLE OF CONTENTS
TITLE
INTRODUCTION (A)
(B)
Theoretical Background of the £:::.S
=
b.Q Rule0
Ke 3 Decay
(C) History and Current Status of the £:::.S
=
b.Q Rule(D) Experimental Measurement of X (E) This Experiment
EXPERIMENTAL APPARATUS
(A) General Features of the Apparatus
(B) Triggering Components of the Apparatus (C) Data Recording Components
DATA ANALYSIS AND BACKGROUNDS (A) Scanning
(B) Measuring and Event Reconstruction (C) Final Selections
(D) Estimation of Remanent Background
EFFICIENCY CALCULATION AND MAXIMUM LDCELIHOOD FITS (A) Ke
3 Efficiency Calculation
(B) Maximurn Likelihood Fitting of Data CONCLUSIONS AND OUTLOOK
PAGE
1
1
6
9 13
15
19
19
23 26
32 33 42 50
58
71
71
85
vi
TJ\.DLE OF CON1.PEN1rS (Cont l. nucd)
PAI~r '1~I'l1Ll~
VI. APPENDICES
VII. REFERENCES
Pf\Gl!:
103
173
t (
t
t I ! ~l
I
NUMBER
1.
2. 3. 4. 5.
6.
7. 8.
9.
10.
ll.
12.
13.
vii
APPENDICES
TITLE
Theoretical Supplement Pion Beam
Targets and Target Counters Spark Chambers
Freon Cerenkov Counter
Hodoscopes and Shower Counters Fast Electronics and Trigger Logic Slow Electronics and Computer Data-taking Procedures and Checks Scanning Procedures ·
Measuring, Reconstruction and Track Fitting Monte Carlo Program
Smearing of Time Distributions Used in Maximum Likelihood Calculation
PAGE
103 110 114
119 124
129 135 140
FIGURE
1.
2. 3.
4. 5.
6.
7.
8.
9.
10.
11. 12.
13.
14.
15.
16.
viii
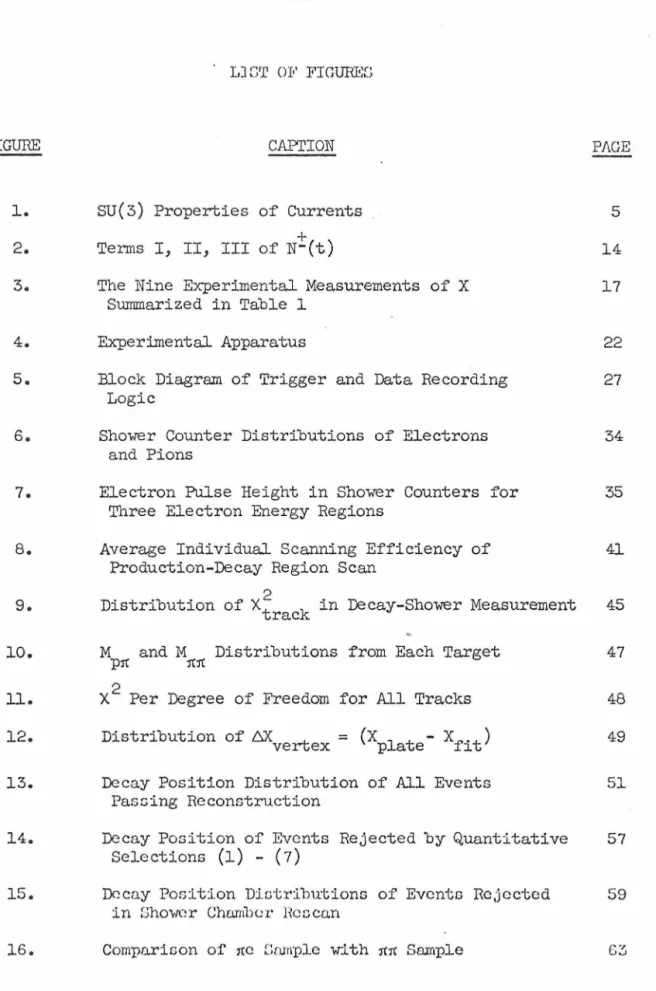
LJ S'r 01" FIGURE[;
CA.Pl'ION
SU(3) Properties of Currents +
Terms I, II, III of N-(t)
The Nine Experimental Measurements of X Sunnnarized in Table 1
Experimental Apparatus
Block Diagram of Trigger and Data Recording Logic
Shower Counter Distributions of Electrons
and Pions
Electron Pulse Height in Shower Counters for Three Electron Energy Regions
Average Individual Scanning Efficiency of Production-Decay Region Scan
Distribution of Xt2 k in Decay-Shower Measurement
rac
M and M Distributions from Each Target
pre rcrc 2
X Per Degree of Freedom for All Tracks Distribution of !:iX ve rt ex = (X l t -p a e Xf.t) i
Decay Position Distribution of All Events Passing Reconstruction
Decay Position of Events Rejected by Quantitative
Selections
(1) -
(7)
Decay Posi t:i.on Dl.ctr:ibutions of Events Re;jccted
in ShO\·tCr Chamber nccca.n
Comparison of rec Srunple with rcrc Sample
PAGE
5 14 17
22
27
34
35
41
45
47
48
49
51
57
FIGURE
17.
18.
19. 20.
21.
22.
23.
24.
25.
26. 27.
28.
29.
30.
31.
32.
LIST OF FIGURES (Continued)
CAPI'ION
M + - Distributions from Lead Converter and
e e
rce Sample
M Distributions for e+ and e Events
ep
Sketch of K0- production Distributions
Comparison of Calibration Data and Monte Carlo for Momentum and Angle Distributions from Each Target
Comparison of Decay Position Distribution for Calibration Data and Monte Carlo from Each Target
Mean GC Pulse Height as a Function of Position for Tl rce Data
Efficiency Functions at 2.8 Kg
Comparison Between rce Data and Monte Carlo for Pion Momentum, Electron Momentum, and rce Resultant Momentum
Comparison between rce Data and Monte Carlo for m , the Invariant Mass of the rce
rce
Decay Position Distributions of Final rce Sample
The Best Value of X from This Experiment
Likelihood Contours for Fit to Sum
Likelihood Contours for Fit to Asynnnetry
Sketch of re Beamline
Block Diagram of Berun Electronics
Number of Vees on Film and rcrc Trigger Rate for Different Target Materials
PAGE
66
68
75
76
77
81
82
83
84
88 89 97
FIGURE
33. 34. 35. 36. 37.
38. 39. 40. 41.
42.
43.
44.
45.
46. 47.
48. 49. 50.
x
LIS'l' OF FIGURES (Continued.)
CAPTION
Block Diagram of Target Electronics
Sketch of Gas Cerenkov Counter
Block Diagram of Gas Cerenkov Electronics
Block Diagram of MH Electronics
Block Diagram of RH Electronics
Block Diagram of SH Electronics
Block Diagram of Trigger Electronics
Computer Scan .Analysis of Ke
3 Trigger
Electron Pulse Height in Shower Counters for Four Segments of Decay Region
Pion Pulse Height in Shower Counters for Four Segments of Decay Region
Horizontal Separation Between Pion and Electron at Shower Counters
Shower Counter Pulse Heights of e and ~ for
Different Charges
Electron Acceptance of Computer Scan as a Function of Electron Energy
Shower Scanning Criteria
Production-Decay Region Scanning Criteria
Special Cases in Production-Decay Region Scan
Production-Decay Region Measurements
Comparison Between Calibration Data and Monte
Carlo for Y-profile of ~
P/\.GE
ll8 125 128 130 132 134 136 144 145
146
148
149
150
FIGURE
51.
52.
53.
54.
LIST OF FIGURES (Continued)
CAPTION
Comparison Between Calibration Data and Monte Carlo for Z-profile of re
Comparison Between rce Data and Monte Carlo for Z-profile of e
Comparison Between rce Data and Monte Carlo for Z-profile of re
Difference in N+(N-) with Various Corrections for Higher Moments of pK- Spectrum
P/\.GE
166
168
169
TABLE
2.
3.
4.
5.
6.
7.
8.
x:Li
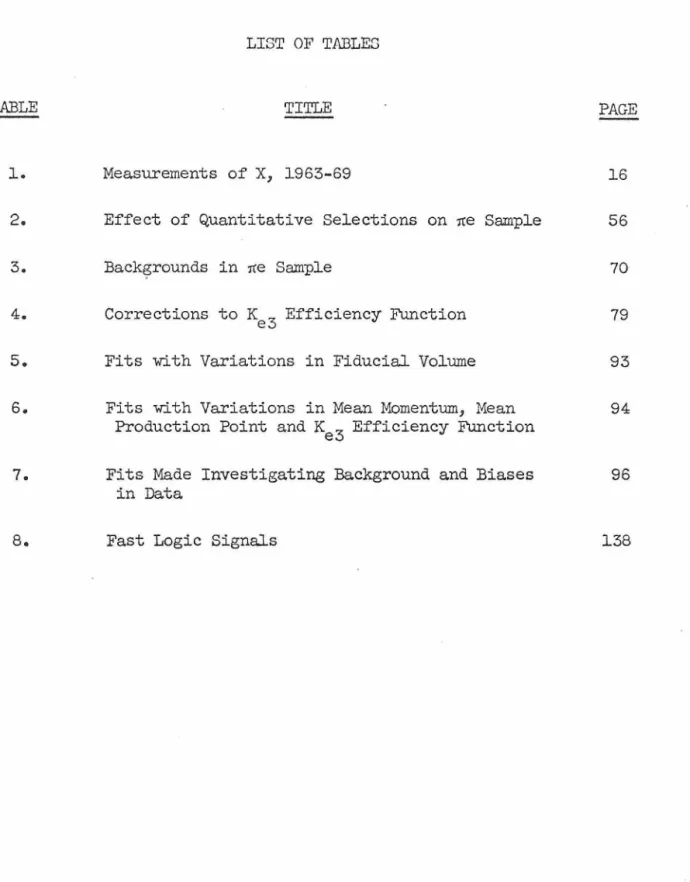
LIST OF TABLES
TITLE
Measurements of
x,
1963-69Effect of Quantitative Selections on ~e Sample
Back~rounds in ~e Sample
Corrections to Ke
3 Efficiency Function
Fits with Variations in Fiducial Volume
Fits with Variations in Mean Momentum, Mean Production Point and Ke
3 Efficiency Function
Fits Made Investigating Background and Biases in Data
Fast Logic Signals
PAGE
16
56
70
79
93
94
96
I. INTRODUCTION
In the past decade, one of the most spectacular dcvclopmcntc :tn particle physics has ·been the uGc of internal symmetrJc:: Jn irndcr-standing the interactions between elementary particles. The most prominent of these symmetries, SU(3), combines isotopic spin and strangeness, both of which are conserved in the strong interactions. The weak interactions conserve neither isotopic spin nor strangeness and so violate SU(3). However, as will be shown, the most elegant way of breaking SU(3) implies certain selection rules in weak tran-sitions. One of these is the 6S = D.Q rule, which applies to strange-ness-changing semileptonic transitions where 6S is the change in strangeness and D.Q the change in charge of the hadrons involved in the transition. The rule was first proposed in 1958 by Feynman and Gell-Mann and has been the subject of theoretical speculation and experimental investigation ever since. This thesis describes an experiment which studied the leptonic decay of the K-meson,
K ~ ~ + e + v and measured the parameter X, the ratio of the D.S
=
-D.Q- +
1:-::0
-
+I
oamplitude
<
~ e v K>
to the 6S=
+D.Q amplitude<
~ e v K>.
A. Theoretical Background of the 6S = D.Q Rule
In 1958 Feynman and Gell-Mann(l) formulated the presently accepted notion of the weak interaction as a current-current inter-action, for which the interaction Lagrangian density has the form:
L wk (x)
=
-G J,t(x) ·J, (x) where G "' l0-5m-2 and J, (x) is a current int rv.J2
I\ rv I\ rv p /\ rvi
l
I
rt
t !
I
'
'
f
I
I
fI
2
which ho.o contrlhutiorw from o.11 partlcleo huving weo.k :Lrrtcrr.J.ct:!.orni.
J)\ ha.o a vector po.rt and an o.xln.l vector purt which obey current
con-servation laws of varying degrees of validity. Up to the present,
there is no evidence for scalar, pseudoscalar or tensor contributions
to the currents although they are allowed by Lorentz invariance. If
wk
one separates J'/\ into a leptonic part and a hadronic part, then Lint
becomes:
The first term involves only leptons which do not have strong
inter-actions. Matrix elements involving this first term can be accurately
calculated by first order perturbation theory and experiments on the
purely leptonic decay µ ~ e v
v
are consistent with the current:in the usual relativistic Dirac spinor notation.
Of the terms involving hadrons, the first
~hadr ~ept
+t lept _hadr . . __ hadr
J'/\ ~i
,
offers most hope of understanding, since ~~ occursonly once and its matrix elements are easier to handle than those of
Jt hadr Jhadr Th b t k t . _hadr . th A d t .
'/\ '/\ • e es nown erm in ~i is e ~- ecay erm
in-volving nucleons, ¥pr'/\(l + cr
5
)~n where C ~ 1.2. In isotopic spinformalism this can be wri ttcn 'FN I_/'f\ (1 + Cy
5 )~N where ~N is o. general
nucleon spinor, and I is the isospin raising operator. Meson decays
+
are accounted for by introducing terms containing meson fields into
the hadronic current. The conserved vector current hypothesis
pro-!
I
1!
I
I
I
I
i
vides an elegant prescription for adding the vector part of the rneGon current. For pions it is
pion ( )
JA vector part
=
:i.[I!>*
I o,!Ji - (o,<I> )*
I II> ]1( + " 1C " 1( ·I· n
where I!> is the pseudoscalar pion field and I is the isospin raising
~ +
operator. With this addition the vector current of nucleons and pions is conserved. n -+ + :rr 0 + e + + v is an example of semileptonic pion decay and its experimental rate agrees well with that predicted by the above pion vector current.
The decays considered so far do not involve strangeness change (6S
=
0). To account for strangeness-changing (6Sf
0) decays of hyperons and K-mesons, terms involving these particles are introduced similar to the nucleon and pion terms. Still considering semileptonic processes only, the current ~pyA(a + by5
)~A will give rise toA ~-decay, A -+p + e-+
v,
and a combination of pion and K-meson fields+ 0 + similar to the pion current will give processes such as K -+ n + e + v. Other possible terms in the 6S
f
0 current are (abbreviating thebilinear form):
All the currents have been written with 6S
=
+l, but the first set has D.Q=
+l while the second and third sets have D.Q=
-1 and D.Q=
0processes
A -+ 'P + j, + v
-L: -+ n + j, + v
+ +
K
-
-+ :rr 0 + j, + v (v)0 - p,+
K -+ :rr + + v
while the second set provides for the f:::S = -6.Q processes
The third set cannot play a role in semileptonic processes since there are no known neutral leptonic currents. Feynman and Gell-Mann noted that f:::S = -6.Q tenns like (n, L:+) were not needed to account for the observed hyperon decays and would lead to unobserved processes,
+ +
L: -+ n + .R, + v • They also noted that ·f:::S = -6.Q in conjunction with
f:::S
=
+ 6.Q tenns would lead to decays such as:s-
-+ :rr -n with f:::S = +2. With the advent of SU(3) symmetry for the strong interactions, the f:::S = 6.Q rule appears in a very natural way. The pion and nucleoncurrents involve isospin through the I operator which transforms like +
~
an object with III = 1, I3 =+land hence has the same SU(3)
trans-: +
formation properties as the :rr If the rules
!t::SI
= l and f:::S = 6.Qare true for strangeness-changing decays, then the simplest SU(3) properties for the strangeness-changing current are those of the
t
8
(a)
l6Sl=1 Currents
6S •0 Curronts
•
(b)
Ko
rr+-rr0
a+11
----.;;; _
_,__G----..
rr+.,,.
-(c)
Ko
10
-Fig. 1;:;*O
•
*+
.r..
-\)8
6S
=
-6Q currents10
-
.
n
•
•
•
•
•
SU(3) properties of currents : (a) j6Qj=l currents in
the octet; (b) transitions caused by currents in (a);
6
operator F
1 + iF 2
CI)
is identified with the re+ and the 6S=
1, 6S=
6Q SU(3) operator F4 + iF5 is identified with the K+. The current is represented by an arrow from the origin of' a multiplet to the position of the particle having the some GU(:5) tro.ncformation properties.
The octet current hypothesis, proposed by Cabibbo, (2) consists of the proposal that all hadronic currents in the weak interaction are members of an SU(3) octet of currents. The currents shoYm in Fig. l(a) are all charged; the remaining currents, vlhich correspond to
0 0 ::-:0
the re , ~' K , K , are all neutral and hence do not take part in semi-leptonic decays. In this scheme, the semileptonic decays can be seen as transitions in the particle octets induced by the currents of Fig. l(a), as shown in Fig. l(b). Decays such as K0 .... re+ + e + v
or~+ .... n + e+ + v require transitions caused by currents which are not members of an octet, and so violate the 6S
=
6Q rule. In fact, the lowest SU(3) multiplets admitting such a member are 1,5) orlO
as shown in Fig. l(c), vlhere the currents correspond to 6- andt;+- •
B. K-e3 _ _ _ 0 Decay ,_
Measuring the magnitude of the 6S
=
-6Q amplitudes in hyperon+ + - 0 - +
decays,~ -.n + £ +
v,
~_.
~ + £ +v,
involves direct measurement of the branching ratios for these processes. The situation is dif-ferent for neutral K-mesons due to theKT, -
K8 phenomenon, vlhereby K- decay occurs from states which are almost eigenstates of CP and so arc not eigenstates of strangeness. This means that
K°-.
re- + e+ + v0 - +
one can meaGure the phase of any 68
=
-1:::.Q amplitude present relativeto the 68
=
-t6Q ampl:Ltude. f\s ohown in Appendix 1, there are fourdiotinct am1)li tlJCl.cs J'or K .,. Jcco.y e.)
f,
f,
g,
0 - +
the amplitude for K ~ n e v
::0 + -
-the amplitude for K ~ n e v
0 +
--the amplitude for K ~ n e v
""'° - +
g, the amplitude for K ~ n e v
68
=
-1:::.Qand one defines X = g/f and
X
=g(i.
All of these functions involve2
a form factor which depends on q , the square of the 4-momentum
transfer between the K and the n. It is known (S) that this dependence
is small and it will be neglected from now on.
The discrete symmetries C,P and T imply relations between these
amplitudes as shown in Appendix 1. CPT-invariance implies
(*
is complex-
*
*
*
conjugate) f
=
-f and g=
-g so that X=
X • T-invariance in thetransition implies that f, f, g and g are relatively real so that
ImX
=
ImX=
O. With CPT-invariance, ImXf
0 therefore implies directCP-violation in leptonic K-decay. Sachs(3) has suggested that such an
effect could be the source of the CP-violation seen in ~ ~ 2n decay.
This matter is discussed more fully in Appendix 1.
In Appendix l the leptonic time distributions are derived for
0
*
a pure K beam at t
=
O. Assuming CPT-invariance, so that X=
X , one0
- 4 ImX . Sin 6mt e -}(r L + r
s)t}
where
rs
andrL
are the KS and K1 total decay rates and 6m is
( ' - I\:S). In the detailed derivation, CF-violating effects in
the ~ - K
8 states are taken into account. Such effects are of the -3
order 2 x 10 , well below the sensitivity attainable with present +
experiments and are omitted in the expression for N-(t). Fort = O,
the above expression becomes N+(o) = 4jfj2 , N-(o) = 4jf! 2!xj2 so
that N-(0)/N+(O)
=
IX! 2 , as one would expect before the K0 -K°
interference comes into effect for t
>
O.~
l
It
~
I
t
c.
History and Current Statlls of the 6S=
/\Q R11leMost checkr: of the AS
=
6Q rule hnve b1.~cn .! n >~1· and K ·;e.1 decay. K0./ dcc1iy 111 c1)n13Jdc1·ul>Jy more d:L:l'l'i,'.UJt; 111 1n1hlilc d1mnlic:rr1
11. J
there src posclble churge acyTllmetries in. µ-1)1J. - i.dcntJ l'.l.cuti<m, awl
in counter experiments one has to operate at fairly high energies to
filter µ's from hadrons. There is also serious background from
K s
+
-)re +re , with one of the re's undergoing undetected re--) µv decay.
The first experimental evidence on the 6S = 6Q rule was
reported at the 1962 CERN conference(4) and it placed the rule in
serious doubt. First, an example of L + --) n µ v decay + was reported 0
and, secondly, two Ke
3 experiments found evidence for large violation.
The L+-event was found in an emulsion stack exposed to K--mesons(5)
and the authors were well aware of the danger of drawing sweeping
conclusions from one event. They did not report any examples of the
allowed L---) n µ-~decay mode which would have been helpful in
. + +
understanding the L: --) nµ v event.
The Ke
3 experiments( 5
),(7) had 28 and 22 events respectively
and the data was analyzed in terms of
r
1
/r
2 = (Total K1 leptonic rate/1
1 +
x
12 Total K
2 leptonic rate)= 1 _ X • GP-conservation was assumed, i.e.,
lmX was fixed at zero. If 6S
=
6Q thenr
1
/r
2=
1. The results werer1/r2
=
lL 9 + 7. 5-5.6 and 6.6 + 6•0
-4.0 respectively. The first experiment
+ - - +
10
I
+ .OUX and 1 X and enve X ::: 0.55 _ .J;] The second exper:lment could not do this but, tuldng the value of X wh:lch wuu lcso thon 11nJty, they
+0.12 obtained X
=
0. 1ltt -O.20 • Crawford, in hlo rapporteuro t1:ilk to the 1962 conference summarized: "The conclusion is that the 6S
=
b.Q ruleis probably wrong." However, admixture of K
8 -+ n + n - background in the
leptonic decay sample gives
r
1/r
2 >land it is noteworthy that both of these results are in that direction.In the seven years that elapsed until the 1969 Topical Con-ference on Weak Interactions at CERN, the 6S/6Q problem was attacked
+
with great energy on both the L: and Ke3 fronts, the Ke
3 case being given considerable impetus by the discovery of CF-violation in
KI,
-+ 2n decay.At the 1969 conference, Filthuth(B) reported a L:+-+ n e+v event and two more L:+-+ n µ+v events, all three being from H
2 bubble
chambers. The electronic event(9) corresponded to a bubble count 3.6 standard deviations from that expected for a pion, with a 1% proba-bility that the track was not an electron. For the exposure yielding the muonic events, (lO) it was calculated that 0.3 background events of the type:
r:+ -+ n n + "/
followed by n+ -+ µ + v (with decay vertex undetected)
would be present in the sample. Thus the probability of the two
bnoiu of thcoe cventG :1.t should ·1,c noted thut the (L\~.; '-' -f\..Q rntc) / (N> = +L.Q rutc) L'or muons lu l!) time a that l'ur cl(!Ctronn where o.B o.
naive theory would predict the same ratio for muons and electrons.
Rubbia, (e) at the srune conference, discussed Ke
3 decay and
from eight ~ experiments done since 1962, compiled a world average
for X:
Rex
=
+0.14 + o.osImX
=
-0.13 + 0.043This world average clearly contradicted the evidence for a gross
violation displayed at the 1962 conference. The experiments
con-tributing to it are tabulated in the next section.
One other test of the 6S
=
!::::.Q rule is experimentally+ + - + + + +
--accessible; the decay K -+re re e v being allowed while K-+ re re e v
is forbidden. The 90% confidence limit for this process is
( + + +
--;re
+ + - + )r
K -+re re e v K-+ re re e v<
0.04 based on 264 Ke4 6S = +6Q events
with no 6S
=
-6Q candidates seen. (Rubbia's talk, Ref. (8).)This completes the discussion of the direct checks of the
bS
=
L:.Q rule and the conclusion in 1969 was that the 6S=
-1::::..Qam-plitudes were < 20% of the 6S
=
+ 6Q amplitudes. Two indirectimpli-cations of 6S
=
-1::::..Q currents will now be discussed.If the current-current picture has bS
=
-6Q currents as wellas bS
=
+6Q currents, then these can combine to give 6S=
2 processeswith amplitudes which are first order in the weak interaction coupling
~ - 0 :-:0
constant. Examples of such processes are ..:::.. -+ n re and K t t K • The
12
is well known that the ~ -K
8 mass difference, which is proportional
to< K0
jH!K°
>,
is second order in G (6m ~r
8/2) indicating that K
0
ttK°
transitions are forbidden in first order. The current-current picture
would thus need modification to accomodate 6B
=
-.6.Q currents, if they-were found.
The
jL:>I!
=
t
rule for semileptonic decays states that thechange in the total isospin of the hadrons in such a process is
t.
Ifone defines °il' a
31, and a33 corresponding to isospin changes
(6I,
6.13) = ( 1/2, 1/2), (3/2, 1/2) and (3/2, 3/2) then the
jL:>Ij
=t
rulestates that a
31
=
a33= o,
whereas the weaker 6B=
6Q rule states thata
33 = 0 alone. Evidence from K+ and
IS,
semileptonic rates gives (seeRubbia's talk, Ref. (8)):
=
(3.4 + 13) x 10-3 •. J3a33
Since ~ 4.2 X, a violation of 6B
=
6Q corresponding to ReX2
'C$
°11
would require a subtle conspiracy between a
31 and a33 to maintain the
above relation.
The conclusion from all available data in 1969 -was that there
-was no definitive evidence for 6B
=
-.6.Q currents in the weakinter-actions but the experimental limit on such amplitudes -was fairly large.
In view of the implications of non-zero X just mentioned and the
importance of measuring ImX accurately to help understand CP-violation,
an improvement in the measurement of X by at lea.st an order of
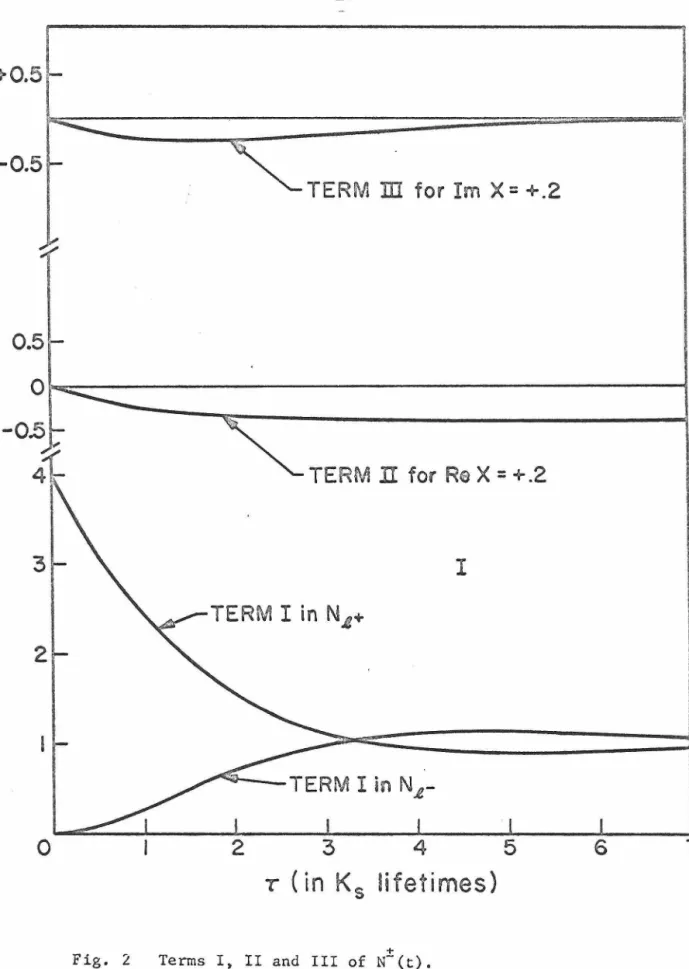
If the expression for N-(t) is rewritten with Quadratic terms omitted and
rLt
=
o,
one obtains:1
- 4 ImX sin 6rnt e
~
rs t IIIIn Fig. 2 the features of terms I, II, and III can be seen. Taking 6m ~ r
/2,
the wavelength of the periodic terms is 4n/r which iss s
roughly 12 K lifetimes. As they are damped by an exponential these s
terms are essentially constant a~er 5 K lifetimes. The best way to s
+
measure the coefficients of the terms in N-(t) is to collect a sample of leptonic decays in flight within the first 10 or so lifetimes, separate them into the two charge states, and fit the parameter X
+ using the time distributions N-(t).
-3
Since leptonic decays occur at ~10 times the rate of the +
-usual K ~ n n one would expect backgrounds from K decay to be a
s s
major problem and to be most competitive at short lifetimes. Thus the effect of such an excess of events on the measurement of X should be
+
considered. From the expression for N-(t) one finds:
(:r-.t
+ N-) o.t t = 0 ,,_, 2(N+
+N-)
ut t "' oo 1 - 2Hex
, hence an exceos of events ut
t
=
0 will give ReX>
O for both K0 andK°
initial states, e.g. a 10%+
14
-e-Q.5
-
0
.5
TERM
ill
for
Im X
=
-+
.2
0.5
TERM Il
for
Ra X
=
+
.2
3
I
TERM I
in
N..a+
2
TERM I
in
N..e
-0
2
3
4
5
r
(in
K
5lifetimes)
Fig. 2 Terms I, II and III of N-(t). +
6
7
i 1
{
I
ft t 1
'
I
r~
;
i
'
I
I
!
A compilation of all experiments done since 19G3 is given in Table 1, w-lth the same results shown on an Argand plot in Fig. 3. It is interesting to note that 7 of the 8 experiments give ReX
>
o.
Each of the experiments suffers from a smaJ.l number of events and so has serious difficulties in investigating systematic errors. Therefore, one should not place much faith in an average derived from them, but if this is done for the first eight experiments, the result isReX
=
+0.14 ~ 0.05, ImX=
-0.13 ~ 0.04. Ref. (20) measured(1 -
jxj
2)/ll -x!
2 from the amplitude of oscillation of the charge asymrnetry following a regenerator in which the phase was measured. The strongest conclusion to be drawn from these experiments is thatIX!
~ 0.2.E. This Experiment
In order to place a better limit on X it was desirable to do a high statistics experiment for which the systematic errors could be estimated well within the statisticaJ. error. In view of the importance of CF-violation in the K0
-K°
system, it was decided to aim for equal sensitivity in ImX as for ReX and so it was necessary to reach high acceptance well within the first K lifetime where the charge asymmetrys
is greatest. It can be shown that the statistical error on X, for X
=
o,
depends on the number of events approximately as follows:o~eX ~
.8/n'a~mX
~
1.1/n' where n''fABLE 1.
G roup M th d c·- o
Paris Freon/Prop.
(1965) B.C. ,K+ n ~ K°p
Padua do.
(1965)
Colwnbia/
-Rutgers H
2 BC p-p
(1965)
Penn. Sp. Chamber
(1966) ;Cp ~ Ko/\..
Brookhaven
/Carnegie
(1967)
D~C K+n~ K°p
Berkeley H - -o
2BC K p ~Kn
(1968)
CERN/
-Paris H
2 BC p-p
(1968)
San Diego Sp. Chamber
(1969) K+cu ~
K°
Average
CERN/
Colwnbia Counter Reg.
(1969) ~ Beam
16
ME.A:3UREMENTS OF X, 196:7i - 19G9
K -z
eo
E •ven t s
:515 152 109 ll6 335 242 (includes
Kµ3events
121
686
?
l6ml
inUnitG of
r
i:::.47 ~ .20
15+.35
• -.50
=
.5?
=
.5=
.47=
.47=
.46=
.4698c
x
035+· 11
• -.30
.06 +.18
-.44
-.08+.16 -.28
.17 +.16
-.35
.17
±
.1022 +.07
• -.09
+.13 .09
-.11
.09 +.14 -.16
.14
±
.05l-jxj2 _
11x12
-(= means input, not a free para.meter in fit)
ImX nc1'.
-.21+.15
-.11 12
-.44+.32
-.19 13
.24+.40
-.30 14
.oo-.::.
25 15-.20
!
.10 16-. 08-: • 08 17
.22+.29
-.37 18
-.11+.10
-.ll 19
-.13±.043
Im X
0.6
0.5
0.4
0.3
0.2
0.1
0
-0.1
-0.2
-0.3
-0.4--0.5
-0.6
---I
I
I
I
I
I
I
I
I
I
I
Constraint
of
Ref.20
-0.4 -0.3 -0.2
-0.1
0
0.1
0.2
0.3
0.4
Re X
Fig. 3 The nine experimental measurements :of X summarized in Table 1.
'
f
•
'
r
I
'
i
I
I
I
r
18
being the total number of events per K lifetime. With n'
=
500, thes
error on ReX is :1:: 0.04 and on ImX it is + 0.047. The sensitivity to
rd +
-background is such that a c..p admixture of K ~re re giveG Im.X = -0.0l,
s
ReX
=
+0.01 for X=
O. So :in an experiment wlth n' "' 500 it Jo enoughto 1-:.eep this background below
'Z1/o.
The method, which is described in detail in the next chapter,
was to produce K-mesons in an apparatus that could detect Ke
3 decays
from 0.2 to 7.0 K lifetimes. The K-mesons were produced by pions in
s
small brass targets in front of a large aperture magnet in which the
decay secondaries were momentum analyzed. Sensitivity to electrons
and rejection of heavier secondaries was achieved using a combination
of gas Cerenkov counter, visual shower chambers and shower counters.
The experiment involved taking pictures of some 240K candidates from
which a final sample of 1079 Ke
3 events was isolated with a background
level of (2
t
1)%. The value of X estimated from these events is:ReX
=
-0.069 :1:: 0.036ImX = +0.108 -0.074 +0.092 •
The error on ImX is larger than expected because X is sufficiently
far from zero that the above error analysis is only approximate.
This thesis is divided into four more chapters. Chapter II
discusses the experimental method and apparatus, Chapter III describes
the procedure used to isolate the final sample of Ke3's, Chapter IV
clculs with the Monte Carlo efficiency calculn.tion ancl the mn.x:Jmum likelihood fits to the data and Chapter V finishes the thesis with
11. EXPElUMI~'N'l1AL J\PPJ\W\'J.'Uf~
The experiment wac executed in 19G8 at the Devatrori, u r; CcV vieal~
focusing proton synchrotron at the La'Wrence Radiation La1Jorti.tory ln Berkeley. As stated in the previous chapter, the object of the experi-ment was to acquire a sample of Ke
3 decays with known efficiency in time over the first 7 K lifetimes and to extract the value of X from
s
this sample by fitting it with the time distributions N+(t) and N-(t). This was achieved with an apparatus which was sensitive to decays of neutral particles into an electron and a pion and which determined the charges of the decay products. This chapter is divided into three sections. The first describes the general features of the apparatus, the second gives a more detailed description of the triggering com-ponents, and the third describes how data were recorded for the events that satisfied the trigger.
A. General Features of the Apparatus
Since a major goal of the experiment was to get more events than the previous experiments, i t was decided to produce the K0-mesons
from dense target material rather than from hydrogen. This meant that the kinematical constraints of a proton target could not be used to identify the K
3•s as was done in the bubble chamber experiments. e
Instead, the t1vo charged prongs from , a neutral decay were identified, one as an electron by its production of Cerenkov radiation and its showering properties in lead, the other as a showering,
20
:i'l nnJ. e to tc ore /\ -> p + e + v - nnd K 0 - t T(
+ +
-+ e 1- V. 'L'hc rnornento. of
the ~ccondarle:..; were rneaeurcd Ln a large :.:pectrornuter :1u one w110 111>.l.c
to eliminate A
13 events by a cut on the (p e) invariant mass. The· technique was based on achieving three goals:
(1) The ability to isolate neutral decays. The triggering system was designed to favour neutral decays and these could be seen in spark chambers placed throughout the decay region by observing the characteristic two-prong vee of a neutral decay.
(2) Good differentiation between electrons and heavier particles so that one particle in the final state was an electron and the other a heavier particle. This distinction was made by the pulse height in a 1 atm. Freon Cerenkov counter, by the visual appearance of the particles in three radiation lengths of shower chambers and by their pulse heights in a set of shower counters.
(3) Enough mass resolution to make necessary mass cuts. The decay secondaries traversed more than 100 Kg-inches of magnetic field, with spark chambers to determine the
tra-jectory. The momenta were determined with 6p/p ~ 5%. Negative pions were used to produce K01s by associated pro-auction from braes targets. A beam momentum of 2.85 GeV/c was chosen. It was determined that this momentum was roughly optimum for the ex-perimental configuration by consideration of the following four effects:
21
momentum,
( 3) Apparatus acceptance, which increases with
K°
-momentum, (4) Electron identification by showering, which is better, thehigher the electron energy.
At this momentum the beam intensity could be as large as 400K/accel-erator pulse with about half of the circulating proton beam striking the target used to produce the pions.
A general sketch of the apparatus is shown in Fig. 4. The largest component is the M-5 spectrometer magnet which has 60" dia-meter poles and an aperture of 108" (horizontal) x 22" (vertical). The field value at first was 2.0 Kg, and later in the run it was
in-creased to 2.8 Kg. Most of the other components were either attached to the magnet or else placed as close as was physically possible. The pion beam, through 83 .and 84, impinged on two brass targets placed inside a set of thin plate spark chambers. Production of a neutral particle was demanded in one of the two targets by the signature C.V.
J. J.
in either target. The counter, 85, placed after the decay region, was used to trigger on decays occurring in the region. A Freon gas
Cerenkov counter, GC, which detected electrons, was placed inside the magnet. There were two hodoscopes, MH at the center of the magnet and RH at the back, which demanded two particles through the magnet aperture into the shower chambers. A set of four spark chambers, SC, inside and at the rear of the magnet was used to record the particle
tra-jectories through the magnetic field region. Finally, at the back of the RH, were the shower chambers and shower counters, in which the showering properties of the decay secondaries were studied in five
!
i
!
I
i!
l
~I
40 inches
PLAN
53
I
ELEVATION
TARGET DETAIL
1----i
I inch
Fig. 4
22
GC MH SC
GC MH
rndiation length::; of' lend. J\.ll of these cornponcnto wLLL now be
de::;cribed in the remainder of this chapter. Detailed discussion oJ'
the apparatus is contained in Appendices 2-U, and only those features
directly affecting the physics will be included here.
B. Triggering Components of the Apparatus
Approximately 1 in 107 of the pions interacting in the
targets led to a Ke
3 decay accepted by the apparatus so it is clear
that selective triggering was needed to reduce the number of events
to be recorded for subsequent analysis. This section deals with the
components that played a role in this selection process.
Before entering the production region, the beam particle
traversed four small ,counters Sl, S2, S3, S4 and a large veto counter
S4V which had a hole for the beam and removed off-axis beam particles.
A good beam particle had the signature S3.S4.S4V.
The selection of neutral particles was achieved by producing
them in two brass targets Tl and T2, 1. 2" long, and placing a veto
counter 2.0" in diameter immediately downstream of the target. A
pion was required to enter a target by the counters
c
1 or
c
2imme-diately upstream of the targets so a neutral trigger from either
target had the signature C. V., i =l, 2. A scintillator 7" x 18" x 1/8",
l l
SS, placed 13" downstream from the second target ensured that a decay
took place in the region viewed by spark chambers. The first target
produced K01s that could decay over seven decay lengths which is where
+
the time distributions, N-(t) reach a constant level, whereas the
24
K01s produced in it had three times more likelihood of being accepted
0
by the apparatus than K 's from the first target. The beam was tuned
to maximize the counting rates in C 1 and
c
2. About 99"/o of the beamimpinged on
c
1 and, after multiple scattering and interacting in thefirst target, about 36% reached
c
2•The selection of two charged particles through the magnet
aperture was effected by two hodoscopes, MH and RH. The multiples
hodoscope, MH, was a horizontal hodoscope at the center of the magnet
consisting of fifteen l" wide counters and the rear hodoscope, RH, had
thirty-two 4" wide counters arranged vertically. The MH was helpful
in reducing the contamination from small angle electron pairs which
did not open out very much in the vertical direction since the
mag-netic field was in that direction. For the Ke
3 trigger it was demanded
that the two charged particles be separated by at least one counter,
i.e., at least l" in space. The RH ensured that two particles reached
the rear of the apparatus and had a high probability of entering the
shower chambers and shower counters where their interaction in five
radiation lengths of lead could be studied. There was no separation
requirement here, and the RH trigger was satisfied by any two counters
firing.
Decays where one of the decay products was an electron were
selected by a threshold gas Cerenkov counter which had a radiator of
Freon 12(CC1~
2
) close to atmospheric pressure, with a pathlength of30" through the gas. The counter was placed 1)etween the poles of the
magnet as close to the decoy region as possible and had thin mylar
prenuurc :Ir; nl>out 3 CcV/c, the counter wuu unl.qucly :..:erniltJvc to
elcctr011n and coulu only count J>iono -which -vwrc 11ccompu11Jed by 1J.
x-conversion or a fast o-ray. 'l'he mean pul:.;e height from electrons in
the counter corresponded to about five photoelectrons in the RCA 8575
phototubes which gave an operating efficiency > 93%. From studies of
the pulse height spectrum of electrons from different sections of the
decay region, it was concluded that the efficiency varied by at most
l.'C'/o over the decay region. The Cerenkov light was reflected by
spherical mirrors into two lightpipes, one on each side of the beam.
Each lightpipe had three RCA 8575 phototubes. The discriminator
threshold to satisfy a GC trigger was set at a very low level to ensure
high efficiency. The separate sides -were also pulse height analyzed
and the pulse heights stored on tape if the Ke
3 trigger was satisfied.
This concludes the discussion of the components in the Ke 3
trigger which was defined as:
S3.S4.S4V.(C.V. from either target).85.(two MH counters fire with
l l
at least one counter separation).(two RH counters fire).(pulse
from GC, set at very low bias).
At the typical intensity of 3 x 10⁵ effective pions per pulse (i.e.,
usable by the electronics) this trigger gave 0.9 triggers per pulse.
The contribution made by the various elements can be judged from the
following rates (there are, of course, correlations between the rates).
2G
C
3 <"'A C'A
v c v
05u ••)'J·o u ' t • l l ou lllO/pu.loc
220/pulce
GC 1. 4 x 10 /pulse 4
S3.S4.S4V.S5.MH 1. 0 x 10 /pulse 4
S3.S4.S4V.S5.RH 2.6 x 10 /pulse 4
10./pulse
Ke
3 trigger
=
II
.GC 0.9/pulse
Another experiment to look for interference effects bet•reen
+ - o + - o
KS ~ ~ ~ ~ and ~ ~ ~ ~ ~ ran simultaneously with the Ke
3
data-taking and had a trigger rate of 1.0 per 3 x 10⁵ pions. The overall
deadt:i.me with these two triggers was 3c;/o. A general block diagram of
the triggering and data recording is shown in Fig. 5.
C. Data Recording Components
Having considered how the apparatus was triggered, the next
topic is to describe the remaining components that recorded data from
triggering events. These were three separate groups of spark chambers
and a set of fourteen shower modules.
Production-decay region chambers
In the region where the K01s were produced and in which they
later decayed, there were seven spark chamber modules, each 4" x 8" x 18".
The targets were placed in the gaps between the first and second, and
the fifth and sixth modules. The modules after the targets were placed
as close as possible to the veto counters
v
Be nm
countors counter a
decision
logic
Spark chamber trigger
Production-' decay Momentum Spark chambers
Counter groups
Gas Cerenkov counter
Slov
logic
control
BS-1,Buffer storage
Shover/
Mii RH Shovor
llodoacope llodoscope Module a
Read into
PDP-8 i f
trigger vas
OK
PDP-8
Magnetic tape record
SPHA' a.
Pulse height
analysers
Fig. 5 Block diagram of trigger and data recording logic
28
an active gap about 3/4" from the end of each target. The decay point
of a neutral particle could be seen within l" of its production. At
the mean K0-momentum of 2.4 GeV/c, this corresponded to 0.2 KS
life-times. The length of the fiducial volume along the beam in which
decays were visible was 34" for the first target and 10" for the second
target, corresponding to 7 and 2 K
8 lifetimes respectively at PK
=
2.4GeV/c. The transverse spatial resolution attained with these chambers
was .l" and an angular resolution "' 10 mr for an average length
track. This led to a resolution for the longitudinal coordinate of
a typical decay vertex of "'O. 3", which is to be compared with the
un-certainty of 0.4" in the K0 production point. The multi-track
effi-ciency of these chambers viascrucial to the detection of neutral decays
with uniform efficiency throughout the decay volume. Extra tracks
from a target most often tended to be present in the first 5" of
cham-ber after the target. If the chambers were inefficient, decays
occurring in this region would be difficult to see, due to the
rob-bing effect of the extra tracks. From looking at the pictures, it
appears that the chambers could support up to three tracks well, but
four or more tracks became difficult to see, with some tracks robbing
energy from the sparks in other tracks.
Momentum chambers
The next chambers encountered by the secondaries in the:i.r
passage through the magnet was a group of four chambers referred to
as momentum chambers because of the:i.r momentum determining role. ~he
first was 811 x 24" with six -~-" gaps and it was placed between the S5
Finally, ut the rear of the magnet, at 16° to the normal to the beam,
were two 36" x 60" chambers, each with six
3/8"
gaps, on.e chamber oneach side of the center line. These chambers were viewed by excellent
optics rigidly bolted to the magnet yoke and gave spatial resolutions
of the order .05".
Shower chambers
The interaction of the decay secondaries in three radiation
lengths of lead was studied in shower chambers which consisted of a
total of six modules, three on each side of the center line. A
module was 4' x 6' and had nine plates with
t"
gaps. The plates wereformed of an Al-Pb-Al sandwich, .02" Al on either side of .02" Pb,
giving 0.1 radiation lengths per plate. The chambers had six active
gaps per module so a shower could be studied in eighteen gaps if it
penetrated to the back of the array. Shower maximum is reached after
three radiation lengths by 0.7 GeV/c electrons which is a fairly typical
energy for the electrons of accepted Ke
3's. Since the ability of the
chambers to distinguish between ~·s and e's depends on the scanning
criteria used, discussion of the identifying power of the shower
chambers will be postponed until the next chapter. The optics used
in the photography of these chambers was not as good as that used in
the other two sets of chambers since it involved very large mirrors
mounted at awkward angles. The spatial resolution attained was "'0.2"
in transverse position and "'20 rnr for angles. This was quite ade
:50
including the momentum chnrnlier rneanurerncntt; i11 Llil' 1.nt<'I\ J'jtLi111;.
Shower counters
The final detection components of the apparatm; were the
fourteen shower counter modules placed immediately behind the shower
chambers. Each consisted of a scintillator-lead-scintillator sandwich,
the scintillator slab having dimensions 52" x 10" x 3/8". The lead
sheet was two radiation lengths thick, so that electrons traversed a
total of five radiation lengths of lead in the apparatus. This is
shower maximum for 3.1 GeV/c electrons whereas electrons from the
accepted Ke
3's had an energy spectrum which fell to zero at 2.0 GeV/c.
The 28 scintillators were paired in front-rear pairs, with phototubes
at opposite ends, and the summed signal from each pair was pulse
height analyzed and stored on tape if the Ke
3 trigger was satisfied.
It will be seen in the next chapter that this shower pulse height
information was used before scanning to reduce the number of pictures
looked at by a factor of 4.
As will be shown, this reduction took place by use of a
complicated computer program. It would have been advantageous to
apply this selection in real time to reduce the triggering rate.
However, duplication of the program by electronics is a complicated
problem in fast logic, and besides, one would not have the advantage
of trial and error if one were to apply the selection in real time.
Magnetic tape recording
'l'he :;p:.ir·l\ chru1il>(~l' ,111t11 wu:c recordl~d l>y three <'nllll~rns wlli.ll~
DiG.i.tal -- wh.i.ch counterG :l':i.rcd, and (l>) J'or ('vrtoi11 co11nLt~n;,
"What 'Wa[; tho mnpl:LtuJc o:I.' the pulcc J.n the counters Jn cw;c (11) U1e
fast logic output corresponding to the signal in q_uestion •1ent to a
buffer storage circuit (BS-1) from which it was read into a PDP-8
computer after the spark chambers had fired. For (b) the pulses were
analyzed by slow pulse height analyzers (SPHA's) and then read into
the computer in the same -way as the BS-1 data. After several events
had been accumulated the information in the computer was read out onto
magnetic tape. A program, EXPO, controlled the movement of information
through the PDP-8 and also histogrammed any desired quantity. These
histograms could be observed directly on an oscilloscope while running
and provided a very direct check on the performance of the apparatus.
This completes the description of the apparatus. A total
of 900K pictures -were taken in January-April 1968 of which 240K were
with the K
3 trigger. The magnetic field -was reversed twenty-five
. e
times during this data-taking period, with equal amounts of data taken
at each polarity. A discussion of running procedures and checks on
the stability of the apparatus is given in Appendix 9. The next
chapter will discuss how these pictures and magnetic tape records -were
32
III. DATA ANALYSIS AND BACKGROUNIX.~
Of the 210K pictures taken, it wac expected that .-vJ.5K
were good K e.:.i 7 ' c. This Chaptr~r describes the filtcrine; -proccr;c whic..:h
extracted these K ·z' s from the raw data and then discusses the back-eo
ground remaining in the sample. Such a process must be able to
reduce the background level to
"'1%
and at the same time introduce no biases, with respect to decay length, on the accepted Ke3•s.
As usual, one started with the simplest and crudest
selec-tions available and then, with a smaller sample to work on, applied
more complex and precise tests to the events. In this case, the
first step involved ~ualitative selections designed to isolate
neutral decays from other triggers (using the production-decay
region pictures) and ~-e from other final states (using
the shower chambers and shower counters). To ensure that the ~-e
seen in the rear of the apparatus came from the decay seen in the
front end, the surviving candidates were next measured and their
trajectories reconstructed through the magnet. Quantitative
selec-tions could then be made on these measurements, e.g., only events
that reconstructed reasonably were retained, mass cuts were made on
different invariant mass combinations, etc ••
This chapter is divided into four sections: (A) Scanning,
(B) Measuring and event reconstrliction, (c) Final selections and
0
priori of good K ~ nev events are:
(a) A vee visible in production-decay region.
(b) A showering track and a non-showering straight-through track in the shower chambers.
(c) In the shower counters, a large pulse height for the electron and a minimum ionizing pulse for the pion.
The 240K triggers were examined for these features in the order (c), (b) and (a). This order -was chosen since it ~rent in order of in-creasing difficulty and sensitivity to biases, e.g., a scanning inefficiency in the decay region is much more direct in its effect
on X than a pulse height dependent inefficiency in examining the
pulse heights in the shower counters. Each of these steps will now be described and further details are contained in Appendix 10 on
scanning procedures. Tape Scan
The magnetic tape record for each Ke
3 trigger was analyzed
by a computer program which examined the pulse heights in the four-teen shower modules and looked for a combination consistent with an electron and a pion. The pulse height distributions of electrons and non-showering tracks, identified in the shower chambers, are
shown in Fig. 6. Fig. 7 shows the electron pulse height response
for three regions of electron energy. It is clearly reasonable , the average response increasing with P although the distribution
34
eo
60
895 TOTAL
U)
r-
40
z
:J
0
u
LL0
20
0::
b89
w
co
2!
~
0
z
0
10
20
30
40
PION PULSE HEIGH
T
11
ELECTRON
11~
895 TOTAL
20
~
+317
0
10
20
30
40
ELECTRON PULSE HEIGHT
Fig. 6 Shower counter pulse height distributions of electrons and pions
i t
t
l
!
'!
f~
! I
!
I
'I
i
i
I
iI
I
I
I
II
!
II
I
I
I
I
I
I
ICJ')
I-z
w
20
>
w
LI....
0
a::
w
CD
::!
~
z
20
0
i I
1.0
<
Pe200 EVENTS
- . I , >
+23
.5 < Pe< 1.0 GeV/c
340 EVENTS
O
<
Pe< .5 GeV/c369 EVENTS
9
20 40 60 80
ELECTRON PULSE HEIGHT
Fig. 7 Electron pulse height in shower
counters for three electron energy regions.
I
'
l
I i
I
broadens with energy. Thie lotter effect :Ls due to the fact that
the shower counters sampled the shovrer at three and at five radiation
lengths only and for higher energies, the effect of correlations
increases.
In the computer scan, an "electron" was defined as a pulse
height> 1.7 I . in a pair of adjacent modules. A "pion" was min
defined as a pulse height between 0.5 I . and 2.6 I . in a single
min min
module with< 0.6 I . in the modules on either side. For a given min
RH counter triggered, three pairs of sho-wer modules behind it were
searched for an "electron". If either RH counter in a trigger had
an "electron" behind it, then three single modules behind each RH
counter -were searched for a "pion". The trigger was accepted if an
acceptable "electron" - "pion" combination was found. If the RH
counters for the trigger -were within 4 RH counters of each other
then the search for a "pion" was not made and the trigger passed the
computer scan with just an "electron". Details of the tape scan and
analysis of a sample event are given in Appendix 10. Events passing
the tape scan had their serial numbers and other relevant information
printed out in the form of a scanning list to be used in the next
stage of scanning.
From a sample of 524 Ke 3
1s obtained without any pulse
height selections, the tape scan accepted 396 events, giving an
overall efficiency of 75%. This should be regarded as a lower limit
because many of the 128 events mj.ssed are dubious, the K ..,. sample
e.::.
acceptance of the tape scan is a function of decay length or electron charge, thus biasing the Ke
3 time distributions. These matters are investigated in Appendix 10 and no evidence for any bias is found.
The tape scan accepted 67,205 out of the original 240,000 triggers.
Shower Scan
The 67,205 remaining candidates were scanned in the shower chambers for an electron and a non-showering particle. The trig-gering tracks were distinguished from other tracks by using the RH information which was on the scanning list and also visible on the film. The scanner simply found those tracks that were headed for the triggered RH counters using a scanning template, which had the rear hodoscope marked on it. The tracks were classified as 11
1(11 or
"e" according to the criteria:
11
1(11 (a) Straight through track.
(b) Track scattering at a definite point, with straight segments.
(c) Track with an interaction where a number of straight tracks emanate from a definite vertex.
"e" Any track which satisfies none of the 11
1(11 criteria
and is not an obvious stop.
The criteria were 1{cpt simple and liberal the "e"