Citation:
Blundell, JE and Finlayson, G and Gibbons, C and Caudwell, P and Hopkins, M (2015) The biology of appetite control: Do resting metabolic rate and fat-free mass drive en-ergy intake? Physiology & Behavior, 152 (Pt B). pp. 473-478. ISSN 1873-507X DOI: https://doi.org/10.1016/j.physbeh.2015.05.031
Link to Leeds Beckett Repository record: http://eprints.leedsbeckett.ac.uk/3163/
Document Version: Article
The aim of the Leeds Beckett Repository is to provide open access to our research, as required by funder policies and permitted by publishers and copyright law.
The Leeds Beckett repository holds a wide range of publications, each of which has been checked for copyright and the relevant embargo period has been applied by the Research Services team.
We operate on a standard take-down policy. If you are the author or publisher of an output and you would like it removed from the repository, please contact us and we will investigate on a case-by-case basis.
The Biology of Appetite Control: do Resting Metabolic Rate and Fat-Free Mass drive Energy 1
Intake? 2
Blundell JEa, Finlayson Ga, Gibbons Ca, Caudwell Pb and Hopkins Mc 3
aFaculty of Medicine and Health, University of Leeds, Leeds, LS2 9JT, UK. bMedical and Healthcare 4
Affairs, AstraZeneca, Horizon Place, 600 Capability Green, Luton, LU1 3LU UK.cAcademy of Sport and 5
Physical Activity, Faculty of Health and Wellbeing, Sheffield Hallam University, Sheffield, S10 2BP, 6
UK. 7
Key Words: 8
Energy Intake, Resting metabolic rate, Fat-free mass, Fat mass, Energy balance 9
Running Title: 10
The Biology of Appetite Control 11
Acknowledgements: 12
The research reported was funded by Biotechnology and Biological Research Council (BBSRC) grants 13
BBS/B/05079 and BB/G005524/1, and by the European Union Seventh Framework Programme (FP7 14
2007 2013) under grant agreement number 266408. The authors would like to thank Dr James 15
Stubbs, Dr Stephen Whybrow and Dr Graham Horgan for scholarly support. 16
Conflict Statement: 17
The authors declare no conflict of interests. 18
Corresponding Author: 19
Professor John Blundell 20
Institute of Psychological Sciences 21
Faculty of Medicine and Health 22
University of Leeds, Leeds, LS2 9JT, UK 23
24
Tel: 44 (0) 113 343 5742 25
Fax: 44 (0) 113 343 6674 26
PA: 44 (0) 113 343 5718 27
28
Email: j.e.blundell@leeds.ac.uk
30
31
Abstract 32
The prevailing model of homeostatic appetite control envisages two major inputs; signals from 33
adipose tissue and from peptide hormones in the gastrointestinal tract. This model is based on the 34
presumed major influence of adipose tissue on food intake. However, recent studies have indicated 35
that in obese people fat-free mass (FFM) is strongly positively associated with daily energy intake 36
and with meal size. This effect has been replicated in several independent groups varying in cultural 37
and ethnic backgrounds, and appears to be a robust phenomenon. In contrast fat mass (FM) is 38
weakly, or mildly negatively associated with food intake in obese people. In addition resting 39
metabolic rate (RMR), a major component of total daily energy expenditure, is also associated with 40
food intake. This effect has been replicated in different groups and is robust. This action is consistent 41
with the proposal energy requirements reflected in RMR (and other aspects of energy 42
expenditure) constitute a biological drive to eat. Consistent with its storage function, FM has a 43
strong inhibitory effect on food intake in lean subjects, but this effect appears to weaken 44
dramatically as adipose tissue increases. This formulation can account for several features of the 45
development and maintenance of obesity and provides an alternative, and transparent, approach to 46
the biology of appetite control. 47
Background: Current Views on the Biology of Appetite Control 48
Over the course of 50 years scientific thinking about the mechanisms of appetite control has 49
changed dramatically. In the 1950s and 1960s the hypot 50
believed to provide a comprehensive account of the intiation and inhibition of food intake e.g. 51
Anand & Brobeck (1951) [1]. Following technological advances in the identification of 52
neurotransmitter pathways in the brain, the 2-centre hypothesis was replaced by a model which was 53
based on catecholaminergic and serotonergic aminergic systems [2]. At the time this approach was 54
understood to provide a modern and powerful explanation of appetite. Later, with the discovery of 55
families of neuropeptides, the peptide hypothesis of central control of appetite replaced the 56
Current neural models propose complex networks of transmitter 57
pathways and receptors that receive both stimulatory and inhibitory inputs from the periphery [3]. 58
Important peripheral agents have been incorporated into a recent conceptualisation that has 59
proposed a theory of appetite control based on an interaction between adipose tissue (and 60
cholecystokinin (CCK), Insulin, glucagon-like peptide-1 (GLP-1), peptide tyrosine-tyrosine (PYY), 62
amylin and oxyntomodulin [4]. This 2 component approach apparently summarises current thinking. 63
However, the history of the physiology of appetite control illustrates that any model can be 64
improved by new findings and that some models have to be completely replaced following the 65
advent of new knowledge. Commenting on the regulation of body fat in an editorial in American 66
Journal of Phy W
67
68
it has not)[5]. Therefore the current conceptualisations should not be regarded as permanent 69
fixtures; they are transient representations of the current state of knowledge. 70
An important component of the homeostatic approach to appetite and body weight has focussed on 71
the identification of key signals that could inform the brain about the nature of body stores. During 72
the 1950s three basic postulates promoted different signals for 73
the glucostatic [6], aminostatic [7] and lipostatic hypotheses [8]. These simple ideas exerted a mild 74
but pervasive influence on thinking about a complex problem. The discovery of leptin in 1994 by 75
Zhang et al. [9] seemed to provide conclusive proof of the authenticity of the lipostatic hypothesis 76
(which was based on a particular interpretation of the classic rat studies of Kennedy [8]), and leptin 77
78
feedback process for the regulation of adipose tissue. This idea has been incorported into models of 79
appetite control in which leptin is depicted as the major signal (the missing link) that informs the 80
[4, 10]. Interpretations of this view have positioned 81
adipose tissue at the centre of appetite control [11]. In addition, it has been asserted that adipose 82
tissues are critical integrators of energy balance through the regulation of food intake and energy 83
expenditure [12]. These arguments have contributed to the view that adipose tissue is the main 84
driver of food intake, with day to day food intake controlled in the interests of regulating body 85
weight (and especially adipose tissue); this view appears to have been widely accepted. In addition, 86
leptin is understood to play a key role in the control of appetite by adipose tisssue. Although it is 87
beyond doubt that leptin exerts a critical influence in many biochemical pathways concerning 88
physiological regulation [3, 13] it has been argued that the role of leptin in the etiology of obesity is 89
confined to very rare situations in which there is an absence of a leptin signal [14]. Others have also 90
argued that the role of leptin signalling is not concerned with satiety but is mainly involved in the 91
maintenance of adequate energy stores for survival during periods of energy deficit [15]. This is why 92
leptin may be critical in the resistance to weight loss with dieting. However, it has been noted that 93
the results following exogenous leptin administration ave been disappointing 94
the parameters of hunger and meal size which are key elements in day to day control of appetite in 96
humans. 97
T T
98
idea has been proposed to account for the accuracy in which energy balance is maintained over time 99
in normal individuals. For example, some commentaries suggest that for a healthy adult weighing 75 100
kg who typically consumes approximately one million kcal each year, then a mismatch of just 1% 101
(expending 27 kcal per day fewer than consumed) will yield a body fat increase of 1.1 kg after 1 year 102
[16]. This type of calculation which uses the 1 kg of fat for 7700 kcal rule has recently been shown by 103
Hall [17] and others [18] to be simplistic and to produce implausible predictions. Moreover, given 104
the worldwide epidemic of obesity, and the apparent ease with which many human beings appear to 105
gain weight, it seems implausible that some privileged physiological mechanism is regulating body 106
weight with exquisite precision. If such a mechanism existed it would surely operate to correct 107
weight gain once it began to occur. A S I
108
[19].
109
The compelling phenomenon of dietary-induced obesity (DIO) in rats also suggests that physiology 110
-111
cannot prevent this. The phenomenon of DIO in rats questions the notion of an all powerful 112
M 113
114
advanced country on the planet [20]. The analogy with DIO in rats is quite compelling, and is usually 115
not denied. 116
The argument for body weight stability is not convincing. The existence of world wide obesity 117
suggests that body weight is not tightly regulated. Moreover, overfeeding does not lead to any 118
significant downregulation of energy intake [21, 22]. An alternative view that has been discussed for 119
decades is that regulation is asymmetrical [23]. Whilst the reduction in body weight is strongly 120
defended, physiological compensatory mechanisms do not resist an increase in fat mass [24]. Indeed 121
the physiological system appears to permit fat deposition when nutritional conditions are favourable 122
(such as exposure to a high energy dense diet). This means that the role of culture in determining 123
food selection is critical. In many societies the prevailing ideology of consumerism encourages 124
overconsumption. This applies not only to foods but to all varieties of material goods. The body is 125
not well protected from the behavioural habit of overconsuming food; processes of satiety can be 126
over-ridden to allow the development of a positive energy balance. This has been referred to as 127
environment (26). Consequently there are a number of aspects of the etiology and management of 129
obesity, and the obesity epidemic, that are difficult for the adipocentric theory to explain. 130
An Alternative Approach: Human Energy Balance and Appetite Control 131
Not since the work done by Edholm [27, 28] and Mayer [29] in the 1950s has thinking about appetite 132
control taken account of evidence in the field of human energy balance research. Therefore it is 133
worth considering whether or not any light can be shed on the expression of human appetite from 134
an energy balance approach. A recent approach to the study of exercise on appetite control within 135
an energy balance framework has used a multi-level experimental platform in obese humans [30]; 136
relationships among body composition, resting metabolism, substrate oxidation, gastrointestinal 137
peptides, sensations of appetite and objectives measures of daily energy intake and meal sizes, have 138
been examined. Such a multi-level approach has not previously been explicitly undertaken. An 139
important feature of the approach is that all variables have been objectively measured and 140
quantified. This is particularly important in the case of daily energy intake for which self-report or 141
self-recall do not provide data of sufficient accuracy to be used in assessments of the energy balance 142
budget [31, 32]. 143
Body Composition and Energy intake 144
Using a multi-level systems approach [30] in several cohorts of obese (men and women), the 145
relationship between meal sizes, daily energy intakes and aspects of body composition (fat mass 146
[FM] and fat-free mass [FFM]) have been measured simultaneously in the same individuals at 147
different time intervals several months apart [33]. Contrary to what many would have expected, a 148
positive association was observed between FFM and daily energy intake (EI), and also with meal size 149
(see Figure 1). In other words, the greater the amount of FFM in a person, the greater was the daily 150
energy consumed and the larger the individual meal size (in self-determined, objectively measured 151
eating occasions). In order to enhance ecological validity, the study incorporated a schedule of 152
eating opportunities that was representative of real life in the local culture. The relationships 153
between FFM and EI were conserved over time (measures 12 weeks apart) and under quite 154
distinctive dietary challenges (high and low energy dense foods). There was no relationship with 155
body mass index (BMI) nor with the amount of adipose tissue (FM) suggesting that, in a free-running 156
situation (with participants not subject to coercive weight loss or dietary restriction), FM did not 157
exert control over the amount of food selected in a meal, nor consumed over a whole day [33]. This 158
outcome is clearly not consistent with an adipocentric view of appetite control. Moreover the 159
with EI. On the contrary FFM can explain the sex effect; men (in general) eat more than women 161
because they have greater amounts of FFM. 162
163
Figure 1 164
Scatter plot for a group of 46 overweight and obese individuals showing the relationship between fat 165
free mass and self determined total energy intake measured objectively and quantitatively under 166
laboratory conditions for one ad-libitum dinner meal (upper panel) and over the whole day (lower 167
panel). Measurements were made at the beginning, after 6 weeks and at the end (post intervention) 168
of a 12 week programme to improve physical activity. Participants were given 3 ad-libitum meals 169
and one fixed size meal (lunch) at each measurement point, and the daily intakes were averages of 170
days in which participants were offered high energy dense or low energy dense foods. The 171
relationship between FFM and EI is present at individual meals and for the total day energy intake. 172
This positive relationship is quite consistent with the data reported in papers by Lissner et al (1989) 173
and Weise et al (2013). 174
175
Confirmation of the Relationship between Body Composition and Energy Intake: The Importance 176
of Replication in Science 177
One of the most valuable but unpopular aspects of scientific investigations is the importance of 178
findings reported on a single occasion only, with the implication that one demonstration of an effect 180
establishes that effect for ever [34]. Authors are not keen to perform the same study more than 181
once, and grant awarding bodies are not enthusiastic about funding repetitions. However, for any 182
new finding that may run counter to the currently accepted dogma, it is essential that it is replicated 183
in order to demonstrate its robustness. 184
Interestingly, our attention has recently been drawn to a study published in 1989 that produced 185
results in all aspects similar to those we reported in 2010 and published in 2011. The study by 186
Lissner et al. [35] was designed to investigate whether overweight women might overeat whilst 187
reporting under eating. Participants were observed for periods of 14 to 63 days and all 188
measurements were carried out in a metabolic unit that incorporated measures of body composition 189
using densitometry. Body composition, weight change and energy intake were precisely and 190
objectively measured by the investigators. The outcome showed that the energy requirement for 191
the maintenance of body weight was not correlated with adiposity expressed as a percentage of 192
body fat. In a regression analysis energy requirement was positively associated with lean mass (p< 193
0.0001), whereas fat mass T
194
mass was shown to be a significant predictor of energy requirement and fat mass was not (p 324). A 195
further r T
196
between energy intake and obesity is misplaced because energy requirement appears to be a direct 197
function of lean mass rather than adiposity (p 324). 198
This article and its outcome appears to have been completely overlooked for over 20 years, possibly 199
because the findings were discordant with the prevailing interest in the lipostatic hypothesis and the 200
role of fat in appetite control. The similarity between figure 2 in the study by Lissner et al [35]- 201
showing a relationship between EI and lean body mass - and figure 1 in our more recent paper [33] 202
is compelling. In addition the relationship of FFM and EI has been more recently demonstrated in a 203
large group of obese ethnically diverse individuals from a quite different geographical and cultural 204
environment [36]. This sample (n = 184) included Asian, African Americans, Caucasians, Hispanics 205
and Native Americans. The main outcome demonstrated that FFM (and the fat-free mass index 206
(FFMI) FFM divided by height squared) was correlated positively with objectively measured EI. 207
Moreover in this sample there was a weaker but negative association of FM with daily EI. The 208
authors concluded that food intake could be predicted by FFM (and FFMI) and to a lesser extent by 209
FM. As proposed earlier [33, 37] these authors concluded that FFM and FM have opposing effects on 210
energy homeostasis. 211
Fat-free Mass and Energy Intake What is the Mechanism? 213
In order to establish biological explanations for behavior it is first necessary to demonstrate clear 214
and unambiguous relationships between the biological and behavioural variables. This establishes a 215
valid relationship and provides at least prima facie evidence that biology is causing the behavior. In 216
turn this poses a question about the mechanism (or mechanisms) that embodies the causal link. Our 217
research has demonstrated that some signal associated with FFM exerts a determining effect over 218
the amount of food consumed. One possibility is that some privileged biochemical molecule 219
associated with skeletal muscle (or some other organ that comprises FFM) could act as a signal to 220
the central nervous system networks controlling EI. This is a possibility but there are many candidate 221
molecules since skeletal muscle tissue produces large numbers of myokines and related entities that 222
could embody signaling properties [38]. 223
However, an alternative hypothesis arises from the known influence of FFM on energy expenditure 224
and energy balance. In our studies, and those of others, FFM is highly correlated with the energy 225
expended in resting metabolism i.e. resting metabolic rate (RMR) (FFM-RMR: r values = 0.51 0.85, 226
p<0.0001). Consequently one possibility is that the association between FFM and EI is generated by 227
the energy demand from FFM and reflected in RMR. In other words the energy required to maintain 228
l vital organs) determines a minimum level of EI at meals and 229
over the whole day. 230
Fat-free Mass, Resting Metabolic Rate and Appetite Control 231
This association between FFM and eating behaviour has implications for an energy balance approach 232
to appetite control, and for the relationship between energy expenditure and EI as described by 233
Edholm [27, 28]. It is well established that FFM is the primary determinant of RMR, and that RMR is 234
the largest component of total daily energy expenditure [39]. From a homeostatic standpoint, an 235
ongoing and recurring drive to eat arising from the physiological demand for energy (e.g. RMR) 236
appears logical, as this energy demand would remain relatively stable between days and would 237
ensure the maintenance and execution of key biological and behavioural processes. Consequently it 238
might be predicted that RMR, the major component of daily energy expenditure (60 70%) could be 239
associated with the quantitative aspect of eating behaviour and with daily EI. When this was 240
examined [40], it was demonstrated that RMR was a significant determinant of the size of a self 241
determined meal, and of daily energy consumed (when measured objectively and quantified). This 242
effect has been demonstrated in several cohorts of obese and lean individuals and is a robust finding 243
hand held electronic data capture instruments [41]. Consequently, these findings that are broadly 245
consistent with the early predictions of Edholm have demonstrated an association between the 246
major components of daily energy expenditure and daily EI. In other words, they demonstrate that 247
appetite control could be a function of energy balance. 248
249
Figure 2 250
This figure shows a scatter plot of the relationship between daily energy intake and resting 251
metabolic rate (RMR) for a group of 30 normal weight and 29 overweight men and women. The daily 252
self determined food intake was measured objectively for a period of 11 days in a nutrition research 253
unit. Subjects were free to make choices between food items but all items consumed were 254
quantitatively recorded. These data formed part of a study on actual and reported food intakes 255
under energy balance conditions (Stubbs et al, 2014). 256
257
258
Importantly the relationship between RMR and daily EI has been replicated in a completely 259
independent large data set from participants of variable BMIs allowed to freely select their own diet 260
under meticulously controlled semi-free living conditions [42]. This study was actually conducted to 261
assess the degree of dietary under-reporting that would occur under strictly controlled scientific 262
conditions. Significantly, in this investigation, which included measurements of all aspects of body 263
composition and the energy balance budget, RMR emerged as the strongest determinant of daily EI. 264
These reports indicate that the association between RMR and EI is robust and is not restricted to a 265
strongly associated with EI, the question arises whether or not the effect of FFM on EI is explained 267
by its impact on RMR. We have investigated this issue using mathematical modeling and the 268
outcomes suggest that the influence of FFM on EI can be accounted for by the mediation of RMR. 269
Effects in Lean Individuals 270
The studies described above have been carried out mainly on overweight and obese individuals 271
(men and women). The number of lean (and young) individuals was small. However, associations 272
among FFM, FM and EI in obese people may not be typical for people of normal or low body mass. 273
We have therefore measured the relationship between body composition and EI in a group of young 274
lean male and female subjects with an average BMI of 22 kg/m2 and an average age of 20 years. The
275
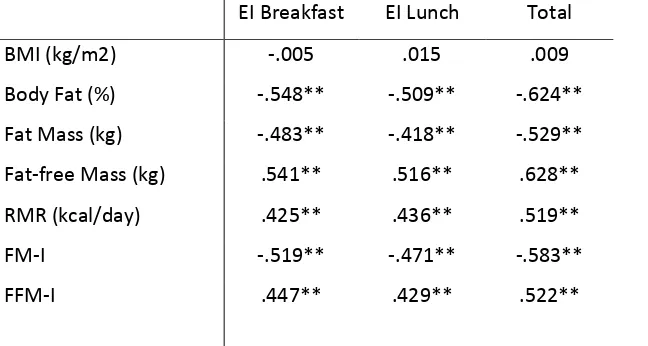
outcome was clear but different from the effects seen in obese participants. As shown in Table 1, 276
and in keeping with previous data, FFM and FFMI were strongly positively correlated with meal size 277
and total energy intake (sum of 2 meals). However, in contrast to the finding in obese people, FM 278
and FMI were significantly negatively associated with EI. These associations remained highly 279
significant even after conducting partial correlations controlling for sex (FFMI and EI, r = 0.35; FMI 280
and EI, r = -0.37). This observation that FM is negatively associated with EI implies that in lean 281
individuals with low levels of body fat (average fat mass and % body fat- 10 kg and 14.9%, 282
respectively), the adipose tissue is exerting an inhibitory effect on food intake. 283
284
EI Breakfast EI Lunch Total
BMI (kg/m2) -.005 .015 .009
Body Fat (%) -.548** -.509** -.624**
Fat Mass (kg) -.483** -.418** -.529**
Fat-free Mass (kg) .541** .516** .628**
RMR (kcal/day) .425** .436** .519**
FM-I -.519** -.471** -.583**
[image:11.595.70.394.475.648.2]FFM-I .447** .429** .522**
Table 1 This table shows the degree of association between the variables of body composition (left 285
hand column) and energy intake (EI) at Breakfast (BFEI), lunch (EI lunch) and the total intake for the 286
two meals. The figures in the body of the table are correlation coefficients (r) for 47 participants (24 287
people who took part in sports. Lean body mass was 60.9 kg and fat mass 10.2 kg. FFM-I = Fat-free 289
Mass Index; FM-I = Fat Mass Index. 290
** = p< .001. see text for details. 291
292
293
It can be deduced that this observation is in keeping with the role of fat as a store of energy, and 294
adipose tissue as a generator of negative feedback indicating adequate energy reserves in the body. 295
It also suggests that the feedback signals engage with highly sensitive receptor mechanisms. We 296
envisage that both insulin and leptin would operate as feedback signals (but the strength of their 297
effect is mediated by adiposity levels). Since leptin and insulin resistance increase as adiposity 298
increases this implies that the inhibitory action of FM on EI would weaken with increasing FM. In 299
obesity the dampening effect of the large amount of energy stored in adipose tissue would be mild. 300
A New Formulation for the Biology of Appetite Control 301
It is often inferred that food intake is a function of energy requirements, but this assumption lacks 302
empirical support, and until recently, it has not been convincingly demonstrated that energy 303
expenditure influences within-day appetite control. Indeed, current theoretical models used to 304
explain appetite control do not incorporate energy expenditure (or metabolic signals relating to fat-305
free mass or resting metabolic rate) as putative signals of food intake. Rather, appetite is thought to 306
be a function of signals arising from adipose tissue and the gastrointestinal tract.In contrast to the 307
adipocentric view of appetite control, our data (and that of others) indicate that in 308
addition to signals from adipose tissue and gastrointestinal peptides, there is input from metabolism 309
associated with FFM and the energy requirement associated with RMR. Consequently, the 310
conventional adipocentric model should be revised to allow for an influence of FFM in addition to 311
FM. The role of FFM in determining food intake can also be interpreted in the light of the re-analysis 312
K D [43]. The post-starvation recovery
313
period has been analysed in detail and indicates that weight is regained until a certain level of FFM 314
has been reached (while there is an overshoot in the restoration of FM). This suggests a relationship 315
between EI and FFM during recovery from a huge weight loss. In addition, the association of FFM 316
and EI is in keeping with the amino-static hypothesis put forward more than 60 years ago by 317
Our findings do not imply that FM does not play a role in appetite control. Our interpretation is that, 319
under normal weight conditions, FM has an inhibitory influence on food intake but the strength of 320
this tonic inhibition is moderated by insulin and leptin sensitivity [37]. As people overconsume (due 321
to cultural obesogenic influences), FM increases and the consequential increase in leptin and insulin 322
resistance weaken the inhibitory influence of FM T - 323
that accumulating FM fails to suppress food intake and permits more eating (over-consumption). 324
Indeed there is good evidence that low insulin sensitivity reduces post-prandial satiety and weakens 325
meal to meal appetite control [45]. Therefore, on the basis of these recent findings we have 326
proposed a conjoint influence of FFM and FM on appetite control [33]. This is set out in Figure 3. This 327
model provides a different theoretical approach to the biology of appetite control, with the 328
influence of FFM and RMR, in addition to signals stemming from adipose tissue and GI peptides, 329
providing a more comprehensive account of appetite. 330
331
Figure 3 332
This diagram shows a formulation for appetite control in which a proposed tonic signal for the drive 333
‘M‘ I
334
this drive is under tonic inhibition from leptin whose action reflects the amount of stored energy 335
reserves in the body. As adipose tissue increases, leptin insensitivity occurs and this tonic inhibition 336
is reduced. The drive to eat is periodically interrupted and suppressed by episodic signals in the form 337
eating is a consequence of the interactions among tonic and episodic physiological signals. See text 339
for further description. 340
341
It should be noted that the state of energy balance and changes in body composition may alter the 342
relationship between FFM, RMR and EI. Under conditions of significant energy deficit and weight loss 343
other regulatory signals (such as leptin) may feature more predominantly in the control of appetite 344
[46]. Therefore, its needs to be established how FM and FFM operate (independently or conjointly) 345
in the regulation of appetite during periods of significant weight loss. Developing clearer models 346
concerning the relationship between changes in body composition and signalling systems associated 347
with energy balance and imbalance has considerable implications for weight management in both 348
health and disease. 349
Implications 350
Do findings set out above, together with the new formula for the basic biology of appetite control, 351
offer any explanations for the puzzling problems that confront the study of weight regulation and 352
obesity? Many accounts of appetite control would benefit from the recognition that there exists a 353
tonic drive for energy that emanates from the continuous demand for energy to match energy 354
-intestinal tract and 355
brain). 356
One question that is rarely answered, partly because the question is rarely posed, is why obese 357
people continue to feel hungry and are driven to eat in the presence of large amounts of stored 358
energy in the body. Since obese individuals possess not only large amounts of adipose tissue but also 359
additional FFM, it would be expected that obese people would have a persistent drive to eat (from 360
the large FFM and higher RMR) that would be stronger than that of smaller and more lean 361
individuals of the same age. This explanation can also account for people feeling periodically hungry 362
in the absence of any obvious deficit or self deprivation. The uniform demand from RMR would be 363
expected to generate a drive to eat that would be episodically suppressed by the action of the 364
stomach and gastrointestinal (GI) peptides following the consumption of food. Therefore the pattern 365
of eating would arise from an interaction between the tonic drive to eat and episodic inhibitory 366
actions. In contrast to the episodic inhibitory action of most of the GI peptides, adipose tissues are 367
envisaged to exert a tonic inhibition (that depends on receptor sensitivity see above). 368
Athletes competing in sports that require a high body mass (field events in athletics, American 369
display voracious appetites. In contrast elderly people with sarcopenia often suffer from a loss of 371
appetite. Our explanation would be that the loss of FFM results in a weakening of hunger and a 372
reduced food intake. Management of this condition may need to involve the gentle use of exercise 373
to stimulate lean mass. Such a mechanism may involve the activation of stem cells as proposed by 374
Gutin [47]. 375
A model of appetite control that incorporates separate roles for FFM and FM can also help to explain 376
the inexorable progress of accumulating fatness as people progress from leanness to obesity. As fat 377
is gained the inhibitory effect of fat on appetite weakens (due to increasing receptor insensitivity) 378
whilst at the same time any incremental increase in FFM would augment the drive to eat. 379
Consequently as people become fatter it becomes easier to overeat, not more difficult. It follows 380
that obese people do not get any help from their stored fat to help them to resist the drive to eat; in 381
References
3831. Anand, B.K. and J.R. Brobeck, Hypothalamic control of food intake in rats and cats. The Yale 384
journal of biology and medicine, 1951. 24(2): p. 123. 385
2. Blundell, J., Is there a role for serotonin (5-hydroxytryptamine) in feeding? International 386
Journal of Obesity, 1976. 1(1): p. 15-42. 387
3. Sainsbury, A. and L. Zhang, Role of the arcuate nucleus of the hypothalamus in regulation of 388
body weight during energy deficit. Molecular and cellular endocrinology, 2010. 316(2): p. 389
109-119. 390
4. Badman, M.K. and J.S. Flier, The gut and energy balance: visceral allies in the obesity wars. 391
Science, 2005. 307(5717): p. 1909. 392
5. Wade, G.N., Regulation of body fat content? American Journal of Physiology-Regulatory, 393
Integrative and Comparative Physiology, 2004. 286(1): p. R14-R15. 394
6. Mayer, J., Glucostatic mechanism of regulation of food intake. The New England Journal of 395
Medicine, 1953. 249(1): p. 13. 396
7. Mellinkoff, S.M., et al., Relationship between serum amino acid concentration and 397
fluctuations in appetite. Journal of Applied Physiology, 1956. 8(5): p. 535. 398
8. Kennedy, G., The role of depot fat in the hypothalamic control of food intake in the rat. 399
Proceedings of the Royal Society of London. Series B-Biological Sciences, 1953. 140(901): p. 400
578. 401
9. Zhang, Y., et al., Positional cloning of the mouse obese gene and its human homologue. 402
Nature, 1994. 372(6505): p. 425-432. 403
10. Morton, G., et al., Central nervous system control of food intake and body weight. Nature, 404
2006. 443(7109): p. 289-295. 405
11. Woods, S.C. and D.S. Ramsay, Food intake, metabolism and homeostasis. Physiology & 406
behavior, 2011. 104(1): p. 4-7. 407
12. Rosen, E.D. and B.M. Spiegelman, Adipocytes as regulators of energy balance and glucose 408
homeostasis. Nature, 2006. 444(7121): p. 847-853. 409
13. Leibel, R.L., The role of leptin in the control of body weight. Nutrition reviews, 2002. 60(s10): 410
p. S15-S19. 411
14. Jequier, E. and L. Tappy, Regulation of body weight in humans. Physiological reviews, 1999. 412
79(2): p. 451. 413
15. Chan, J.L., et al., The role of falling leptin levels in the neuroendocrine and metabolic 414
adaptation to short-term starvation in healthy men. Journal of Clinical Investigation, 2003. 415
111(9): p. 1409-1421. 416
16. Schwartz, M.W., An inconvenient truth about obesity. Molecular metabolism, 2012. 1(1-2): p. 417
2. 418
17. Hall, K.D., et al., Quantification of the effect of energy imbalance on bodyweight. The Lancet, 419
2011. 378(9793): p. 826-837. 420
18. Thomas, D., et al., Why do individuals not lose more weight from an exercise intervention at 421
a defined dose? An energy balance analysis. Obesity Reviews, 2012. 422
19. Speakman, J.R., If body fatness is under physiological regulation, then how come we have an 423
obesity epidemic? Physiology, 2014. 29(2): p. 88-98. 424
20. Egger, G. and B. Swinburn, An" ecological" approach to the obesity pandemic. BMJ: British 425
Medical Journal, 1997. 315(7106): p. 477. 426
21. Stubbs, R., et al., A decrease in physical activity affects appetite, energy, and nutrient 427
balance in lean men feeding ad libitum. American Journal of Clinical Nutrition, 2004. 79(1): p. 428
62. 429
22. Schlögl, M., et al., Overfeeding over 24 hours does not activate brown adipose tissue in 430
23. Blundell, J. and A. Hill, Analysis of hunger: inter-relationships with palatability, nutrient 432
composition and eating. Recent Advances in Obesity Research, Libbey, London, 1985: p. 433
118 129. 434
24. Lenard, N.R. and H.R. Berthoud, Central and peripheral regulation of food intake and 435
physical activity: pathways and genes. Obesity, 2012. 16(S3): p. S11-S22. 436
25. Blundell, J.E. and J.I. MacDiarmid, Passive Overconsumption Fat Intake and Short Term 437
Energy Balancea. Annals of the New York Academy of Sciences, 1997. 827(1): p. 392-407. 438
26. Blundell, J. and J. Macdiarmid, Fat as a Risk Factor for Overconsumption:: Satiation, Satiety, 439
and Patterns of Eating. Journal of the American Dietetic Association, 1997. 97(7): p. S63-S69. 440
27. Edholm, O.G., et al., The Energy Expenditure and Food Intake of Individual Men. British 441
Journal of Nutrition, 1955. 9(03): p. 286-300. 442
28. Edholm, O., Energy balance in man. Studies carried out by the Division of Human Physiology, 443
National Institute for Medical Research. Journal of Human Nutrition (UK), 1977. 31(6): p. 444
413-431. 445
29. Mayer, J., P. Roy, and K. Mitra, Relation between caloric intake, body weight, and physical 446
work: studies in an industrial male population in West Bengal. American Journal of Clinical 447
Nutrition, 1956. 4(2): p. 169. 448
30. Caudwell, P., et al., The influence of physical activity on appetite control: an experimental 449
system to understand the relationship between exercise-induced energy expenditure and 450
energy intake. Proceedings of the Nutrition Society, 2011. 70(02): p. 171-180. 451
31. Blundell, J.E., What foods do people habitually eat? A dilemma for nutrition, an enigma for 452
psychology. Am J Clin Nutr, 2000. 71(1): p. 3-5. 453
32. Archer, E., G.A. Hand, and S.N. Blair, Validity of US nutritional surveillance: National Health 454
and Nutrition Examination Survey caloric energy intake data, 1971 2010. PloS one, 2013. 455
8(10): p. e76632. 456
33. Blundell, J.E., et al., Body composition and appetite: fat-free mass (but not fat mass or BMI) 457
is positively associated with self-determined meal size and daily energy intake in humans. 458
British Journal of Nutrition, 2012. 107(03): p. 445-449. 459
34. Smith, R., The ethics of ignorance. Journal of Medical Ethics, 1992. 18(3): p. 117. 460
35. Lissner, L., et al., Body composition and energy intake: do overweight women overeat and 461
underreport? The American journal of clinical nutrition, 1989. 49(2): p. 320-325. 462
36. Weise, C., et al., Body composition and energy expenditure predict ad-libitum food and 463
macronutrient intake in humans. International Journal of Obesity, 2013. 464
doi:10.1038/ijo.2013.85. 465
37. Blundell, J.E., et al., Role of resting metabolic rate and energy expenditure in hunger and 466
appetite control: a new formulation. Disease Models & Mechanisms, 2012. 5(5): p. 608-613. 467
38. Pedersen, B.K. and M.A. Febbraio, Muscles, exercise and obesity: skeletal muscle as a 468
secretory organ. Nature Reviews Endocrinology, 2012. 8(8): p. 457-465. 469
39. Ravussin, E., et al., Determinants of 24-hour energy expenditure in man. Methods and results 470
using a respiratory chamber. Journal of Clinical Investigation, 1986. 78(6): p. 1568-78. 471
40. Caudwell, P., et al., Resting metabolic rate is associated with hunger, self-determined meal 472
size, and daily energy intake and may represent a marker for appetite American Journal of 473
Clinical Nutrition, 2013. 97(1): p. 7-14. 474
41. Gibbons, C., et al., Validation of a new hand-held electronic data capture method for 475
continuous monitoring of subjective appetite sensations. International Journal of Behavioral 476
Nutrition and Physical Activity, 2011. 8(1): p. 57-64. 477
42. Stubbs, R.J., et al., Measuring the difference between actual and reported food intakes in the 478
context of energy balance under laboratory conditions. British Journal of Nutrition, 2014. 479
43. Dulloo, A.G., J. Jacquet, and L. Girardier, Poststarvation hyperphagia and body fat 481
overshooting in humans: a role for feedback signals from lean and fat tissues. The American 482
journal of clinical nutrition, 1997. 65(3): p. 717-723. 483
44. Millward, D.J., A protein-stat mechanism for regulation of growth and maintenance of the 484
lean body mass. Nutrition research reviews, 1995. 8(01): p. 93-120. 485
45. Flint, A., et al., Associations between postprandial insulin and blood glucose responses, 486
appetite sensations and energy intake in normal weight and overweight individuals: a meta-487
analysis of test meal studies. British Journal of Nutrition, 2007. 98(1): p. 17-25. 488
46. Rosenbaum, M., et al., Energy intake in weight-reduced humans. Brain research, 2010. 1350: 489
p. 95-102. 490
47. Gutin, B., Diet vs exercise for the prevention of pediatric obesity: the role of exercise. 491
International journal of obesity, 2011. 35(1): p. 29-32. 492