Citation:
Konopinski, M and Graham, I and Johnson, MI and Jones, G (2016) The Effect of Hypermobility on the Incidence of Injury in Professional Football: A multi-site cohort study. Physical Therapy in Sport, 21. pp. 7-13. ISSN 1873-1600 DOI: https://doi.org/10.1016/j.ptsp.2015.12.006
Link to Leeds Beckett Repository record: http://eprints.leedsbeckett.ac.uk/2195/
Document Version: Article
The aim of the Leeds Beckett Repository is to provide open access to our research, as required by funder policies and permitted by publishers and copyright law.
The Leeds Beckett repository holds a wide range of publications, each of which has been checked for copyright and the relevant embargo period has been applied by the Research Services team.
We operate on a standard take-down policy. If you are the author or publisher of an output and you would like it removed from the repository, please contact us and we will investigate on a case-by-case basis.
Title: The Effect of Hypermobility on the Incidence of Injury in Professional
Football: a multi-site cohort study
<H1> ABSTRACT
Background: A recent study demonstrated joint hypermobility increased the incidence of injury in an
elite football team utilising a univariate statistical model.
Objectives: To compare injury incidence between hypermobile and non‐hypermobile elite football
players incorporating a multi‐site design and multivariate inferential statistics.
Methods: 80 players comprising 3 English Championship football teams were followed prospectively
during the 2012‐2013 season. Joint hypermobility was assessed according to the 9‐point Beighton
Criteria at the start of the study period. A cut‐off score of ≥4 categorised a participant as
hypermobile. Player exposure and time‐loss injuries were recorded throughout.
Results: Mean ± standard deviation incidence of injuries was 9.2 ± 10.8 injuries/1000h. The
prevalence of hypermobility was 8.8%. Hypermobiles had a tendency for higher injury incidence
(mean [95% confidence interval] difference, 5.2 [0.9‐2.7] injuries/1000 h; p = 0.06). Cox regression
analyses found training exposure to be highly significant in terms of injury risk (p < 0.001) for all
participants. Non‐hypermobiles had a lower injury risk (p = 0.11), according to the Cox model, which
is suggestive but not conclusive that hypermobility predisposes injury risk.
Conclusions: Hypermobility showed a trend towards increased risk of injury. Training exposure is a
significant injury risk factor in elite football.
<H1> INTRODUCTION
Hypermobility refers to range of motion that exceeds normal limits at some or all joints in the body
(Russek, 1999). Generalised joint hypermobility is a term used to describe hypermobility that exists
in the absence of musculoskeletal pain and rheumatologic disease and takes into account an
individual’s age, sex and ethnicity (Simpson, 2006). Generalised joint hypermobility is classified as a
heritable connective tissue disorder and represents a qualitative variation in the structural protein
collagen (Simmonds and Keer, 2007). The Beighton scale is a validated tool used to assess the
presence of generalised joint hypermobility (Remvig et al, 2007). Individuals are assessed on a 9‐
point system for excessive joint range of motion at the following anatomic sites: fifth finger, thumb,
elbow, knee, and trunk. The British Society of Rheumatology recommends a Beighton score ≥ 4 to
categorise an individual as hypermobile (Remvig et al, 2007).
Professional football is a contact sport with an estimated incidence of injury between 24 and 30
injuries per 1000 hours of match play and between 3 and 5 injuries per 1000 hours of training with a
high prevalence of lower limb injuries in which hamstring strains predominate (Walden et al, 2001;
Ekstrand, 2008; Ekstrand et al, 2011). The findings of a systematic review with meta‐analysis
suggests that hypermobility increased the risk of knee joint injury during contact sports, although
there was no evidence that hypermobility affected the risk of ankle joint injury (Pacey et al, 2010).
Two longitudinal studies included in the review investigated female football players ‐ cohort
comprised professional and semi‐professional athletes ‐ over a ten year period and found that
hypermobility was a risk factor for injury (Östenberg and Roos, 2000; Soderman et al, 2001).
Collinge and Simmonds (2009) were the first to investigate hypermobility as a risk factor for injury in
English male professional football. The authors reported the prevalence of joint hypermobility to be
between 21 and 42% depending on the threshold cut‐off score used to categorise hypermobility.
but a tendency for hypermobile participants to miss more competitive matches and training sessions
was reported.
Konopinski et al (2012) conducted a cohort study at a first tier English Premier League male football
club and found the incidence of injury was greater for players categorised as hypermobile than those
categorised as non‐hypermobile. This resulted in more missed days of match‐play and training,
recommending that pre‐signing medical screening should include the assessment of generalised
joint hypermobility.
To date, studies in professional male football have only been conducted at a single‐site (i.e. one
football club) reducing external validity of the findings. In addition, data has been analysed using
univariate statistics that do not control for interactions or confounding risk factors for injury.
Differences in definitions of injury, monitoring of exposure, measures and threshold scores for
categorising hypermobility make comparison between studies difficult. The aim of this study was to
investigate hypermobility as a risk factor for injury occurrence and to compare the incidence of
injury per thousand hours of exposure between hypermobile and non‐hypermobile elite football
<H1> METHODS
<H2> Participants, Recruitment and Selection
A prospective cohort study was conducted during the 2012‐2013 season. All clubs in the English
Championship were invited to participate by providing the Head Physiotherapist at each club with a
Study Pack that included a description of the study plan including operational procedures and a
letter of invitation. Clubs that expressed interest were sent a more detailed Study Manual before
being formally enrolled as a study site. All players with a professional contract at each enrolled club
provided written consent to allow their data be used in the study including pre‐season clinical
assessment, match and training exposure and reported injury and illness throughout the season.
Ethical approval was obtained from the Faculty of Health and Social Sciences Ethics Committee at
Leeds Beckett University and study data was coded for anonymity.
<H3> Procedure
Each club selected a designated member of the medical team to be responsible for collecting data
and forwarding it to the data custodian from the investigating team (<initials here>). On day 1 of
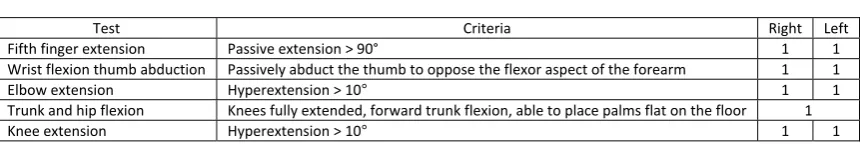
pre‐season, hypermobility status was measured using the 9‐point Beighton scale (Table 1) using a
cut‐off point of ≥4 to categorise a participant as hypermobile, consistent with previous investigations
(Östenberg and Roos, 2000; Collinge and Simmonds, 2009; Konopinski et al, 2012). Bilateral elbow
and knee extension values were measured using a goniometer to dichotomise joints as hypermobile
or non‐hypermobile (Norkin and White, 1995). Knee and elbow goniometric measurement have
been shown to have good intra‐rater reliability and moderate inter‐rater reliability (Watkins et al,
1991; Chunang et al, 2007). Anthropometric measurements and playing position were also recorded.
Table 1 The Beighton Scale
Test Criteria Right Left
Fifth finger extension Passive extension > 90° 1 1
Wrist flexion thumb abduction Passively abduct the thumb to oppose the flexor aspect of the forearm 1 1
Elbow extension Hyperextension > 10° 1 1
Trunk and hip flexion Knees fully extended, forward trunk flexion, able to place palms flat on the floor 1
Knee extension Hyperextension > 10° 1 1
Data collection procedures followed the guidelines set out in the Union of European Football
Associations (UEFA) consensus document for studies investigating football injury (Fuller et al, 2006).
A time loss definition of injury was used where an injury was defined as that sustained during
training or match play causing the player to interrupt the session or miss the subsequent session. A
reinjury was defined as an injury that was the same type and at the same anatomic site irrespective
of when it occurred over the season. Injury severity was categorised according to length of absence
from football as: slight (0 days), minimal (1‐3 days), mild (4‐7 days), moderate (8‐28 days), severe
(>28 days), or career ending.
Each injury was recorded on a standardised injury card for each player. Absence due to illness or
otherwise was not included in the injury audit analysis. Injuries were classified according to type,
location, side and whether the injury was a recurrence (i.e. re‐injury). A free‐text section allowed the
recording of diagnosis specifics. Re‐injury was defined as an injury of the same type and anatomic
site, occurring after return to full participation from the original injury. A non‐applicable injury was
defined as absence not due to trauma or overuse, for example elective surgery.
Exposure was recorded on monthly attendance record forms, which included all training and match
exposure to the nearest minute. Absence from football participation due to injury, international duty
or otherwise were recorded on the attendance form. Injuries incurred whilst on international duty
were not considered inclusive. Participants were deemed injured until able to participate fully in
team training or match‐play. Incidence of injury was derived from the exposure form and calculated
Monthly exposure sheets, and injury and illness information was coded for anonymity and returned
to the investigating team via email on a monthly basis. Information was checked for ambiguous or
missing data and medical teams contacted for clarification.
<H4> Data Analysis
Comparisons between hypermobile and non‐hypermobile participants were made using t‐tests,
Poisson tests, and a Cox Regression model. Unpaired t‐tests were used to compare demographic,
anthropometric, and exposure data between groups. Within‐participant comparisons of the number
of injuries in training and match play were made using Wilcoxon signed‐rank tests on pairwise
differences. The incidence of injuries per 1000 hours of exposure was calculated for hypermobile
and non‐hypermobile participants, and compared using Poisson tests. The influence of hypermobility
as a potential predictor variable for risk of injury was analysed by means of Cox regression analyses.
Analyses were performed using R version 3.0.2 (R Core Team, Vienna, Austria), with statistical
<H1> RESULTS
<H2> Characteristics of the Study Group
Twenty‐four football clubs from the English Championship were invited to participate in the study, of
which three enrolled. There were 80 male participants that provided pre‐season assessment data
(mean ± standard deviation [SD] age, 24.5 ± 4.6 years) including 10 goalkeepers, 30 defenders, 24
midfielders, and 16 attackers. Mean ± SD Beighton score was 1.30 ± 1.47 of a possible score of 9.
Seventeen participants went out on loan to different teams during the course of the study period.
The Poisson tests and Cox model accounted for this data censoring i.e. it was conducted on 80 participants and designed to control for drop‐outs. In order to avoid data distortion, all other data
are reported for the 63 players who were present for the entire study period.
The prevalence of hypermobility was 8.8% with 7 participants scoring 4 or more on the Beighton
scale. There were no statistically significant differences between hypermobile and non‐hypermobile
participants in age, height, weight or training and/or match exposure (Table 2). However, analysis of
age between the three participating teams demonstrated that one team had a significantly older
squad (mean ± SD age 27.12 ± 4.01 years) compared with the other two teams (23.49 ± 4.74 and
23.34 ± 4.72 years, p < 0.05, unpaired t‐test).
Table 2Demographic and Anthropometric Dataa
All Participants Hypermobile Non‐hypermobile P
Number of participants 80 7 73
Beighton score 1.30 ± 1.47 4.57 ± 0.79 0.99 ± 1.09 < 0.001bc
Age, y 24.45 ± 4.6 24.5 ± 6.41 24.44 ± 4.45 0.98c
Height, cm 181.22 ± 6.91 182.31 ± 3.47 181.11 ± 7.16 0.46c
Weight, kg 81.5 ± 14.14 79.23 ± 5.55 81.72 ± 14.71 0.37c
Training exposure, h 169.15 ± 79.24 132.63 ± 68.55 172.65 ± 79.73 0.19c
Match exposure, h 33.81 ± 20.93 30.49 ± 22.96 34.13 ± 20.87 0.17c
Total exposure (training
+ match), h 202.96 ± 87.05 163.12 ± 86.73 206.79 ± 86.71 0.24
c
aMean ± standard deviation summary data (unless otherwise stated). P represents comparisons between hypermobile and non‐
hypermobile participants.
bStatistically significant at P ≤ .05. cUnpaired t test.
<H2> Univariate Analysis of Injuries
A total of 117 injuries, including 15 multiple injuries and 17 re‐injuries, were recorded for the 63
participants who were monitored for the full duration of the study. The mean incidence of injuries
for all 80 participants was 8.4 injuries/1000 h ([95% CI = 0.72‐2.48], p = 0.16, Poisson test) (Table 3).
There was no statistically significant difference in mean incidence of injuries between hypermobile
and non‐hypermobile participants when non‐applicable injuries were included (hypermobile = 14.0
injuries/1000 h, non‐hypermobile = 8.8 injuries/1000 h, [95% CI = 0.88‐2.68], p = 0.06, Poisson test),
or excluded (hypermobile = 11.4 injuries/1000 h, non‐hypermobile = 8.1 injuries/1000 h, [95% CI =
0.72‐2.48], p = 0.16, Poisson test) (Table 3).
Table 3 Analysis of Injuriesa
All Participants Hypermobile Non‐hypermobile P
Number of injuries during training
+ match play per player (tally) 2.05 ± 1.63 (117) 3.00 ± 1.73 (12) 1.97 ± 1.61 (105) 0.57
b
Number of training injuries per
player (tally) 0.73 ± 0.90 (46) 0.40 ± 0.55 (2) 0.76 ± 0.92 (44) 0.22
b
Number of match injuries per
player (tally) 1.13 ± 1.28 (71) 2.00 ± 1.58 (10) 1.05 ± 1.23 (61) 0.26
b
Total incidence of injury
(training + match), per 1000 h 8.40 11.40 8.1 0.16
c (95% CI, 0.72‐2.48)
Total incidence of injury (training + match), per 1000 h (including non‐applicable injuries)
9.20 14.00 8.80 0.06c (95% CI, 0.88‐2.68)
Incidence of training injuries, per
1000 h 4.10 2.20 4.20 0.9
c (95% CI, 0.06‐1.94)
Incidence of match injuries, per
1000 h 29.90 51.50 28.10
0.053c (95% CI, 0.88‐
3.49)
Total days missed due to injury
(training + match) 42.87 ± 46.42 64.00 ± 49.92 41.05 ± 46.11 0.3d (95% CI, ‐38.1‐84.0)
Training days missed due to injury 20.70 ± 24.28 29.80 ± 24.57 19.91 ± 24.31 0.3d (95% CI, ‐20.0‐39.9)
Match days missed due to injury 10.02 ± 11.75 15.20 ± 14.32 9.57 ± 11.54 0.3d (95% CI, ‐11.9‐23.2)
Incidence of re‐injury, per 1000 h 1.11 2.63 0.99 0.13c (95% CI, 0.49‐9.35)
aMean ± standard deviation summary data (unless otherwise stated). P represents comparisons between hypermobile and non‐
hypermobile participants. bWilcoxon signed ranks test. c Poisson test. dUnpaired t test.
Of the sixty‐three participants followed for the duration of the study, fifty‐one sustained at least 1
injury (5 hypermobile, 46 non‐hypermobile). Twelve non‐hypermobile participants did not incur
injury, however all 7 hypermobile players were injured. Fourteen participants (22.2%) sustained at
statistically significant, hypermobile participants demonstrated a greater tendency to experience a
re‐injury (hypermobile, n=3/7; non‐hypermobile, n= 11/56; Fisher exact test, p = 0.11), with a
relative risk of 2.51 (95% CI, 0.85‐7.43).
Participants sustained a higher mean [95% CI] injury rate during match play (29.9 [0.88‐3.49]
injuries/1000 h) than during training (4.1 [0.06‐1.94] injuries/1000 h), with a mean (95% CI)
difference of 25.8 (5.17‐10.57) injuries/1000 h (p < 0.000). There was no statistically significant
difference in mean incidence of training injuries between hypermobile (2.2 injuries/1000 h) and
non‐hypermobile participants (4.2 injuries/1000 h; mean difference [95% CI] = 2.0 [0.06‐1.94]
injuries/1000 h, p = 0.9, Poisson test) (Table 3). Mean incidence of injuries during match play was
greater for hypermobile participants (51.5 injuries/1000 h) compared with non‐hypermobile
participants (28.1 injuries/1000 h; mean difference [95% CI] = 23.4 [0.88‐3.49] injuries/1000 h, p =
0.053, Poisson test) (Table 3), although this just failed to reach statistically significance.
Of the 63 players that remained at their parent club for the duration of the season, there was no
statistically significant difference in the mean ± SD number of training days missed due to injury
(hypermobile = 29.8 ± 24.57 days, non‐hypermobile = 19.91 ± 24.31 days, mean [95% CI] difference =
9.9 [‐20.0‐39.9], p=0.3, unpaired t test), or match days missed due to injury (hypermobile = 15.2 ±
14.32 days, non‐hypermobile = 9.57 ± 11.54 mean [95% CI] difference = 5.6 [‐11.9‐23.2], p=0.3,
unpaired t test) (Table 3).
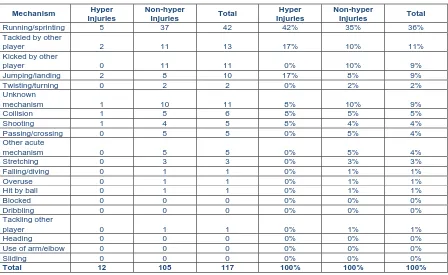
There were 117 unique injury mechanisms (Table 4). Hypermobile participants suffered a higher
percentage of contact and jumping/landing injuries relative to non‐hypermobiles. Of the 117 unique
injuries, comprising 128 different injury locations (one unique injury mechanism may result in more
than one site of injury) (Table 5) and 122 injury types (e.g. fracture dislocation of the ankle would
were attributed to the hypermobile participants. Half of injuries for all participants were classified as
moderate severity; however there were no statistically significant differences between hypermobile
and non‐hypermobile groups according to injury severity. Lower limb injuries were most common,
with the most frequent location of injury being the thigh (47/128, 37%) and ankle (19/128, 15%)
(Table 5). In terms of injury type, muscle rupture/tear/strain was most common (48/122, 39%)
(Table 6). Three of the 12 unique injuries (25%) suffered by hypermobile participants were located at
the knee (2 ligament sprains, 1 cartilage injury). Non‐hypermobile participants suffered 17 knee
injuries (16%), 8 of which were ligament sprains. This data failed to reach statistical significance
(Fisher exact test, p=0.59). Average days lost for knee injury in the hypermobile group was 48.8
[image:11.595.75.523.382.657.2]versus 22.5 in the non‐hypermobile group.
Table 4 Injury Mechanism
Mechanism Hyper Injuries
Non-hyper
Injuries Total
Hyper Injuries
Non-hyper
Injuries Total
Running/sprinting 5 37 42 42% 35% 36%
Tackled by other
player 2 11 13 17% 10% 11%
Kicked by other
player 0 11 11 0% 10% 9%
Jumping/landing 2 8 10 17% 8% 9%
Twisting/turning 0 2 2 0% 2% 2%
Unknown
mechanism 1 10 11 8% 10% 9%
Collision 1 5 6 8% 5% 5%
Shooting 1 4 5 8% 4% 4%
Passing/crossing 0 5 5 0% 5% 4%
Other acute
mechanism 0 5 5 0% 5% 4%
Stretching 0 3 3 0% 3% 3%
Falling/diving 0 1 1 0% 1% 1%
Overuse 0 1 1 0% 1% 1%
Hit by ball 0 1 1 0% 1% 1%
Blocked 0 0 0 0% 0% 0%
Dribbling 0 0 0 0% 0% 0%
Tackling other
player 0 1 1 0% 1% 1%
Heading 0 0 0 0% 0% 0%
Use of arm/elbow 0 0 0 0% 0% 0%
Sliding 0 0 0 0% 0% 0%
Table 5 Injury Location
Type All Participants Hypermobile Non‐hypermobile
Head/face 1 0 1
Shoulder/clavicular 2 0 2
Hip/groin 12 3 9
Neck/cervical spine 0 0 0
Upper arm 0 0 0
Thigh 47 2 45
Sternum/upper back 0 0 0
Elbow 0 0 0
Knee 17 3 14
Abdomen 0 0 0
Forearm 1 1 0
Lower leg/Achilles tendon 15 3 12
Lower back/pelvis 3 1 2
Wrist 1 1 0
Ankle 19 0 19
Hand/finger/thumb 1 0 1
Foot/toe 9 0 9
Total 128 14 114
Table 6 Injury Type
Type All Participants Hypermobile Non‐hypermobile
Concussion 1 0 1
Lesion of meniscus/cartilage 1 1 0
Haematoma/contusion/bruise 22 1 21
Fracture 2 1 1
Muscle rupture/tear/strain 48 6 42
Abrasion 0 0 0
Other bone injury 4 0 4
Tendon
injury/rupture/tendinosis 3 0 3
Laceration 0 0 0
Dislocation/subluxation 1 0 1
Synovitis/effusion 2 0 2
Nerve injury 3 0 3
Sprain/ligament injury 24 2 22
Overuse symptoms unspecified 2 0 2
Dental injury 0 0 0
Other type 9 1 8
Total 122 12 110
<H3> Multivariate Analysis of Injuries
The Cox model included the following as independent prognostic factors for injury risk; training
exposure per week, game exposure per week, age, and hypermobility status. Data was clustered on
player and stratified on position and club. Akaike Information Criterion (AIC) testing confirmed
[image:12.595.114.482.364.565.2]increasing injury risk (p = 0.000, Table 7). An extra hour per week of training increases the daily
hazard by a factor of 1.4 – an increase of 40% (Table 7; Figure 1). Game exposure per week did not
increase injury risk (p = 0.48, Table 7). Non‐hypermobile participants had a lower injury risk (p =
0.11), which was suggestive but not conclusive that hypermobility is a risk factor for injury (Table 7).
Non‐hypermobility increased the daily hazard by a factor of 0.67 – a decrease of 33% (Table 7; Figure
2). There was no tendency towards a heightened injury risk with increasing age (p = 0.2).
Figure 1. Cox model displaying survival fraction for injury relative to training exposure
Table 7 Cox Regression Model
Variable coef exp(coef) se(coef) robust se Z Pr(>|z|)
Match hours per week
0.11369 1.1204 0.14876 0.16201 0.702 0.483
Training hours per week
0.31617 1.37186 0.04131 0.03933 8.039 8.88E‐16a
Non‐ hypermobile
‐0.40178 0.66913 0.28838 0.25079 ‐1.602 0.109
aStatistically significant at P < .000.
<H1> DISCUSSION
The prevalence of hypermobility in a multi‐site sample of 80 English Championship football players
during the 2012‐2013 was 8.8%, with a mean ± SD incidence of 9.2 ± 10.8 injuries/1000 h. The
results show a tendency for participants with hypermobility to experience more injuries in match‐
play and overall (training plus match‐play), just failing to reach statistical significance. There was no
difference in days missed from training and match play between hypermobile and non‐hypermobile
participants. The low number of participants diagnosed with hypermobility is likely to have
contributed to low statistical power and the lack of significance found with inferential statistical
testing resulting in a type 2 error. With the observed injury rates and total exposures, the power was
0.2, R version 3.0.2 (R Core Team, Vienna, Austria). Had the injury rates been consistent with a
previous study for hypermobile participants (Konopinski et al, 2012), the predicted power is 0.98, R
version 3.0.2 (R Core Team, Vienna, Austria). We suggest that injury rate may differ between the
English Championship and English Premier League.
Hypermobility prevalence in an English Premier League football team was found to be 33.3% using a
Beighton cut‐off score of 4 or above (Konopinski et al, 2012). Collinge and Simmonds (2009)
reported the prevalence of joint hypermobility in a second tier professional football team to be 21%
using Beighton when a cut‐off score of 4 or above was applied and 42% when a score of 5 or greater
was used. The prevalence of hypermobility per se varies from 5% to 43% (Simmonds and Keer,
2007), suggesting that a prevalence of 8.8% is not atypical. The variability in reported prevalence
within the study population demographic i.e. age, gender and ethnicity. One of the teams in the
present study had a significantly older squad compared with the other two teams involved. Collinge
and Simmonds (2009) and Konopinski et al (2012) studied younger squads – mean ± SD 24.48 ± 4.8
and 22.5 ± 4.17 respectively. The older squad within the cohort for the present study may in part
account for the lower hypermobility prevalence. In a systematic review of 18 studies, 7 different
objective measures of hypermobility were used, involving 10 differing measurement methods (Pacey
et al, 2010). The Beighton scale is a popular diagnostic tool as it is easy to administer, however upper
limb measures predominate and it gives no indication of the degree of hypermobility. The Brighton
Criteria incorporates the Beighton score but also recognises symptoms and other characteristics
associated with connective tissue laxity (Grahame et al, 2000) (Table 8). It is possible that unique use
of the Beighton criteria under‐represented the number of elite football players participating in this
study with hypermobility. For example, the Brighton Criteria allow for the scenario whereby an
individual may have a Beighton Score of 1 (minor criterion met) plus 3 other minor criteria
associated with chronic and acute injury – dislocations, spondyloysis, hernia (Table 8). Anecdotal
[image:15.595.72.523.517.663.2]evidence in elite football suggests that it is not uncommon for such pathologies to coexist.
Table 8 Brighton Criteria
Major Criteria
Beighton score of 4/9 or greater.
Arthralgia for longer than 3 months in 4 or more joints.
Minor Criteria
Beighton score of 1, 2, 3/9.
Arthralgia (> 3 months) in one to three joints or back pain (> 3 months); spondylosis, spndylolysis, spondylolisthesis. Dislocation/subluxation in more than one joint or in one joint on more than one occasion.
Soft tissue rheumatism > 3 lesions (e.g. epicondylitis, tenosynovitis, bursitis).
Marfanoid habitus (tall, slim, span/height ratio > 1.03, upper:lower segment ratio < 0.89, arachnodactyly [positive Steinberg/wrist signs]).
Abnormal skin: striae, hyperextensibility, thin skin, papyraceous scarring. Eye signs: drooping eyelids or myopia or antimongoloid slant.
Varicose veins or hernia or uterine/rectal prolapse.
JH diagnosed in the presence of two major criteria or, one major and two minor criteria, or four minor criteria.
Mean incidence of injury during training and match play (4.1 injuries/1000 h, 29.9 injuries/1000 h
injuries/1000 h) (Walden et al, 2001; Ekstrand, 2008; Ekstrand et al, 2011; Ekstrand et al, 2013) . Our
findings are suggestive that hypermobility increases injury risk in football, consistent with previous
studies (Pacey et al, 2010; Konopinski et al, 2012). Thigh muscle ruptures/tears/strains were most
common for all participants, in keeping with current epidemiological injury studies on professional
football players (Walden et al, 2001; Ekstrand, 2008; Ekstrand et al, 2011; Ekstrand et al, 2013).
A major secondary finding from the study was that one extra hour per week of training significantly
increased injury risk within the population as whole. The majority of published research investigating
injury risk in elite football has focused on intrinsic risk factors such as age (Hawkins and Fuller, 1999;
Ekstrand, 2008), previous injury (Arnason et al, 2004; Hägglund et al, 2006; Walden et al, 2006),
muscle flexibility (Witvrouw et al, 2003; Arnason et al, 2004) , and muscle strength (Russek, 1999)
rather than training load. Previous studies in rugby league and Australian Rules football have shown
an increase in training load significantly increases incidence of injury (Gabbett, 2004; Rogalski et al,
2013). Gabbett (2004) followed 79 semi‐professional rugby league players throughout the course of
one season. Training intensity was measured using a rating of perceived exertion (RPE). Training load
was calculated by multiplying RPE by training duration. Training intensity (r = 0.83), duration (r =
0.79) and load (r = 0.8) significantly increased incidence of injury (p < 0.05) (Gabbett, 2004). Rogalski
et al (2013) used a similar methodological approach in a sample of 46 elite Australian Rules football
players. Increases in load relative to the previous week (OR = 2.58) significantly increased injury risk
(p < 0.05) (Rogalski et al, 2013). The present study is the first to report the relationship between
training duration and injury risk in professional football.
<H2> Study shortcomings
A larger sample size is required to improve the study power. Small to moderate associations
between risk factor and injury have been estimated to require over 200 unique injury cases (Bahr
addition, a single season prospective design was used in this study and a consecutive season
approach would have been beneficial to enhance external validity. The study suffered from
recruitment difficulties as only 3 from a possible 24 clubs enrolled.
The Beighton scale was employed in the current study as it is quick and easy to administer and
despite its use in previous studies we are increasingly concerned that it may not have been sensitive
enough to confirm a diagnosis of hypermobility in athletic populations. The moderate inter‐rater
reliability of the Beighton scale may be a limitation in our study given that participants were
measured by different clinicians. This may account for the low prevalence of generalised joint
hypermobility found in the study. Within the Beighton Scale upper limb measures predominate and
the scale provides limited information as to the degree of hypermobility. Future studies may wish to
consider better methods of identifying those athletes for which hypermobility may be clinically
significant.
Injury was defined in terms of time lost from football participation. This definition has been criticised
due to the strong subjective component associated with time‐loss due to injury (Konopinski et al,
2012). In addition to actual tissue damage, psychological issues i.e. anxiety and depression, may also
influence return‐to‐play time scales. Anxiety causes heightened physiological arousal and physical
sensations (Mallorqui‐Bague et al, 2014). Clearly the time‐loss definition is not free from error.
However, the definition is relevant considering the increasing body of evidence that anxiety and
depression are associated with hypermobility and the propensity for slower soft tissue healing rates
in this population (Bulbena et al, 2011; Garcia‐Campayo et al, 2011; Mallorqui‐Bague et al, 2014).
Training exposure was significantly associated with injury risk in the current study, however intrinsic
training and match load were not observed. The likelihood is that the unique interaction between
training load and duration is what affects injury rate. Future studies should incorporate global
studies should record previous injury for participants at baseline to include in the Cox model, as
previous research has consistently found it to be a predictor of injury risk.
<H3> Implications of Findings
Our findings suggest that hypermobility contributes to injury risk in professional football and we
recommend that players should be routinely screened for hypermobility. Identification of
hypermobility provides clinically relevant information in terms of injury prognosis, specific
rehabilitative strategies and return to play time‐scales. Sports Science and Medicine Departments
should consider the effect of increasing training exposure on injury risk in professional football
players. Future cohort studies investigating joint hypermobility in elite football should utilise a larger
sample size and may wish to categorise players according to both the Beighton and Brighton Criteria.
<H4> Conclusion
There was a tendency towards increased incidence of injury in hypermobile elite‐level football
players in the English Championship. Increased training exposure represented an injury risk for all
<H1>REFERENCES
1 Arnason A, Sigurdsson S, Gudmundsson A, Holme I, Engebretsen L, Bahr R. Risk factors for injuries
in football. Am J Sports Med 2004: 32(Suppl 1): 5S‐16S.
2 Bahr R, Holme I. Risk factors for sports injuries: a methodological approach. Br J Sports Med 2003:
37: 384‐392.
3 Bulbena A, Gago J, Pailhez G, Sperry L, Fullana MA, Vilarroya O. Joint hypermobility syndrome is a
risk factor trait for anxiety disorders: a 15‐year follow‐up cohort study. Gen Hosp Psychiatry 2011:
33: 363‐370.
4 Chunang Y, Chang Y, Hshiao Y, et al. Test‐retest reliability and interrater reliability of elbow range
of motion measurement. J Biomech 2007: 40(Suppl 2): 630.
5 Collinge R, Simmonds J. Hypermobility, injury rate and rehabilitation in a professional football
squad: a preliminary study. Phys Ther Sport 2009: 10: 91‐96.
6 Ekstrand J. Epidemiology of football injuries. Sci Sports 2008: 23: 7377.
7 Ekstrand J, Hägglund M, Walden M. Epidemiology of muscle injuries in professional football. Am J
Sports Med 2011: 39: 1226‐1232.
8 Ekstrand J, Hägglund M, Kristenson K, Magnusson H, Walden M. Fewer ligament injuries but no
preventive effect on muscle injuries and severe injuries: an 11‐year follow‐up of the UEFA
Champions League injury study. Br J Sports Med 2013: 47: 732‐737.
9 Fuller CW, Ekstrand J, Junge A, et al. Consensus statement on injury definitions and data collection
procedures in studies of football injuries. Scand J Med Sci Sports 2006: 16: 83‐92.
10 Gabbett T. Influence of training and match intensity on injuries in rugby league. J Sports Sci 2004:
22: 409‐417.
11 Garcia‐Campayo J, Asso E, Alda M. Joint hypermobility and anxiety: the state of the art. Curr
12 Grahame R, Bird HA, Child A. The revised (Brighton 1998) criteria for the diagnosis of benign joint
hypermobility syndrome (BJHS). J Rheumatol 2000: 27: 1777‐1779.
13 Hägglund M, Walden M, Ekstrand J. Previous injury as a risk factor for injury in elite football: a
prospective study over two consecutive seasons. Br J Sports Med 2006: 40: 767‐772.
14 Hawkins RD, Fuller CW. A prospective epidemiological study of injuries in four English
professional football clubs. Br J Sports Med 1999: 33: 196‐203.
15 Konopinski MD, Jones GJ, Johnson MI. The effect of hypermobility on the incidence of injuries in
elite‐level professional soccer players: a cohort study. Am J Sports Med 2012: 40: 763‐769.
16 Mallorqui‐Bague, N., Garfinkel, S. N., Engels, M., Eccles, J. A., Pailhez, G., Bulbena, A.
Neuroimaging and psychophysiological investigation of the link between anxiety, enhanced affective
reactivity and interoception in people with joint hypermobility. Front. Psychol 2014: 5: 1‐8.
17 Norkin C, White D. Measurement of Joint Motion: A Guide to Goniometry. Philadelphia: FA Davis;
1995.
18 Östenberg A, Roos H. Injury risk factors in female European football: a prospective study of 123
players during one season. Scand J Med Sci Sports 2000: 10: 279‐285.
19 Pacey V, Nicholson LL, Adams RD, Munn J, Munns CF. Generalized joint hypermobility and risk of
lower limb joint injury during sport: a systematic review with meta‐analysis. Am J Sports Med 2010:
38: 1487‐1497.
20 Remvig L, Jenson DV, Ward RC. Are diagnostic criteria for general joint hypermobility and benign
joint hypermobility syndrome based on reproducible and valid tests? A review of the literature. J
Rheumatol 2007: 32: 798‐803.
21 Rogalski B, Dawson B, Heasman J, Gabbett TJ. Training and game loads and injury risk in elite
Austalian footballers. J Sci Med Sport 2013: 16: 499‐503.
22 Russek L. Hypermobility syndrome. Phys Ther 1999: 79: 591‐599.
23 Simmonds JV, Keer RK. Hypermobility and the hypermobility syndrome. Man Ther 2007: 12: 298‐
24 Simpson M. Benign joint hypermobility syndrome: evaluation, diagnosis, and management. J Am
Osteopath Assoc 2006: 106: 531‐536.
25 Soderman K, Alfredson H, Pietila T, Werner S. Risk factors for leg injuries in female soccer players:
a prospective investigation during one out‐door season. Knee Surg Sports Traumatol Arthrosc 2001:
9: 313‐321.
26 Walden M, Hägglund M, Ekstrand J. Injuries in Swedish elite football: a prospective study on
injury definitions, risk for injury and injury pattern during 2001. Scand J Med Sci Sports 2005: 15:
118‐125.
27 Walden M, Hägglund M, Ekstrand J. High risk of new knee injury in elite footballers with previous
anterior cruciate ligament injury. Br J Sports Med 2006: 40: 158‐162.
28 Watkins MA, Riddle DL, Lamb RL, Personius WJ. Reliability of goniometric measurements and
visual estimates of knee range of motion obtained in a clinical setting. Phys Ther 1991: 71: 90‐97.
29 Witvrouw E, Danneels L, Asselman P, D’Have T, Cambier D. Muscle flexibility as a risk factor for
developing muscle injuries in male professional soccer players: a prospective study. Am J Sports Med
2003: 31: 41‐46.
30 Woods C, Hawkins RD, Maltby S, Hulse M, Thomas A, Hodson A. The football association medical
research programme: an audit of injuries in professional football. Analysis of hamstring injuries. Br J
Sports Med 2004: 38: 36‐41.