GE-International Journal of Management Research
Vol. 4, Issue 12, December 2016 Impact Factor- 5.779 ISSN(O): 2321-1709, ISSN(P): 2394-4226© Associated Asia Research Foundation (AARF)
Website: www.aarf.asia Email : editor@aarf.asia , editoraarf@gmail.comA STUDY ON TOURISTS’ PERCEPTION OF RAJASTHAN AS A
TRAVEL DESTINATION
Dr. Vinita Bhatia
Assistant professor, Lala Lajpatrai Institute of Management, Mumbai, Maharashtra, India.
ABSTRACT
The success of destination marketing lies in their ability to compete, brand a city, understand
visitor perceptions and satisfaction, provide value, and manage the total visitor experience
(Tasci, Gartner, & Cavusgil, 2007; WTO, 2005). The study of tourist perception reveals
strengths and weaknesses of the destination, which later will be used to improve the
destination’s attributes, and develop marketing strategies to compete with other businesses
(Pakaleva-Shapira, 2007). Rajasthan state of India has become a favourite destination for
tourist all over the world because of its rich historical, cultural and environmental heritage
coupled with various fairs and festivals. This study, therefore, aims to examine perception of
domestic and international tourists regarding their travel experience within the Rajasthan
state of India. The present study measures the impact of destination attributes on tourists’
satisfaction and future behavioural intentions. A structured questionnaire was used to seek
responses from the tourists after the completion of the stay in Rajasthan when they were
about to leave for their original destinations. The results indicate that the tourists were very
satisfied with their stay in Rajasthan and they have an intention to revisit or recommend
Rajasthan as a travel destination to others. In the present paper the researcher has put forth
the results in detail.
Keywords: Destination, Future Behavioral Intention, Perception, Satisfaction, Tourists
Introduction
a service. Experience and knowledge have a constant bearing on perception. Successful experiences enhance and boost the perceptive ability and lead to accuracy in perception of a person whereas failure erodes self confidence (Agarwal, 2010). Perception is often correlated with satisfaction, loyalty and behavioural intentions (Gnoth, 1997; Fuchs & Reichel, 2006; Seddighi & Theocharous, 2002; Murphy et al., 2000; Mohamad et al., 2012).
India is a well known international travel destination due to its long history, rich culture, beautiful natural resources, and the hospitality of Indian people. Though international tourists around the world visit India all year round but it is not getting the expected number of foreign tourists despite extensive marketing efforts (Chaudhary, 2000). According to Sarkar (1997) India is regarded less in terms of tourism than it deserves to be by the outside world. The image it portraits is that of mysticism, political instability, grinding poverty, illiteracy, terrorism, unemployment, communal discord, lack of social services, and corruption.
Research framework was constructed based on certain studies (Buhalis, 2000; Bhatia, 1986) upon tourist perception of destination components. Destination components like attractions, amenities, transportation network and accommodation influences the perception of tourists. If the experience of tourist about a destination is positive then it signifies that tourists are satisfied and are likely to return or willing to recommend the travel destination to others.
Review of Literature
Mohamad et al. (2012) conducted a research to discover the perception of foreign tourists of Malaysia as a travel destination and to find its relationship with tourists’ future behavioral intention. They found accessibility and available package, heritage attraction and natural attraction as significant factors which influence the perception of a tourist. Similarly, Fuchs and Reichel (2006) studied the perception of tourist and found that if a tourist is attracted by any destination then he will be interested in visiting that destination in future. In tourism research, a perception is the image of a tourist destination that makes effective the behavioural intentions (Gnoth, 1997). Seddighi and Theocharous (2002) measured the perceptions/feelings about the attributes of tourist destination and its relationship with revisiting a travel destination. Murphy et al. (2000) defined a structural model that relates the tourist intention to return as a proxy of satisfaction/quality with his/her perceptions of the travel experience.
environment. Attributes like perceived attractions, perceived quality, perceived risk and perceived value are used to measure the satisfaction of tourists (Quintal and Phau, 2008). Attributes like comfort facilities, safety and infrastructure, cultural attractions and shopping, tourist attractions and ambience and variety and accessibility affects tourist satisfaction (Prayag, 2008). Later Prayag (2009) found attributes like attractions, accommodation, accessibility, amenities, activities, local community and shopping have an impact on tourist satisfaction. Destination image, attitude, motivation, natural landscapes, service and recreational equipments are the attributes which affects tourist satisfaction (Lee, 2009). Attributes like travel environment, price/value, accessibility and natural attraction influences tourist satisfaction (Alqurneh et al., 2010). Basic services, attractions and accessibility affect tourist satisfactions (Celeste and Armando, 2013). Destination image, personal involvement, place attachment and overall satisfaction influence satisfaction of tourists (Prayag and Ryan, 2011; Prayag, 2012). Tourist attractions, basic facilities, cultural attractions, natural environment, tourist substructures and access possibilities influence tourist satisfaction (Coban, 2012).
Numerous researchers (Glasson, 1994; Light, 1996; Cho, 1998; Kozak and Rimmington, 2000; Bigne et al., 2001; Yuksel, 2001; Joaquin and Cladera, 2009; Joaquin and Jaume, 2010) have studied the tourists’ satisfaction of a destination and found its relationship with future behavioural intentions.
Light (1996) studied the characteristics of tourists staying at a heritage place in South Wales and the findings reveal that tourist satisfaction is influenced by tourists’ experiences and which motivates them to revisit and expand the length of stay. Glasson (1994) in their research reported that 80% of the tourists visiting cultural/heritage places of oxford were satisfied and 80% of the tourists are likely to return in future. According to (Kozak and Rimmington, 2000) destination attractiveness, facilities and services at the destination airport, the level of overall satisfaction, and the frequency of previous experiences were found to be stronger indicators of tourists’ intentions to revisit Mallorca.
as a reason to come back. Similar study was conducted by Joaquin and Jaume (2010) to examine the impact of the satisfaction and dissatisfaction based evaluations on both the tourists’ overall satisfaction and their intention to return to the destination. There is no doubt that if tourists are satisfied with their holiday experience, it is expected that they will be more likely to continue to return to a destination and/or recommend it to others (Kozak and Rimmington, 2000). According to Bigne et al. (2001) satisfied tourists communicate their good experience to others (word of mouth) and tend to purchase the product repeatedly (intention to return).
Research Methodology
The purpose of the study is to examine the tourist’s perception of Rajasthan as a travel destination; to identify the level of satisfaction of tourists on their travel experience; to study the future behavioural intention i.e. intention to return and willingness to recommend Rajasthan as a travel destination.
In this proposed research, quantitative research method was a justified choice as it suited the prior formulation of specific research questions and hypotheses testing. It involves empirical investigation of tourist perception which comprises of destination components. The population of the study is domestic and international tourists coming to Rajasthan. For the proposed study, travel destinations like Jodhpur, Jaisalmer, Jaipur, Udaipur, Ajmer and Mt. Abu were selected as they are most visited places by both the Indian and foreign tourist. Hence, Survey was carried out on tourist visiting these preferred tourist places of Rajasthan. A total of 800 questionnaires were distributed to hotel properties selected for the study. A pretesting was done with 30 tourists staying in different hotels to check there are no ambiguous words & all items are appropriate. Front desk employees of hotels in selected destination of Rajasthan distributed the questionnaires to the national and international tourists either at check-out or on the last day in Rajasthan. Of the 800 questionnaires distributed, 613 were completed representing 76.625% response rate. Due to missing values and the like, the sample was further reduced to 578 respondents.
discussed with some researchers and experts in the hospitality field. After meeting their suggestions a final questionnaire was developed and was self-administered.
Research Hypothesis
Ho1: There is no significant impact of tourists’ perception of destination components on
tourists’Satisfaction.
Ho2: There is no significant impact of tourists’ perception of destination components on
tourists’ future behavioural intentions towards a destination.
Ho3: There is no significant relationship between tourists’ satisfaction from a destination and
tourists’ future behavioural intentions towards a destination.
Analysis and Interpretation
In order to get the destination component scale ready for analysis, a factor analysis of the variables was conducted. Ten factors emerged from this procedure.
Factor Analysis (Underlying Dimensions of Tourists’ Perceptions of destination
components)
5; Community Attitude – Factor 6; Security – Factor 7; Price – Factor 8; Shopping – Factor 9; Cleanliness – Factor 10.
The ten factors underlying tourists’ perceptions of destination components in Rajasthan are as follows:
Accommodation (Factor 1) contained twelve attributes and explained 29.964% of the variance in the data, with an eigenvalue of 21.574, a reliability of 0.953 and mean of 3.6. The attributes associated with this factor dealt with hotels basic amenities/facilities, internet in hotel, location, friendliness and responsiveness of staff, staff appearance, clean room and bathroom, availability of many good restaurants, room service, variety and good quality of food in hotel and nearby restaurants.
Culture (Factor 2) accounted for 9.390% of the variance, with an eigenvalue of 6.761, and a reliability of 0.841 and mean of 4. This factor was loaded with ten attributes that referred to culture. The attributes were historical places, ancient monuments, beauty of historical places and monuments, architecture of the ancient buildings, religious places, cuisine, traditional art work, folk dance, traditional attire and music.
Leisure (Factor 3) loaded with ten attributes. This factor accounted for 8.430% of the variance, with an eigenvalue of 6.069, and a reliability of 0.829 and mean of 4.1. These attributes were entertainment facilities, amusement parks, shopping malls, cinema theatres, public bars, games, natural beauty, activities during fairs and festivals, and recreational facilities like sight-seeing, swimming, biking etc.
Amenities (Factor 4) contained nine attributes that referred to amenities. This factor explained 4.579% of the variance, with an eigenvalue of 3.297, a reliability of 0.936 and a mean of 3.6. These attributes were telephone/STD/PCO, power/electricity connection, internet facility/cyber cafe facility, medical facility, availability of good drinking water, exchange of foreign currency or availability of ATMs, public toilets, reservation facility, proper sign boards and directional indicators.
Transport (Factor 5) accounted for 4.055 % of the variance, with an eigenvalue of 2.920 and a reliability of 0.776 and mean of 3.3. This factor was loaded with eight attributes that referred to transport. The attributes were comfortable vehicle, government support, conveyance problem, places well connected by air, rail and road, availability of air conditioned/ deluxe buses and timely availability of transport.
attributes were helpful people, misbehaviour with tourist, communication barriers, necessary information for tourist assistance, and behaviour of driver/conductor.
Security (Factor 7) contained five attributes that referred to security. This factor explained 3.332% of the variance, with an eigenvalue of 2.399, a reliability of 0.692 and a mean of 3.7. These attributes were overcrowdings at public places, well informed tourist guides, safe place and free from theft, safe travelling and safe hotel room.
Price (Factor 8) accounted for 2.558% of the variance, with an eigenvalue of 1.842, a reliability of 0.971 and mean of 3.2. This factor was loaded with two attributes that referred to price. The attributes were reasonable taxi charges and charges in the restaurant.
Shopping (Factor 9) contained three attributes that referred to shopping. This factor explained 2.339% of the variance, with an eigenvalue of 1.684, a reliability of 0.732 and a mean of 3.8. These attributes were variety of products for shopping, good quality products, accessibility of tourist places and market area.
Cleanliness (Factor 10) loaded with two attributes. This factor accounted for 2.095% of the variance, with an eigenvalue of 1.508, a reliability of 0.658 and a mean of 2.5. These attributes were clean and hygienic city, clean and hygienic tourist site.
Hypothesis 1
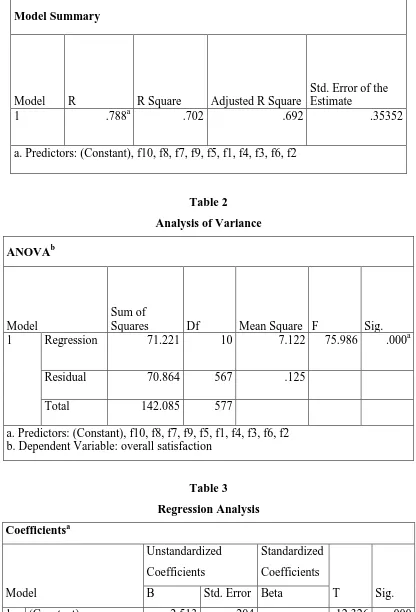
Multiple regression analysis was employed to investigate whether the independent variable (ten factors) exerted significant impact on the dependent variable (overall satisfaction). The ten independent variables were expressed in terms of the standardized factor scores (beta coefficients). The dependent variable, tourists’ satisfaction, was measured with 3 statements on a 5-point Likert-type scale.
The results of the regression analysis are shown in table 1, 2, 3. To predict the goodness-of-fit of the regression model, the multiple correlation coefficient (R), coefficient of determination (R
2
), and F ratio were examined. First, the R of independent variables (ten factors, X1 to X10) on the dependent variable (tourists’ satisfaction, or Ys) is 0.788, which showed that the
tourists had positive and high overall satisfaction levels with the ten dimensions. Second, the R
2
Rajasthan.
In the regression analysis, the beta coefficients could be used to explain the relative importance of the ten dimensions (independent variables) in contributing to the variance in tourists’ satisfaction (dependent variable). The results of multiple regression show that all ten factors have a significant impact on tourists’ satisfaction. As far as the relative importance of all the dimensions is concerned, Factor 2 (Culture, B2=0.304, p=0.000) carried the heaviest weight for tourists’ satisfaction, followed by Factor 3 (Leisure, B3=0.284, p=0.000), Factor 1 (Accommodation, B1=0.243, p=0.016), Factor 5 (Transport, B5=0.229, p=0.000), Factor 7
(Security, B7=0.221, p=0.000), Factor 4 (Amenities, B6=0.185, p=0.000), Factor 6
(Community Attitude, B6=0.127, p=0.006), Factor 8 (Price, B8=0.092, p=0.020), Factor 9
(Shopping, B9=0.084, p=0.008), Factor 10 (Cleanliness, B10=0.076, p=0.030). The results
showed that a one unit increase in culture factor would lead to a 304 unit increase in tourists’ satisfaction in Rajasthan, other variables being held constant. In conclusion, all underlying dimensions are significant. Thus, the results of multiple regression analysis reject null hypothesis 1, that there is no significant impact of tourists’ perception of destination components on tourists' satisfaction. So, there is a significant impact of tourists’ perception of destination components on tourists' satisfaction.
Table 1
Model Summary
Model Summary
Model R R Square Adjusted R Square
Std. Error of the Estimate
1 .788a .702 .692 .35352
[image:9.595.89.505.80.692.2]a. Predictors: (Constant), f10, f8, f7, f9, f5, f1, f4, f3, f6, f2
Table 2
Analysis of Variance
ANOVAb
Model
Sum of
Squares Df Mean Square F Sig.
1 Regression 71.221 10 7.122 75.986 .000a
Residual 70.864 567 .125
Total 142.085 577
a. Predictors: (Constant), f10, f8, f7, f9, f5, f1, f4, f3, f6, f2 b. Dependent Variable: overall satisfaction
Table 3
Regression Analysis
Coefficientsa
Model
Unstandardized Coefficients
Standardized Coefficients
T Sig.
B Std. Error Beta
Accommodation Factor 1
.040 .016 .243 2.420 .016
Culture Factor 2 .182 .032 .304 5.728 .000
Leisure Factor 3 .192 .034 .284 5.701 .000
Amenities Factor 4 .114 .021 .185 5.375 .000
Transport Factor 5 .164 .035 .229 4.748 .000
Community Attitude Factor 6
.032 .024 .127 2.899 .006
Security Factor 7 .198 .038 .221 5.143 .000
Price Factor 8 .072 .036 .092 2.513 .020
Shopping Factor 9 .031 .022 .084 2.547 .008
Cleanliness Factor 10 .024 .029 .076 2.345 .030
a. Dependent Variable: Overall Satisfaction
Hypothesis 2
[image:10.595.92.506.36.312.2]For testing hypothesis 2, again multiple regression analysis was employed to investigate whether the independent variable (ten factors) exerted significant impact on the dependent variable (tourists’ future behavioural intentions). The dependent variable, tourists’ future behavioural intentions, was measured with 3 statements on a 5-point Likert-type scale.
Table 4, 5, 6 shows the results of the regression analysis. The multiple correlation coefficient (R) is 0.749, coefficient of determination (R
2
) 0.680, and F ratio is 72.300 which was considered significant (p=0.000). The regression model achieved a satisfactory level of goodness-of-fit in predicting the variance of tourists’ future behavioural intentions in relation to the ten factors.
The results of multiple regression show that eight factors have a significant impact on tourists’ future behavioural intentions. As far as the relative importance of the eight dimensions is concerned, Factor 2 (Culture, B2=0.274, p=0.000) carried the heaviest weight for tourists’ future behavioural intentions, followed by Factor 3 (Leisure, B4=0.223, p=0.000), Factor 4 (Amenities, B3=0.187, p=0.000), Factor 1 (Accommodation, B1=0.159,
p=0.000), Factor 5 (Transport, B5=0.139, p=0.000), Factor 8 (Price, B8=0.085, p=0.003),
Factor 7 (Security, B7=0.085, p=0.004) and Factor 6 (Community Attitude, B6=0.078,
unit increase in tourists’ future behavioural intentions with Rajasthan, other variables being held constant.
In conclusion, all underlying dimensions are significant except for Factor 9 (Shopping) and Factor 10 (Cleanliness). Thus, the results of multiple regression analysis reject null hypothesis 2, except for Factor 9 and Factor 10, that there is no significant impact of tourists’ perception of destination components on tourists' future behavioural intentions towards a destination. So, there is a significant impact of tourists’ perception of eight destination components on tourists' future behavioural intentions towards a destination.
[image:11.595.68.529.409.776.2]The results are consistent with the numerous studies (Gnoth, 1997; Murphy et al., 2000; Seddighi and Theocharous, 2002; Fuchs and Reichel, 2006; Mohamad et al., 2012) who have also found the significant impact of destination components on tourists’ future behavioral intention. Many author have found a significant relationship of tourists’ future behavioral intention with heritage attraction and natural attraction (Baloglu and McCleary, 1999; and Mohamad et al., 2012); entertainment (Baloglu and McCleary, 1999); transport or accessibility to a tourist destination (Mohamad et al. (2012); food and accommodation (Yuksel (2001); community attitude (Shi et al., 1997); hospitality (Yuksel,2001); Safety (Yuksel, 2001).
Table 4
Model Summary
Model Summary
Model R R Square Adjusted R Square
Std. Error of the Estimate
1 .749a .680 .663 .32080
a. Predictors: (Constant), f10, f8, f7, f9, f5, f1, f4, f3, f6, f2
Table 5
Analysis of Variance
ANOVAb
Model
Sum of
Squares df Mean Square F Sig.
1 Regression 74.407 10 7.441 72.300 .000a
Total 132.760 577
[image:12.595.86.511.122.511.2]a. Predictors: (Constant), f10, f8, f7, f9, f5, f1, f4, f3, f6, f2 b. Dependent Variable: future behavioural intention
Table 6
Regression Analysis
Coefficientsa
Model
Unstandardized Coefficients
Standardized Coefficients
T Sig.
B Std. Error Beta
1 (Constant) 1.205 .185 6.511 .000
f1 .073 .015 .159 4.909 .000
f2 .159 .029 .274 5.502 .000
f3 .154 .031 .223 4.643 .000
f4 .142 .031 .187 4.908 .000
f5 .083 .019 .139 4.302 .000
f6 .060 .022 .078 2.725 .007
f7 .075 .026 .085 2.866 .004
f8 .059 .020 .085 2.991 .003
f9 .048 .035 .055 1.369 .172
f10 .007 .033 .009 .212 .832
a. Dependent Variable: future behavioural intention
Hypothesis 3
willing to return in future or will recommend it to others (Glasson, 1994; Light, 1996; Kozak and Rimmington, 2000; Bigne et al., 2001; Yuksel, 2001; Joaquin and Cladera, 2009; Lee, 2009; Prayag, 2009; Kim et al., 2013).
Table 7
Correlation between tourists’ satisfaction and tourists’ future behavioural intention
Tourists’ future behavioural intention
Tourists’ satisfaction Tourists’ future
behavioural intention
Pearson Correlation 1 .764**
Sig. (2-tailed) .000
N 578 578
Tourists’ satisfaction Pearson Correlation .764** 1
Sig. (2-tailed) .000
N 578 578
**. Correlation is significant at the 0.01 level (2-tailed).
Conclusion
The research reveals there is an impact of destination components on tourists’ satisfaction and also on future behavioural intentions. Moreover there is a significant relationship between tourists’ satisfaction and future behavioural intentions.
between tourists’ satisfaction at the tourist destination and tourists’ future behavioural intentions.
References
Agarwal, P. K. (2010) Organization Behavior, Meerut, India: Pragati Prakashan. Alqurneh, M., Filzah, M. I., and Othman, A. R. (2010). Tourism destination image,
satisfaction and loyalty: A study of the Dead Sea in Jordanian curative tourism. Paper presented at The Third International Conference on International Studies (ICIS 2010), Hotel Istana Kuala Lumpur. College of Law, Government and International Studies, University Utara Malaysia. Sintok, pp. 1-10.
Baloglu, S. and McCleary, K.W. (1999). A model of destination image formation. Annals of Tourism Research, 26(4), 868-97.
Bhatia, A.K. (1986). Tourism Development: Principles and Practices. New Delhi, India: Sterling Publishers.
Bigne, J. E., Sanchez, M. I., and Sanchez, J. (2001). Tourism image, evaluation variables and after purchase behavior: Interrelationship. Tourism Management, 22( 6), 607-16.
Buhalis, D. (2000). Marketing the competitive destination of the future. Tourism Management, 21(1), 97-116.
Celeste, E. and Armando, L. V. (2013). Destination Attributes’ Evaluation, Satisfaction and Behavioural Intentions: A Structural Modelling Approach. International Journal of Tourism Research, 15(1), 66-80.
Chaudhary, M. (2000). India's image as a tourist destination — a perspective of foreign tourists. Tourism Management, 21(3), 293-297.
Chi, C. G., and Qu, H. (2008). Examining the structural relationships of destination image, tourist satisfaction and destination loyalty: An integrated approach. Journal of Tourism Management, 29(4), 624-636.
Cho, B. (1998). Assessing tourist satisfaction: An exploratory study of Korean youth tourists in Australia. Tourism Recreation Research ,23(1), 47-54.
Coban, S. (2012). The Effects of the Image of Destination on Tourist Satisfaction and Loyalty: The Case of Cappadocia. European Journal of Social Science, 29(2), 222-232.
Glasson, J. (1994). Oxford:a heritage city under pressure: Visitors, impacts and management responses. Tourism Management, 15(2), 137-144.
Gnoth, J. (1997). Tourism motivation and expectation formation. Annals of Tourism Research, 24(2), 283-304.
Joaquin, A., and Cladera, M. (2009). Analysing the effect of satisfaction and previous visits on tourist intentions to return. European Journal Of Marketing ,43(6), 670-685. Joaquin, A., and Jaume, G. (2010). Tourist Satisfaction and Dissatisfaction. Annals of
Tourism Research ,37(1), 52–73
Kim, S., Holland, S., and Han, H. (2013). A Structural Model for Examining how Destination Image, Perceived Value, and Service Quality Affect Destination Loyalty: A Case Study of Orlando. International Journal of Tourism Research, 15(4),313-328. Kozak, M., and Rimmington, M. (2000). Tourist Satisfaction with Mallorca, Spain, as
an Off Season Holiday Destination. Journal of Travel Research, 38(3), 260-269. Lee, T-H (2009). A Structural Model to Examine How Destination Image, Attitude,
and Motivation Affect the Future Behavior of Tourists. Leisure Sciences: An Interdisciplinary Journal, 31(3), 215-236.
Light, D. (1996). Characteristics of the audience for events’ at a heritage site. Tourism Management, 17(3), 183-190.
Medlik. S. (1993). Dictionary of Travel, Tourism and Hospitality (2nd Edition). London: Butterworth Heinemann.
Mohamad, M., Abdullah, A. R., and Mokhlis, S. (2012). Tourists’ Evaluations of Destination Image and Future Behavioural Intention: The Case of Malaysia. Journal of Management and Sustainability, 2(1), 181-189.
Murphy, P., Pritchard, M., & Smith, B. (2000). The destination product and its impact on traveler perceptions. Tourism Management, 21(1) 43-52.
Pakaleva K. A., Shapira, k. (2007). New paradigms in City Tourism Management: Redefining Destination Promotion. Journal of Travel Research [Electronic], 46(1), 108-114.
Prayag, G. (2008). Image, Satisfaction and Loyalty – The Case of Cape Town. Anatolia: An International Journal of Tourism and Hospitality Research, 19(2), 205-224.
Prayag, G. (2012). Paradise for Who? Segmenting Visitors’ Satisfaction with Cognitive Image and Predicting Behavioural Loyalty. International Journal of Tourism Research. 14(1), 1-15.
Prayag, G., and Ryan, C. (2011). Antecedents of Tourists’ Loyalty to Mauritius: The Role and Influence of Destination Image, Place Attachment, Personal Involvement, and Satisfaction. Journal of Travel Research, 51(3), 342-356.
Raina, A. K., and Agarwal, S.K. (2004). The Essence of Tourism Development, India: Sarup and Sons.
Robbins, S. P., & Judge, T. (2007). Organizational behavior. Upper Saddle River, N.J: Pearson/Prentice Hall.
Sarkar, C. (1997). India’s image poor, The Tribune, 3 August 1997, in Chaudhary, M. (2000). India’s image as a tourist destination a perspective of foreign tourists. Tourism Management, 21(3), 293-7.
Seddighi, H.R. & Theocharous, A.L. (2002), A model of tourism destination choice: a theoretical and empirical analysis, Tourism Management, 23(5) 475-87.
Shi, C-Y., Zhang, J., and You, H-M. (1997). Structural Equation Model for tourism destination competitiveness from tourists' perception perspectives. Journal of International Hospitality, Leisure and Tourism Management, 1(1).
Taneja, R. (2006). Destination Management, New Delhi, India: Alfa.
Tasci, A. D. A., and Gartner, W. C. (2007). Destination image and its functional relationships. Journal of Travel Research,45(4), 413-425.
Quintal, V., and Phau, I. (2008). A Structural Approach towards Perceptions and Satisfaction of Revisit Intentions. in Spanjaard, D., Denize, S., and Sharma, N. (ed), Proceedings of Australian and New Zealand Marketing Academy Conference, Dec 1 2008. Olympic Park, Sydney: University of Western Sydney.