lance and Society, 2 (4). 564 - 580 (17). ISSN 1477-7487
Link to Leeds Beckett Repository record:
http://eprints.leedsbeckett.ac.uk/527/
Document Version: Article
Creative Commons: Attribution-Noncommercial-No Derivative Works 3.0
The aim of the Leeds Beckett Repository is to provide open access to our research, as required by funder policies and permitted by publishers and copyright law.
The Leeds Beckett repository holds a wide range of publications, each of which has been checked for copyright and the relevant embargo period has been applied by the Research Services team.
We operate on a standard take-down policy. If you are the author or publisher of an output and you would like it removed from the repository, please contact us and we will investigate on a case-by-case basis.
2(4): 564-580 http://www.surveillance-and-society.org
© 2005 Surveillance & Society and the author(s). All rights reserved. ISSN: 1477-7487
An Exploration of the External Validity of
Self-Report amongst Arrestees
David Patton
1Abstract
Self-report validation surveys in the USA focussing on arrestees’ self-reports unequivocally demonstrate that they do not validly report their recent drug consumption despite being a highly drug involved group. Like their American counterparts, English arrestees display very high levels of drug consumption. Data used from the NEW -ADAM programme (1998) is used to explore the extern al validity of arrestees’ self-reports to drug consumption in the 3 days prior to interview. Drug consumption in the UK has become a normalized activity among adolescents, young adults and ‘clubbers’. Arrestees and young offenders have recently been adde d to this list. Therefore the normalization of drug use provides an interesting context through which to view the present findings amongst arrestees.
Introduction
The importance of documenting accurate drug prevalence rates cannot be understated in the current climate of the normalization of drug use in Britain. Throughout the last decade there has been increasing interest in the levels of drug consumption documented by drug prevalence surveys, especially in relation to adolescents (Parker et al., 1998). This has been largely due to ever increasing levels of drug consumption (Measham et al., 2001; Ramsay et al., 2001). However, despite this growing interest and the consequent creation of new drug surveys, and notwithstanding the expansion of existing drug prevalence surveys, little attempt has been made to explore the external validity of self-reports to drug consumption.
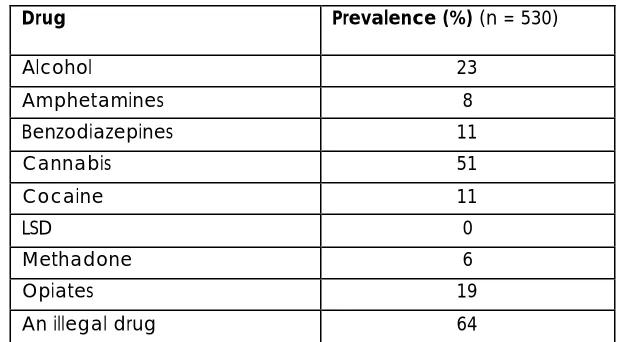
Prior to the New England and Wales Arrestee Development and Monitoring (NEW-ADAM) programme which interviewed and drug tested arrestees, very little was known about their levels of drug use, let alone the external validity of arrestee self-reports to recent drug consumption. Hence, data from the NEW-ADAM programme is used here to explore the external validity of arrestees’ self-reports to drug consumption in the 3 days prior to interview (Bennett, 1998). Successive NEW-ADAM surveys have shown that arrestees represent a highly drug involved population (Bennett, 2000, 1998). In the present sample 64% of arrestees tested positive for an illegal drug in the 3 days prior to interview.
Surveillance & Society 2(4) 565
Drug Prevalence (%) (n = 530)
Alcohol 23
Amphetamines 8
Benzodiazepines 11
Cannabis 51
Cocaine 11
LSD 0
Methadone 6
Opiates 19
[image:3.596.158.470.103.274.2]An illegal drug 64
Table 1: Prevalence of Drug Consumption in the 3 days prior to interview as measured by urinalysis
The levels of drug consumption found in Table 1 demonstrate that the availability and consumption of drugs are a part of the everyday realities of arrestees’ lives. Patton (2004, 2002) advocates arrestees’ drug use has become a normalized activity. Further, Hammersley et al. (2003) suggest that this is also true for young offenders. Despite this, it remains to be seen whether highly drug involved samples in the UK, that is where drug consumption is a normal feature of their lifestyle, validity self-report their recent illegal drug consumption.
It is clear from studies in the USA that arrestees do not validly report their recent consumption of illegal drugs. Despite arrestees in the USA displaying high levels of drug consumption they have consistently produced low levels of self-report validity (De Jong & Wish, 2000; Gray & Wish, 1999; Hser, 1997; Magura and Kang, 1997; Harrison, 1997; Mieczkowski and Newel, 1997; Harrison, 1995; Magura et al, 1995; Fendrich & Xu, 1994; Feucht, et al., 1994; Mieczkowski and Newel, 1993; Mieczkowski et al., 1991). Harrison (1997) states that studies from the USA have repeatedly demonstrated that only half of those arrestees testing positive for a drug report having consumed it within the relevant time period. Indicators of valid reporting practices among arrestees are the exception (Page et al., 1977; Mieczkowski, 1990).
Mieczkowski (1990: 298) states that ‘linking truthfulness to drug type and user type represents two ways to accurately evaluate self-report data’. Taking Mieczkowski's first point in relation to validity and drug type, it is clear that a key factor influencing the validity rates for arrestees in the USA when comparing self-reports and urinalysis is the type of drug being reported (Harrison, 1997; Magura et al., 1987; Wish et al., 1986). Therefore, willingness to report use of a drug among arrestees varies with the type of substance. It seems that arrestees are least willing to admit to cocaine use, followed by amphetamines and opiates, with cannabis being the drug most likely to be reported (Mieczkowski et al., 1991; Harrison, 1995).
Surveillance & Society 2(4) 566
Kang, 1997) especially when surveyed at the beginning of their treatment programme (Wish et al., 1997).
In Britain over the last decade drug consumption has become a normalized leisure activity amongst adolescents, young adults, young offenders and arrestees (Parker et al., 1998; Measham et al., 2001; Hammersley et al., 2003; Patton, 2002; 2004). The normalized status of drugs provides an interesting context in which to view the resultant external validity of self-report findings among English arrestees when asked whether they had used a range of 8 drug types in the 3 days prior to interview.
Methodology
Data generated by the NEW-ADAM programme was utilised in the present study (Bennett, 1998). The NEW-ADAM programme was the first branch of the 'International Arrestee Drug Abuse Monitoring (I-ADAM) program'. The English programme was based closely on the methods used in the 'Drug Use Forecasting Program' in the USA
The NEW-ADAM programme emerged during the mid-nineties, at around the time of The Conservative White paper ‘Tackling Drugs Together: A Strategy for England 1995 – 1998’. The strategy highlighted the need for quality indicators of drug use and the development of research into the connections between drugs and crime. Further, the NEW -ADAM programme became key to the Labour Government’s drug strategy, ‘Tackling Drugs to Build A Better Britain: The Government’s 10-Year Strategy for Tackling Drug Misuse (1998), as one of the prime research programmes used to monitor and evaluate it’s progress. It is undoubtable that data collected by the NEW -ADAM programme in terms of the high levels of drug consumption found among arrestees, as well a the key role of heroin, crack/cocaine and crime, paved the way for the expansion of the use of drug testing in the Criminal Justice System and Criminal Justice Policy relating to drugs and crime – for example the Crime and Disorder Act 1998 and the Drug Treatment and Testing Order; The Criminal Justice and Court Services Act 2000 and the drug testing of arrestees at the point of charge/conviction for trigger offences in relation to specified Class A drugs .
Nevertheless, the NEW-ADAM programme had four main aims: first, to develop a procedure for interviewing and drug testing arrestees. Second, to generate an alternative measure of drug use through urinalysis that might usefully supplement existing measures of drug use. Third, to generate information about the prevalence of illegal drug use. Finally, to consider what drug testing and self-reported interviewing of arrestees could contribute towards understanding the relationship between drug use and crime (Bennett, 1998).
Surveillance & Society 2(4) 567
to conduct systematic random probability sampling given the chaotic nature of police custody suites (Wish and Gropper, 1990).
Each respondent was approached by a researcher and informe d about the nature and purpose of the research including its independence from the police, its standard features such as voluntary participation, confidentiality, anonymity and its requirements: a thirty minute interview and urine specimen.
Later the NEW -ADAM programme devised a system of probability sampling, despite the fact that such an approach had never been undertaken in the USA. A team of 4 researchers worked in a custody suite for 24 hours a day, 7 days a week. Every arrestee that entered the custody suite would be monitored (excluding those who were deemed ineligible) and therefore had a known and equal chance of selection.
The following arrestees were deemed ineligible for interview: arrestees who were unfit due to alcohol intoxication; arrestees who were unfit due to drug intoxication; arrestees who were persistently unfit due to ill health or physical condition; arrestees suffering from mental disorders; arrestees who required an interpreter; arrestees who were potentially violent; arrestees who were deemed ineligible at the discretion of the custody sergeant or gaoler; children and juveniles; arrestees held only for a breath test or offences of drunkenness; arrestees who had been in custody in excess of 48 hours; prison transfers/arrestees not at liberty prior to entering the custody suite.
Once the arrestee had been deemed eligible and had agreed to participate, they were interviewed. A standard questionnaire was employed based upon the research instruments used by the 'ADAM program'. Each interview was designed to last no longer than thirty minutes. The main areas explored in the interview were drug consumption over different time periods, including the 3 days prior to interview; intravenous drug trying and sharing, drug dependence and treatment needs, sources of legal and illegal income; drugs and crime and general lifestyle questions. After interview each arrestee was asked to provide a urine specimen. This was tested for eight different drug types: Alcohol, Amphetamines (including ecstasy), Benzodiazepines, Cannabinoid metabolite, Cocaine metabolite (including crack), LSD, Methadone, Opiates (including heroin).
A total of 839 arrestees were interviewed. Between 83% and 87% of arrestees agreed to be interviewed from those that were deemed eligible to be interviewed and were approached by a researcher for an interview, and 74% provided a urine specimen.
The urinalysis technique used by the NEW -ADAM programme was based on an immunoassay screening test known as the Kinetic Interaction of Microparticles test (KIMS) and was analysed by the Forensic Science Service. The KIMS test is based on the kinetic interaction of microparticles in a solution. This interaction is measured by the changes that occur in the light transmission (Abuscreen, 1996).
Surveillance & Society 2(4) 568
presented in Table 2 (below) that the duration of detectability of the KIMS test coincides with the duration the drug stays in the persons body (Manno, 1986b).
Substance Duration of Detectability
Amphetamine 3 days
Benzodiazepines 3 days (therapeutic dose)
Cannabinoids: Single use 3 days
Cannabinoids: Moderate use (4 times per week) 4 days
Cannabinoids: Heavy use 10 days
Cannabinoids: Very heavy use 21 –27 days
Cocaine Metabolites 2 – 3 days
[image:6.596.159.438.488.656.2]Methadone 3 days
Table 2: Metabolism Rates for different drugs
In the NEW-ADAM programme, the respondents were not given any prior notice that they would be urine tested for drug consumption before they entered the custody suite. Rather, the first point at which the arrestees were told about the urine test was immediately prior to interview.
Amendments to the NEW-ADAM Methodology
The methodology used for the present study differed in two significant ways from that used by Bennett (1998) in the NEW-ADAM programme. First, due to the concentration of drug consumption amongst those aged under 35 (Ramsay & Partridge, 1999); all arrestees aged over 34 years were excluded from the present analysis. Consequently, 719 arrestees are included in the statistical analysis of this work as opposed to 839 in the original sample.
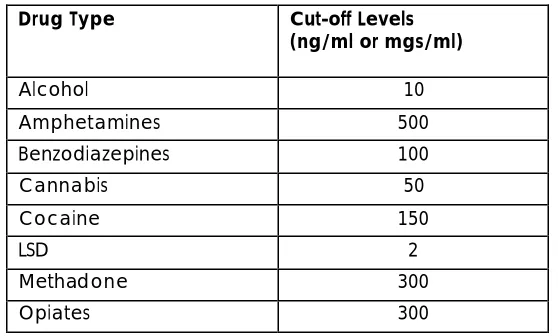
Drug Type Cut-off Levels
(ng/ml or mgs/ml)
Alcohol 10
Amphetamines 500
Benzodiazepines 100
Cannabis 50
Cocaine 150
LSD 2
Methadone 300
Opiates 300
(N.B. the cut-off levels for all drug types except alcohol are expressed as ng/ml, and alcohol as mg/100ml) Table 3: Cut-off levels used by the KIMS tests by drug type
Surveillance & Society 2(4) 569
cut-off level refers to the minimum concentration of a drug or its metabolite that needs to be present in a urine specimen for the test to reliably detect its presence. The choice of cut-off level will determine how long after ingestion the test will be able to detect the presence of the drug (Wish & Gropper, 1990).
Two main terms are important when referring to the inherent accuracy of drug tests: sensitivity and specificity. Sensitivity refers tothe ability of a test to reliably detect a minimal concentration of a given drug. The cut-off levels used in the first developmental stage of the NEW-ADAM programme were altered for the second developmental stage in collaboration with the Forensic Science Service in order to strike a balance between over and under sensitive tests (Bennett, 2000). All analysis conducted herein is based on the improved cut-off levels.
Specificity refers to the ability of a test to be able to distinguish between two very similar single-chemical components of a drug or its metabolite in the urine. Immunoassay screening tests are less reliable in their ability to detect accurately, especially in relation to amphetamines and cocaine and when compared to gas chromatography (Bennett, 1998). However, the choice of the KIMS test was selected on the basis of its recommendation from the Forensic Science Service and its accepted levels of accuracy (Bennett, 1998).
Nevertheless, urinalysis screening is not an exact science. The reliability of drug testing is not wholly dependent on the merits and strengths of the test itself, but also by the quality of the sample collection, chain of custody and reporting and administrative procedures (Boone, 1987). Bennett (1998) closely adhered to the sample collection, chain of custody reporting and administrative procedures provided by the Forensic Science Service. Despite the many possible limitations of urinalysis, or factors that may affect its ability to provide accurate results, it is believed that the results obtained from the immunoassay technique conducted by the Forensic Science Service are sufficiently accurate for use within a general research context such as this one.
In the present study, two measures of drug detection were used to determine the extent of drug consumption amongst arrestees in the 3 days prior to interview: traditional self-report and urinalysis. These measurement tools were further employed to explore two key outcomes: first, the levels of concordance between self-report and urinalysis, and second, the external validity
of arrestees’ responses.
Harrison (1997) notes that there are three ways of looking at self report data. Table 4 provides an aid to understanding the following description of the methods of classifying the data.
Arrestee Denies Use Arrestee Admits Use
Urinalysis Result
Negative (1) Concordant Abstainer (2) Non-Concordant User (-)
Urinalysis Result Positive (3) Non-Concordant User (+) (4) Concordant User
Surveillance & Society 2(4) 570
The first method relates to the concordance outcome, and shall be termed the Overall Concordance Method. This utilises data from all four cells. Cell 1, where an individual’s urinalysis result is negative and their self-report is negative, is added to Cell 4, where an individual’s urinalysis result is positive and their self-report is positive. This gives the total/percentage of concordant self-report and urinalysis results. Further, Cell 2, where an individual’s urinalysis result is negative and their self-report is positive, is added to Cell 3, where an individual’s urinalysis result is positive and their self-report is negative. This gives the total/percentage of non-concordant self-reporters and urinalysis results.
The second and most common way of looking at the data, is to focus on those who are found positive by urinalysis. This method shall be termed the Positive Drug Test Method. The only relevant cells in this method of analysis are Cells 3 and 4. The total of these two cells is added together to give the total number/percentage testing positive (Total A). The total of Cell 3 and of Cell 4 is then calculated separately into percentages of the overall total previous ly calculated (Total A). This figure provides the percentage of respondents inaccurately self-reporting (Cell 3) and the percentage of respondents accurately self-reporting (Cell 4).
Third, a method that shall be termed the Self-Report Versus Drug Test Method, compares the total number of respondents who self-report drug use (by adding Cell 2 to Cell 4) to the total number of respondents testing positive for a drug (by adding Cell 3 to Cell 4).
The validity outcomes of arrestees’ self-reports have been measured in this work using Cohen’s Kappa (K) and Conditional Kappa (Kc) (Bishop, et al., 1975). Magura, et al., (1987)
introduced this method, and it has since been widely used and recommended as the most appropriate test to use in this context (Ditton, et al., 2000; Magura & Kang, 1996). Cohen’s Kappa measures the level of agreement between two nominal variables in a way which allows for chance agreement when attempting to measure and categorise the same event, behaviour or phenomenon. Validity is therefore defined in terms of the output of the K or Kc score produced
in relation to a given drug.
Kc, a variant of K, has increasingly been used. The principle is essentially the same as that
highlighted above, except that one of the two nominal variables is identified as being superior to the other in classifying the event, behaviour or phenomenon (Bishop, et al., 1975). The research literature has always selected urinalysis as the superior variable. This approach is also taken here. Therefore in this work Kc values refer to the extent to which arrestees’ self-report agrees
beyond chance with their urinalysis result. Only those arrestees with a positive urinalysis result are included in the computation of Kc.
The output from K and Kc is a coefficient that ranges from 0 to 1. A value of 0 indicates that the
Surveillance & Society 2(4) 571
Despite the numerical boundaries outlined above (a score of 0.8 to 1 signifying the cut-off level indicating an acceptable level of validity) it should be noted that it is believed that the term 'validity' is a quantitative concept as opposed to a categorical one. That is, behavioural reports are valid to varying degrees as expressed in the range of K and Kc scores. Bryman (2001)
defines the K and Kc scores beyond 0, 0.8 and 1 as follows: a score of 0.4 to 0.59 is taken to
be indicative of ‘fair’ validity. A score of 0.6 to 0.79 is indicative of ‘good’ validity. This demonstrates that the scores are quantitative and can be compared, although for the practical interpretation of the results in this study the level at which a score is accepted as valid shall remain at 0.8 and above.
Results
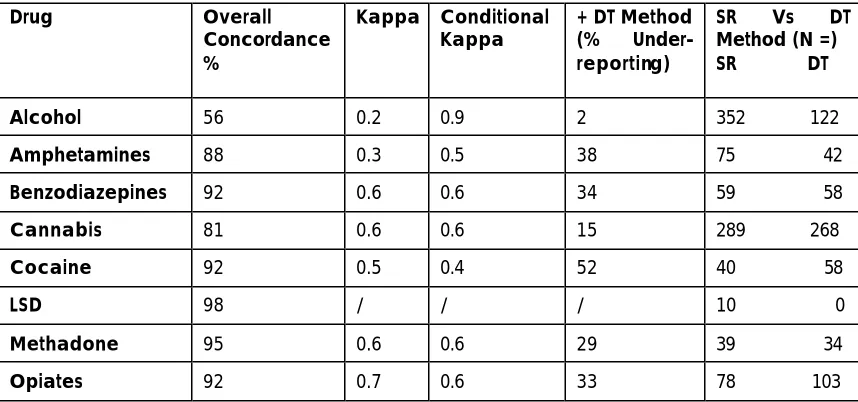
Drug Overall
Concordance %
Kappa Conditional
Kappa + DT Method (% Under-reporting)
SR Vs DT Method (N =) SR DT
Alcohol 56 0.2 0.9 2 352 122
Amphetamines 88 0.3 0.5 38 75 42
Benzodiazepines 92 0.6 0.6 34 59 58
Cannabis 81 0.6 0.6 15 289 268
Cocaine 92 0.5 0.4 52 40 58
LSD 98 / / / 10 0
Methadone 95 0.6 0.6 29 39 34
Opiates 92 0.7 0.6 33 78 103
[image:9.596.83.512.282.483.2]N.B. / = no result could be computed; +DT = positive drug test; SR = Self-Report; DT = Drug Test Table 5: The concordance and validity of arrestees self-reports
The concordance between arrestees’ self-reports and urinalysis results using the Overall Concordance Method is presented in the first column of Table 5. K scores are indicated in the second column, and Kc scores in the third column. The percentage of arrestees that may have
under-reported use, in line with the Positive Drug Test Method, is presented in the fourth column. Finally, the number of self-reports and urinalysis positives gained in relation to recent drug consumption are presented in the fifth column using the Self-Report Versus Drug Test Method.
The Concordance Outcome
Surveillance & Society 2(4) 572
(including ecstasy) at 88%.
In the early self-report validation literature, a 70% concordance cut-off level was accepted as denoting good validity (Ball, 1967; Cox & Longwell, 1974; Amsel, et al., 1976). If one were using this marker, the conclusion drawn would have to be that arrestees' self-reports of recent illegal drug consumption demonstrates good validity.
Upon further exploration, it is clear that high concordance levels are a product of high numbers of drug abstainers located in Cell 1 for each drug type. Hence, drugs with a higher prevalence rate, which therefore have a higher number of drug consumers and a lower number of drug abstainers, produced the lowest concordance levels – alcohol and cannabis. Table 6 shows that as the number of drug abstainers decreases so does the level of concordance. This finding follows the pattern identified in the USA (Harrison, 1995). Amphetamines (including ecstasy) provided the only exception to this general pattern.
Drug Number of Concordant
Abstainers (n =)
Overall Concordance Level (%)
LSD 520 98
Methadone 481 95
Cocaine 460 92
Amphetamine 439 88
Benzodiazepine 451 92
Opiates 418 92
Cannabis 200 81
[image:10.596.81.513.297.484.2]Alcohol 176 56
Table 6: The number of concordant abstainers and the percentage of their overall concordance by drug type
Table 6 suggests that those who have not consumed a drug in the recent past report this. However, those respondents who have consumed a drug in the last 3 days have a greater tendency not to report their behaviour.
The Validity of Arrestees Self-Reports of Recent Drug Consumption
When exploring the validity of drug consumers’ self-reports of recent drug consumption, it emerged that no K or Kc value reached significance level for any of the illegal drug types. The K
and Kc scores were not too dissimilar. The main exception was for alcohol, which scored the
lowest K result, yet the highest Kc result. This can be explained by the higher number of positive
admissions to the consumption of alcohol than shown by the urinalysis results. The only other difference involved amphetamines, which included ecstasy consumption; this drug type produced a two point increase from its K result to its Kc result.
The only valid Kc result found was for alcohol (0.9), the only legal drug included in the list of
Surveillance & Society 2(4) 573
followed by amphetamines (including ecstasy) at 0.5. The remaining substances, benzodiazepines, cannabis, methadone and opiates all produced the same validity rating at 0.6.
The Kc results raise some surprising issues. It is perhaps understandable that alcohol attained the
highest validity score and cocaine (including crack) the lowest, yet questionable why drugs such as opiates (including heroin) and cannabis along with benzodiazepines and methadone attained the same validity score. There does not appear to be any discernible pattern in the results in terms of validity being related to the legal classification of drugs, a social desirability effect, or the increased prevalence and popularity of a drug, as indicated by some American studies (Harrison, 1995).
Due to the low K and Kc results obtained, it is concluded that the arrestees’ self-reports of their
recent illegal drug consumption are invalid as they failed to reach the recommended and accepted 0.8 cut-off level (Ditton, et al., 2000;Gray & Wish, 1999; Greenfield, et al., 1995; Zanis, et al., 1994).
The levels of under-reporting by drug type
The levels of under-reporting found, when using urinalysis as the 'superior' measure against which to validate self-reports of recent drug consumption, are high. The levels of under-reporting found for each drug display a greater range of scores when compared to the validity ratings, although, interestingly, the levels of under-reporting found follow the general validity ranking order.
Cocaine was the most under-reported drug as 52% of cocaine consumers failed to report use. This was followed by amphetamines (including ecstasy) at 38%. A similar range of drugs that produced validity ratings of the same score, had levels of under-reporting at around one third (methadone 29%, opiates 33%, benzodiazepines 34%).
The main exception to this is cannabis, which produced the lowest level of under-reporting for an illegal drug at 15%. Alcohol, which produced the only valid Kc rating, produced the lowest level
of under-reporting compared to the remaining seven drugs, with only 2% of arrestees failing to report their consumption. Clearly the type of drug being reported greatly affects the level of under-reporting.
Levels of Drug use Detected by Urinalysis and Self-Report
Given the K and Kc findings, it is perhaps surprising to find that more self-report admissions
were provided by arrestees in relation to their drug use than the number of positive urinalysis results per drug. It is noted that some of these differences are small, especially in relation to benzodiazepines and methadone (please refer to Table 1).
Surveillance & Society 2(4) 574
It would appear that arrestees have a greater willingness to report those drug types that have been identified as being normalized. Parker et al., (1998) identified cannabis, amphetamines, nitrates, and to a lesser extent LSD and ecstasy as representing the range of drugs that were regarded to have become normalized. Heroin and cocaine were not included. The finding of more self-report admissions for each drug (except heroin and cocaine) when compared to the number of positive urinalysis results, can perhaps be seen to be indicative of the normalized nature of these drug types. This finding may also cast doubt on the possible claim that arrestees are reluctant to disclose their illegal drug consumption in the police station as there is unequivocal evidence that they are more likely to disclose such information when compared to urinalysis.
It is clear that it would be extremely hard if not impossible to obtain 100% accuracy between reporting practices and urinalysis results, given the many possible factors that can come into play in relation to the accuracy of the tests and the (un)known errors made on behalf of the respondent. Combining prevalence findings from two or more drug measurement tools is a possible means by which to overcome some of the potential biases or errors associated with a single measurement tool.
Combining Measurement Tools
Cook, et al., (1997) believed that a mixture of drug prevalence measures should be combined when attempting to measure the level of drug consumption and correctly identify drug consumers. This approach has been used here, and the results are presented in Table 4. The first column displays the drug prevalence rates for the eight drug types when using self-report, the second column provides the urinalysis results (the sample size is smaller due to a lower percentage of arrestees who agreed to provide a urine specimen at the time of the interview), and finally in the third column, the results when combining the outcomes from the two measurement tools. The figures in the third column represent a new variable that was created, giving an arrestee a score of 1, indicating use, if either their drug test or their self report was positive, or a score of 0, indicating no use, if both their drug test and self-report was negative.
Drug Self-report
Prevalence (%) (n = 719)
Drug Test Prevalence (%) (n = 530)
Combined Prevalence (%) (n = 719)
Alcohol 66 23 66
Amphetamines 13 8 16
Benzodiazepines 10 11 13
Cannabis 51 51 56
Cocaine 8 11 12
LSD 2 0 2
Methadone 7 6 8
Opiates 13 19 19
Surveillance & Society 2(4) 575
Table 7: Drug Prevalence Rates by Measurement Tool
Table 7 (above) shows that when the prevalence of drug use recorded by the two measurement tools is combined generally higher drug prevalence rates are produced. The results suggest that both measurement tools have deficiencies in accurately detecting all drug events in the 3 days prior to testing. The main deficiencies using a urinalysis measure were in relation to alcohol and amphetamines (including ecstasy). Three times as many alcohol consumers were identified when using the combined method, and in relation to amphetamines, twice as many consumers went undetected.
Each measurement tool inevitably has inherent weaknesses, and the findings presented above may support using a combination of measurement tools when attempting to ascertain levels of drug consumption amongst a given sample, or to more accurately identify drug consumers.
Discussion
It is acknowledged that research with samples at risk of drug use indicates that validity of self-reporting varies widely (Magura et al., 1995). The diversity of findings may be due to a host of variables: place of interview, type of sample studied, type and pattern of drug use, type of testing technology used, period of time used for both self-report and the testing instrument. Despite the variability in the specific findings for each study, the overall conclusion from arrestee focussed studies in the USA is overwhelming, that the validity of self-reports of recent drug consumption is not valid when compared to a biological measurement tool such as urinalysis or hair. The findings of research based in England follow this identified trend.
The drug prevalence rates for arrestees clearly indicate the extent to which drug consumption has become common amongst arrestees. With 6 out of every 10 arrestees having consumed an illegal drug in the 3 days prior to testing, drug use was a clear feature of the lives of arrestees at the time of interview. Like their American counterparts, English arrestees fail to adequately report their recent drug consumption. It emerged very clearly that those who have not consumed a drug do not have a problem in disclosing this fact. A highly erroneous conclusion could therefore, have been drawn on the basis of the high concordance levels found between self-report and urinalysis results. However, on closer analysis far greater disparity was found when drug consumption had occurred.
The K and Kc scores show that arrestees’ self-reports are invalid in the sense that they did not
produce a score of 0.8 to 1 (with the exception of alcohol). The increased prevalence of a drug amongst this sample does not appear to be a useful variable in gaining valid self-reports to recent drug consumption. It is clear that cannabis is the drug of choice for the vast majority of arrestees. It was consumed by 51% of arrestees in the 3 days prior to testing, which by far outweighed the drug prevalence rate for methadone, consumed least by arrestees at 6%, yet both cannabis and methadone score a 0.6 K and Kc rating. It is thought that a possible
Surveillance & Society 2(4) 576
In terms of the legal classification of drugs affecting the likelihood of self-report, there is some slight evidence in support of the legal classification hypothesis. Cocaine, a Class A drug, was least validly reported whereas alcohol, the only legal drug, was most likely to be reported validly. However, it was not found that all Class A drugs produced the lowest validity results, with a gradual increase in the level of validity as the severity of legal classification reduced. Whilst cocaine, a Class A drug, did produce the lowest validity rating, the remaining Class A drugs produced higher validity ratings than cocaine, and these validity ratings were found to be on a par with the validity ratings for drugs lower down the legal classification scale.
Similarly, it cannot be concluded that the social desirability hypothesis is confirmed, whereby the most socially desirable drugs produced valid or more valid results when compared to those substances that are less socially accepted. For example, the level of social stigmatisation that heroin has in the UK does not compare to that of cannabis, yet both drugs scored identical Kc
ratings.
Further, it is unequivocal that the level of validity found is drug specific. For reasons that are at present unknown, arrestees have made very definite distinctions when deciding which drugs they are more willing to report. This is clearly displayed in the range of validity scores and perhaps most clearly in the levels of under-reporting found, which ranged from 2% to 52%.
The self-report measurement tool detected higher rates of drug use when compared to urinalysis positives for most drug types: alcohol, amphetamines, benzodiazepines, cannabis, and methadone. Heroin and cocaine were the only exceptions to this finding. Interestingly, the drugs that produced more self-reports when compared to urinalysis positives are the same drugs that have consistently been identified by normalization advocates as achieving normalized status. Cannabis and 'dance drugs' are more likely to be self-reported. Heroin and cocaine, which are not regarded as part of the normalization thesis, are less likely to be reported when compared to positive urinalysis detections. It would appear that arrestees do not have a problem in disclosing their recent consumption of those drugs that are regarded to be normalized, which may reflect a decreased stigma associated with drugs other than heroin and cocaine.
If similar findings to those presented above were found elsewhere over time with arrestees (or other criminal justice samples) it may come to mean that a different drug measurement tool or a combination of drug measurement tools may need to be selected, in order to most appropriately suit the drug type being explored. For example, the findings in this research indicate that there was a greater reluctance to disclose use of opiates (including heroin) and cocaine. At a very simple level, the recent introduction of drug testing arrestees for heroin or cocaine (as opposed to some form of self-report method) when arrested for a trigger offence would appear to make sense when attempting to accurately identify an arrestee’s recent use of these drugs. Further research exploring the external validity of self-reports would reveal and enable the application of the most appropriate drug measurement tool, or range of tools, that best suits a sample when attempting to measure drug use.
Surveillance & Society 2(4) 577
to conduct research of this nature. Gray and Wish (1999) highlight that ADAM researchers can do little to eliminate the social stigmas or threat of social sanctions for arrestees being interviewed, due to the location of their interviews. Yet they suggest that improving the interview room setting, stressing the confidential nature and the informed consent elements of the research, may help in the future. However, even when researchers have been careful to provide alternative interview scenarios (with employees) and increased informed consent discussions (with arrestees) they too have failed to document any increases in the validity of self-reports (Wish et al., 2000; Cook et al., 1997). No attempt was made to control for or assess the impact of the context in which the interview occurred as a factor affecting validity in the present study. Consequently, this factor cannot be quantified here. It is hoped that the finding relating to the production of more self-report admissions than positive urinalysis results would help to alleviate some of the potential criticisms aimed at the NEW-ADAM programme being used to assess the external validity of self-report.
If the findings presented here were repeated in other studies exploring the external validity of self-report amongst arrestees (or later among other criminal justice samples or other drug consuming groups), it may come to mean that under-reporting becomes an accepted feature of their self-reporting. In the future a consensus may be reached among researchers in the field backed by research evidence of an expected or ‘acceptable’ level of under-reporting of drug consumption per drug or per population type, and this level may be added on to any recorded levels of drug use provided by self-report, to provide a more accurate picture of drug consumption levels.
Again at a very hypothetical level, if the levels of under-reporting found in the present study were replicated elsewhere amongst other drug consuming groups in the UK, the implications for the knowledge base would be serious. Measham et al., (2001) notes that the levels of drug experience are greatest amongst clubbers, followed by young adults and finally adolescents. Patton (2004) advocates that arrestees overtake clubbers as the most drug experienced group (as illustrated in figure 1) due to their very high levels of drug involvement.
Figure 1: The Levels of Drug Use by Group
Drug Use
Arrestees
Clubbers
Young Adults
Surveillance & Society 2(4) 578
If arrestees, the most drug involved group, do not appear to validly report their recent use of drug consumption, what implications does this have for those further down the drug experienced spectrum? The work of Ditton et al., (2000) has shown that UK ecstasy users also under-report their drug use. If under-under-reporting was shown to be a feature of the practices of UK drug consumers (and it is acknowledged that studies are a long way from proving this point), the high levels of drug use already recorded for different drug consuming groups would have to be increased. Set in the context of the UK having one of the highest levels of drug consumption in Europe and having levels comparable to the USA (Measham et al., 2001), the current picture of the levels of drug use that relate to a wide range of drug using groups would have to be regarded as being under-estimates of the actual level of drug use. This heightens the need to take a fresh look at what methods, approaches and tools are needed to accurately measure drug use.
An increased concern and a prime research focus in the light of the results presented, must surely be that of evaluating the external validity of self-reports of drug consumption. A substantial amount of information, knowledge and money has been based upon the reliability of thousands of people honestly reporting and describing certain illegal aspects of their lives. So, while there is increased coordination between self-report studies, the issues relating to the external validation of this data remain unchanged. What is needed therefore, is a greater understanding of the number of people honestly disclosing their drug taking behaviour and in what situations, who these groups are most likely to be, and what dynamics are most likely to affect whether an individual honestly self-reports recent drug use. Unfortunately many of these aspects were not incorporated into the research design in the present findings.
At a time when those who consume drugs do not honestly report their use, in a context when drugs are widely available and have been used by a majority of the young adult population, the time has come to adopt different attitudes to the way in which drug consumption is perceived, approached and measured in the UK. It is clear that drug researchers are always attempting to discover better ways of extracting the truth from their respondents, the question may soon be: can we handle the truth?
References
Abuscreen (1996) ‘Abuscreen Online Automated Assays for Drug Abuse’, Roche Diagnostics Systems.
Amsel, Z., Mandell, W., Matthias, L., Mason, C., Hocherman, I. (1976) ‘Reliability and Validity of Self-Reported Illegal Activities and Drug Use Collected from Narcotic Addicts’, The International Journal of the Addictions, 11(2): 325-336.
Ball, J.C. (1967) ‘The Reliability and Validity of Interview Data Obtained from 59 Narcotic Drug Addicts’, The American Journal of Sociology, 72: 650-654.
Bennett, T. (2000) Drugs and Crime: The Results of the Second Development al Stage of the NEW-ADAM Programme. London: Home Office.
Surveillance & Society 2(4) 579
Bishop, Y.M.M., Fienberg, S.E., Holland, P.W. (1975) Discrete Multivariate Analysis: Theory and Practice, Massachusetts: MIT Press.
Boone, J., (1987) ‘Reliability of Urine Drug Testing’, JAMA, 258(18): 2587 – 2589.
Bryman, A., (2001) Social Research Methods, Oxford: Oxford University Press
Cook, R.F., Bernstein, A.D., Andrews, C.M. (1997) ‘Assessing Drug Use in the Workplace: A Comparison of Self-Report, Urinalysis, and Hair Analysis ’, NIDA Research Monograph Series, 167: 247-272.
Cox, T.J., Longwell, B. (1974) ‘Reliability of Interview Data Concerning Current Heroin Use from Heroin Addicts on Methadone’, The International Journal of the Addictions, 9(1): 161-165.
De Jong, C., Wish, E.D. (2000) ‘Is it Advisable to Urine Test Arrestees to Assess Risk of Re -arrest? A Comparison of Self-Report and Urinalysis -Based Measures of Drug-Use’, Journal of Drug Issues, 30(10): 133-146.
Ditton, J., Cooper, G.A.A., Scott, K.S., Allen, D.L., Oliver, J.S., Smith, I.D. (2000) ‘Hair Testing for “Ecstasy” (MDMA) in Volunteer Scottish Drug Users, Addiction Biology, 5: 207-213.
Fendrich, M., Xu, Y. (1994) ‘The Validity of Drug Use Reports from Juvenile Arrestees’, The International Journal of the Addictions, 29(8): 971-985.
Feucht, T.E., Stephens, R.C., Walker, M.L. (1994) ‘Drug Use Among Juvenile Arrestees: A Comparison of Self-Report, Urinalysis and Hair Assay ’, The Journal of Drug Issues, 24(1): 99-116.
Gray, T.A., Wish, E.D. (1999) ‘Correlates of Underreporting Recent Drug Use by Female Arrestees’, Journal of Drug Issues, 29(1): 91-106.
Greenfield, L., Bigelow, G.E., Brooner, R.K. (1995) ‘Validity of Intravenous Drug Abusers’ Self_reported Changes in HIV High-Risk Drug Use Behaviors’, Drug and Alcohol Dependence, 39: 91-98.
Hammersley, R., Marsland, L., & Reid, M. (2003) Substance Use by Young Offenders: the impact of normalisation of drug use in the early years of the 21st century', London: Home Office.
Harrison, L.N. (1997) ‘The Validity of Self-Reported Drug Use in Survey Research: An Overview and Critique of Research Methods’, NIDA Research Monograph Series, 167: 17-36
Harrison, L.D. (1995) ‘The Validity of Self-Reported Data on Drug Use’, The Journal of Drug Issues, 25(1): 91-111.
Hser, Y-I. (1997) ‘Self-Reported Drug Use: Results of Selected Empirical Investigations of Validity’, NIDA Research Monograph Series, 167: 320-343.
Magura, S., Kang, S-Y. (1997) ‘The Validity of Self-Reported Cocaine Use in Two High-Risk Populations’, NIDA Research Monograph Series, 167: 227-246.
Magura, S., Kang , S-Y. (1996) ‘Validity of Self-Reported Drug Use in High Risk Populations: A Meta-Analytical Review’, Substance Use & Misuse, 31(9): 1131-1153.
Magura, S., Kang, S-Y., Shapiro, J.L. (1995) ‘Measuring Cocaine Use by Hair Analysis Among Criminally Involved Youth’, The Journal of Drug Issues, 25(4): 683-701.
Surveillance & Society 2(4) 580
Manno, J.E. (1986) ‘Interpretation of Urinalysis Results’, in Hawks, R.L., Chiang, C.N. (1986) ‘Urine Drug Testing For Drugs of Abuse’, NIDA research Monograph, 73.
Measham, F., Aldridge, J. and Parker, H. (2001) Dancing on Drugs, London: Free Association Books.
Mieczkoski, T., Newel, R. (1997) ‘Patterns of Concordance Between Hair Assays and Urinalysis for Cocaine: Longitudinal Analysis of Probationers in Pinellas County, Florida’, NIDA Research Monograph Series, 167: 161-199.
Mieczkowski, T., Newel, R., (1993) ‘Comparing Hair and Urine Assays for Cocaine and Marijuana’, Federal Probation, 57(2): 59 – 67.
Mieczkoski, T., Barzelay, D., Gropper, B., Wish, E. (1991) ‘Concordance of Three Measures of Cocaine Use in an Arrestee Population: Hair, Urine and Self-Report’, Journal of Psychoactive Drugs, 23(3): 241-249.
Mieczkowski (1990) ‘The Accuracy of Self-Reported Drug Use: An Analysis of New Data’, in Weisheit, R., (ed) (1990) Drugs and Crime and the Criminal Justice System, Anderson: Cinncinatti.
Page, W.F., Davies, J.E., Ladner, R.A., Alfassa, J. (1977) ‘Urinalysis Screened vs Verbally Reported Drug Use: The Identification of Discrepant Groups’, The International Journal of the Addictions, 12(4): 439-450.
Parker, H., Aldridge, J. and Measham, F. (1998) Illegal Leisure: The normalization of adolescent recreational drug use, London and New York: Routledge.
Patton, D. J. (2004) ‘Normalizing the Deviant? A rrestees and the normalization of drug use’, British Journal of Community Justice 2(3): 61-72.
Patton, D. J. (2002) You Want the Truth? You Can't Handle the Truth: an exploration of the reporting practices of drug use among arrestees in the context of normalization. Unpublished PhD thesis, School of Law, University of Sheffield
Ramsay, M., Baker, P, Goulden, C, Sharp, C and Sondhi, A (2001) Drug Misuse Declared in 2000: Results from the British Crime Survey. London: Home Office.
Ramsay, M., Partridge, S. (1999) Drug Misuse Declared in 1998: Results from the British Crime Survey. London: Home Office.
Wish, E.D. & Gropper, B.A., (1990) ‘Drug Testing by the Criminal Justice System: Methods, Research and Applications’, in Tonry, M., & Wilson, J.Q. (1990) Drugs and Crime, London: University of Chicago Press.
Wish, E.D., Gray, T., Sushinsky, J., Yacoubian, G.S., Fitzgerald, N. (2000) ‘An Experiment to Enhance the Reporting of Drug Use by Arrestees ’, Journal of Drugs Issues, 30(1): 55-76.
Wish, E.D., Hoffman, J.A., Nemes, S. (1997) ‘The Validity of Self-Reports of Drug Use at Treatment Admission and at Followup: Comparisons with Urinalysis and Hair Assays’, NIDA Research Monograph Series, 167: 200-226.
Wish, E., Cuadrado, M., Martorana, J.A., (1986) ‘Estimates of Drug Use in Intensive Supervision Probationers’, Federal Probation, 4: 16-26.