R E S E A R C H A R T I C L E
Open Access
A cleanroom sleeping environment
’
s impact on
markers of oxidative stress, immune dysregulation,
and behavior in children with autism spectrum
disorders
Scott Faber
1*, Gregory M Zinn
2, Andrew Boggess
2, Timothy Fahrenholz
2, John C Kern II
3and HM Skip Kingston
2Abstract
Background:An emerging paradigm suggests children with autism display a unique pattern of environmental, genetic, and epigenetic triggers that make them susceptible to developing dysfunctional heavy metal and chemical detoxification systems. These abnormalities could be caused by alterations in the methylation, sulfation, and metalloprotein pathways. This study sought to evaluate the physiological and behavioral effects of children with autism sleeping in an International Organization for Standardization Class 5 cleanroom.
Methods:Ten children with autism, ages 3–12, slept in a cleanroom for two weeks to evaluate changes in toxin levels, oxidative stress, immune dysregulation, and behavior. Before and after the children slept in the cleanroom, samples of blood and hair and rating scale scores were obtained to assess these changes.
Results:Five children significantly lowered their concentration of oxidized glutathione, a biomarker of oxidative stress. The younger cohort, age 5 and under, showed significantly greater mean decreases in two markers of immune dysregulation, CD3% and CD4%, than the older cohort. Changes in serum magnesium, influencing neuronal regulation, correlated negatively while changes in serum iron, affecting oxygenation of tissues, correlated positively with age. Changes in serum benzene and PCB 28 concentrations showed significant negative correlations with age. The younger children demonstrated significant improvements on behavioral rating scales compared to the older children. In a younger pair of identical twins, one twin showed significantly greater improvements in 4 out of 5 markers of oxidative stress, which corresponded with better overall behavioral rating scale scores than the other twin.
Conclusions:Younger children who slept in the cleanroom altered elemental levels, decreased immune dysregulation, and improved behavioral rating scales, suggesting that their detoxification metabolism was briefly enhanced. The older children displayed a worsening in behavioral rating scale performance, which may have been caused by the mobilization of toxins from their tissues. The interpretation of this exploratory study is limited by lack of a control group and small sample size. The changes in physiology and behavior noted suggest that performance of larger, prospective controlled studies of exposure to nighttime or 24 hour cleanroom conditions for longer time periods may be useful for understanding detoxification in children with autism.
Trial registration:Clinical Trial Registration Number NCT02195401 (Obtained July 18, 2014).
Keywords:Autism, Behavioral rating scales, Cleanroom, Glutathione, Immune dysregulation, Oxidative stress
* Correspondence:[email protected] 1
Medicine, The Children’s Institute, 1405 Shady Avenue, Pittsburgh, PA 15217, USA
Full list of author information is available at the end of the article
Background
Children with autism spectrum disorders (ASDs) display dysfunction in the areas of expressive language produc-tion and quality, socializaproduc-tion ability, and control of ex-cessive repetitive thoughts and behaviors [1]. Over the past two decades, worldwide incidence and prevalence of these disorders have increased; however, scholarly opinion varies as to whether this rise is due to improved aware-ness, better age-related screening efforts, higher quality and quantity of diagnostic centers, an expansion of the spectrum definition, the types of study methods used, or a true escalation in the incidence and prevalence of autism [2-8]. Although much research has focused on finding a genetic cause of autism, it has not been successful in explaining a majority of the diagnoses. In children with ASDs, only 21% display genetic differences from the typic-ally sequenced human DNA [9]. Copy number variants and losses have been strongly associated with the develop-ment of autism [10], potentially indicating a mechanism for genetic/environmental interaction.
Effects of toxin exposure
A recent review noted the possible contributions of toxin exposure during gestation and early childhood to the development of autism [11]. Emerging literature on the exposome, which measures environmental, extracel-lular, and intracellular influences on the expression of the genome, strongly suggests that adverse neurological outcomes can be created by pre- and postnatal exposure to toxins [12]. With the lack of success in finding a purely genetic cause for autism, an emerging paradigm suggests that one of the causes of the increased preva-lence of ASDs could be difficulties in heavy metal and chemical detoxification [13]. Multiple studies have previ-ously correlated proximity to coal fired power plants, pesticide-rich agricultural fields, known toxic chemical sites, and traffic-related air pollution with the prevalence of ASDs [14-18]. It has been hypothesized that difficul-ties in detoxification can cause oxidative stress [19-23] and immune dysregulation [24-28], leading to or exacer-bating ASDs phenotypic presentation [29,30].
Exposure to environmental toxins, including heavy metals and chemicals, have been shown to negatively affect systems of detoxification involving glutathione [31-33] and metallothionein [34,35], of which both zinc and selenium are key cofactors [36]. Glutathione is the central antioxidant responsible for environmental toxin detoxification [37] and has been used as a biomarker of oxidative stress to evaluate the methylation and sulfation systems [38,39]. The metallothionein system is also ne-cessary for heavy metal detoxification [40] and can be assessed by the plasma zinc/serum copper ratio [35,41]. Studies have shown that total glutathione, reduced/oxi-dized glutathione ratio, and zinc/copper ratio are often
lower in children with ASDs [35,38,39,41]. Lower amounts of total glutathione, triggered by increased environmental toxin exposure, have been shown to also affect the im-mune system of children with autism, as evidenced by lower natural killer (NK) cell activity [42].
Difficulties in detoxification of heavy metals and che-micals can lead to autoimmunity [43,44] and immune dysregulation [24,25,27]. Forms of autoimmunity which use NK cells to attack brain tissue [45] may contribute to the under-connectivity between distant areas of the brains of children with autism [46]. Certain markers of immunological regulation and function [47-49], such as the T cell helper/suppressor (CD4:CD8) ratio and CD4% [50], are indicative of dysregulated innate and humoral immunity [51]. Both the CD4:CD8 ratio and CD4% have been shown to correlate with performance on the Aut-ism Behavior Checklist [50], indicating a link between immunological function and phenotypic presentation. In addition, altered cytokine profiles in the immune sys-tems of children with ASDs have been connected to be-havioral instabilities [52]. Immune dysfunction has been found in 15% to 60% of children with ASDs [53], and it was recently shown that, when compared with controls, children with ASDs exhibited greater evidence of in-creased detoxification difficulties, oxidative stress, and immune dysregulation [54].
Cleanrooms and detoxification
Given the emerging evidence connecting poor detoxifica-tion of environmental toxins to the biomedical and clinical presentation of ASDs, an intervention that temporarily de-creases environmental exposure may positively impact phenotypic presentation [55]. Concentrations of fine parti-cles and gaseous chemicals can be reduced in cleanrooms by using high efficiency particulate air (HEPA) filters and activated carbon. Individuals who have spent time in a cleanroom have presented reduced symptoms associated with immunological response to IgE mediated allergies and mold [56-58]. These unique allergic and immuno-logical responses cause the release of mast cell media-tors that can affect the central nervous system resulting in detrimental behavioral effects in certain children with autism [59].
removed from environmental toxicity before gains could be seen. These studies suggest that a cleanroom, which reduces the burden on detoxification systems, may lead to decreased oxidative stress and improved immuno-logical and neuroimmuno-logical functioning in children with autism. Multiple studies have demonstrated the import-ance of early treatment interventions [64-66]. It has been shown that younger children, under age 6, with autism display greater and more rapid response to intensive treatments, and there may be a crucial time interval for intervention before the end of early life developmental plasticity [64].
This study sought to evaluate the effects of a clean-room sleeping environment on toxin levels and markers of oxidative stress, immune dysregulation, and behav-ioral presentation in ten children with autism, 3 to 12 years of age. These effects were evaluated by quanti-fying changes in blood toxin concentrations, glutathione levels, and markers of immune function, and determin-ing the correlation between age and improvement in these markers.
Methods
After obtaining approval from the Institutional Review Board (IRB) of Duquesne University (Pittsburgh, PA, USA, IRB #09-131), the cleanroom was created and the study was conducted at The Children’s Institute (TCI, Pittsburgh, PA, USA). Before enrolling in the study, consent was obtained from either a parent or legal guardian, and a pictorial document explaining the study was reviewed with each child.
Subject enrollment and study design
Ten children, ages 3–12, with autistic disorder confirmed by a psychologist who is research certified to perform the Autism Diagnostic Observation Schedule (ADOS) [67] were recruited from the Neurodevelopmental Service of TCI. Eligible children had to have prior evidence of heavy metal and chemical toxicity and immune dysregulation seen through low plasma zinc/serum copper ratios and abnormal T and B cell subsets, respectively. Child #2 was unable to participate in the study because of the inability to complete a blood draw. The group intentionally con-tained two sets of identical twins (ages 5 and 12). Children were not eligible if they had severe behavioral dysregula-tion, uncontrolled seizure activity, or any other severe chronic medical condition, other than autism, that re-quired frequent management by general pediatricians.
After signing the consent and being provided oppor-tunity for child assent, each child and a parent spent two consecutive weeks sleeping in the cleanroom be-tween May and October 2010. During the day, the child and parent went about their normal activities and ther-apies. The child and parent arrived at TCI and spent
approximately ten hours each evening in the cleanroom while wearing silk or cotton clothes. A research assist-ant recorded each child’s sleep behaviors. The children and family’s adjustment to the study was monitored by a Family Advocate Psychologist who had no academic involvement in the study. Diet, medications, nutrients, and experiential services were held constant throughout the study.
Cleanroom design and classification
The cleanroom was designed and built at TCI in a modi-fied hospital room. Cleanroom modifications were made to the floors, walls, and ceiling tiles and the window was encased in a secondary transparent enclosure. HEPA fil-ters were mounted in each of the four air intakes in the room. A Model 7512 Second Wind Air Purifier (Buffalo, NY, USA) was placed in the room and set to the lowest setting. The room was furnished with ash furniture sealed with water soluble polyurethane from Stevens Woodworks (Allison Park, PA, USA). The cleanroom bedding was purchased from Naturepedic (Chagrin, OH, USA). An ultraviolet water purification system was in-stalled in the adjoining bathroom.
The cleanroom classification testing was performed using a Hach (Loveland, CO, USA) Met One HHPC-6 Handheld Airborne Particle Counter. Cleanroom classification was performed following International Organization for Standardization (ISO) standards using 0.5μm particles [68].
Blood draws, hair collection, and clinical testing
Blood and hair elemental quantification
Blood elemental analysis was conducted in serum, plasma, and RBCs. For both before and after the clean-room samples, two subsamples were prepared for each matrix and child. Each 0.2 gram subsample was digested with ARISTAR ULTRA nitric acid and ARISTAR ULTRA hydrochloric acid in a Milestone Inc. (Shelton, CT, USA) ETHOS 1 laboratory microwave system ac-cording to EPA Method 3052 [69]. Samples were stored in a cold room at 4°C until analysis. Total elemental ana-lysis was performed according to EPA Method 6020B [70]. An additional separate analysis was performed using Isotope Dilution Mass Spectrometry (IDMS), a component of EPA Method 6800 [71] for 9 selected ana-lytes (antimony, cadmium, chromium, copper, lead, mer-cury, molybdenum, selenium, and zinc) by spiking an isotopically enriched mixture of each analyte into the sample prior to microwave digestion. The analyses were performed using an Agilent (Santa Clara, CA, USA) 7700 Inductively Coupled Plasma-Mass Spectrometer operated in hydrogen, helium, and no gas modes. The instrument was tuned in all three analysis-modes in addition to determining the pulse/analog factor each day before analysis. An Agilent internal standard solution was used, and four replicates taken from each sub-sample. The data was taken from Agilent MassHunter software after analysis and exported into Microsoft Excel for further data processing. Standard Reference Material 1598a (Inorganic Constituents in Animal Serum, National Institute of Standards and Technology, Gaithersburg, MD, USA) was used to validate the sample preparation and analysis methods.
Hair elemental analysis was performed using EPA Method 3052 microwave sample preparation and EPA Method 6020B quantification. Sample preparation, ana-lysis, storage, and quantification procedures followed which were identical to the blood elemental analysis pro-cedure, except for using 0.1 gram per subsample. Certi-fied Reference Material GBW09101b (Shanghai, China), Human Hair, was used as quality control for sample preparation and analysis.
Organic toxin quantification
Organic compound quantification was performed on the volatile organic compounds (VOCs) benzene, toluene, and o-xylene using EPA Method 1624 [72] and selected PCBs (PCB-28, PCB-52, PCB-101, PCB-138, PCB-153, and PCB-180) using EPA Method 1625 [73]. Separate analyses were completed for VOC and PCB quantifica-tion, each requiring 200 μL of serum spiked with2H la-beled versions of each VOC or 13C labeled versions of each PCB. Solid-phase microextraction was performed on the headspace of the samples using a polydimethylsi-loxane/divinylbenzene fiber for VOCs and polyacrylate
fiber for the PCBs. An automated Gerstel (Linthicum, MD, USA) MultiPurpose Sampler II and Agilent 7890A Gas Chromatography and an Agilent 5975c quadrupole Mass Spectrometer were used for sample analysis and Agilent Chemstation for data analysis. Three independ-ent samples were prepared for each sample, both before and after the cleanroom, with one analysis performed on each.
Glutathione
The blood used for glutathione analysis was transported to Duquesne University on ice and shielded from light. The samples were aliquoted in an inert nitrogen atmos-phere and then centrifuged at 2,000 relative centrifugal force (RCF) at 4°C for 15 minutes. The separated RBCs were aliquoted under inert atmosphere conditions and placed into a−80°C freezer for storage.
For total glutathione (tGSH) analysis, 30 milligrams (mg) of RBCs were combined with a known amount of enriched GSH and 300 mgs of approximately 10,000 microgram gram−1(μg g−1) dithiothreitol for 20 minutes. Each sample was then treated with 1 mL of acetonitrile (ACN) to precipitate out the proteins, and the sample was centrifuged at 4°C at 5,000 RCF. The resulting supernatant was analyzed using an Agilent 6460 Liquid Chromatography-Tandem Mass Spectrometer (LC-MS/ MS). Sample preparation was performed in triplicate and analyses done in duplicate. Quantitation was per-formed using IDMS as described in EPA Method 6800.
For reduced (GSH) and oxidized (GSSG) glutathione analysis, known masses of RBC samples were treated with approximately 8,000μg g−1N-ethylmaleimide in an inert atmosphere environment while thawing. Each sample was then spiked with known amounts of enriched GSH and GSSG and equilibrated for approximately 30 minutes. The proteins were precipitated out of the samples by adding 1 mL ACN, and then centrifuged at 4°C at 5,000 RCF for 3 minutes. The resulting supernatant was evaporated off under vacuum, and the residue was redissolved in 40 mi-croliters (μL) of water after the addition of 120μL of ACN for LC-MS/MS analysis. Sample preparation was per-formed in triplicate with analysis in duplicate. Quantita-tion was performed using Speciated Isotope DiluQuantita-tion Mass Spectrometry (SIDMS), the other component of EPA Method 6800 [71], that corrected for the interconver-sion of the glutathione species.
Behavioral rating scales
Scale-2 (GARS-2) [77], Autism Treatment Evaluation Checklist (ATEC) [78], and Childhood Autism Rating Scale (CARS) [79]. The SCQ is used to assess the social interactions, language and communication aptitude, and stereotyped and repetitive behaviors of children with an autism spectrum disorder [80]. The PDDBI has multiple domains and composites that measure both adaptive and maladaptive behaviors [81], and the Autism Com-posite is calculated using selected domains. The total ABC is the summation of five subscales: (I) Irritability, Agitation, Crying; (II) Lethargy, Social Withdrawal; (III) Stereotypic Behavior; (IV) Hyperactivity, Noncompli-ance; and (V) Inappropriate Speech [76]. The results of these rating scales were recorded and pooled for statis-tical analysis.
Statistical analyses
All statistical analyses were performed using the R statis-tical software package. To investigate an overall clean-room impact, the n = 10 pre-cleanclean-room measurements were subtracted from the corresponding post-cleanroom measurements for each variable. Paired t-tests were used to identify whether the observed mean differences devi-ated significantly from zero. Two separate statistical ana-lyses were performed to investigate the relationship between measurement change and subject age. Prelimin-ary statistical analysis indicated the necessity to divide the entire study population into younger and older co-horts. An independent sample t-test was implemented for each variable to assess whether the average difference observed for subjects in the younger cohort, age 5 and under, was significantly different than for subjects in the older cohort, who were age 6 and older. A Pearson cor-relation between measurement difference and subject age was also computed for each variable.
Replicate analyses were performed for all chemical and elemental tests, allowing for confidence intervals to be used as a means of comparing difference in values. The rating scale and commercial laboratory measurements are single-measurement results and do not provide such statistical power. An independent samplest-test was used to determine whether the average of the pre-cleanroom replicate measurements for a particular subject differed sig-nificantly from the average of the post-cleanroom replicate measurements for that subject. The fact that funding con-straints allowed for only n = 10 subjects is the greatest stat-istical limitation of this study. This sample size provided relatively weak statistical power (as compared to larger sample sizes) for recognizing small or moderate differences when they exist. This issue, combined with the exploratory nature of this study and the fact that variables within a cat-egory are often correlated (as with the rating scale vari-ables), has prompted the authors to consider p-values at or
below the 0.05 significance level as indicative of a note-worthy result.
Results
Cleanroom classification
The measurements taken during the study showed that the cleanroom met criteria for an ISO Class 5 classifica-tion with an average of 1,292 particles 0.5μm m−3. Both the average of the five sampling locations and 95% upper confidence interval (CI) bound for a one sidedt-test were below the ISO Class 5 limit of 3,520 particles 0.5μm m−3. In comparison to an unmodified, adjacent room, the cleanroom had a 175 fold decrease in the number of 0.5μm particles.
Markers of environmental toxin exposure Elemental analysis of blood and hair
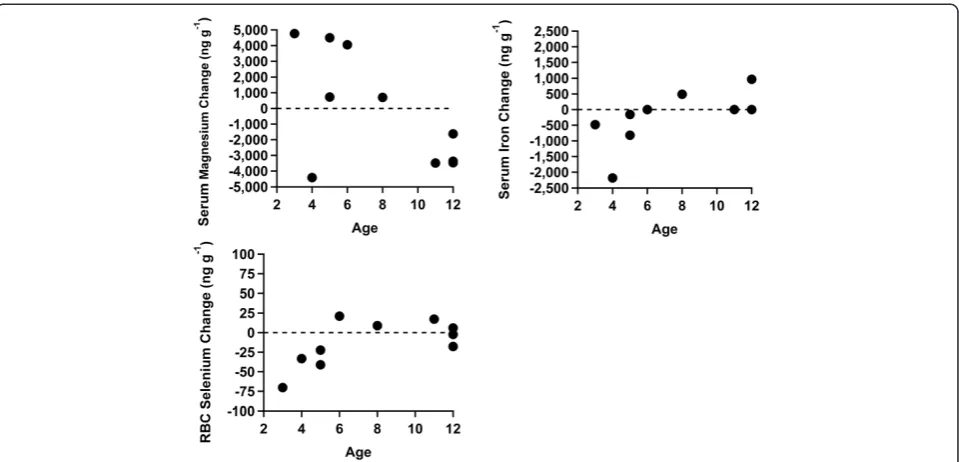
Significant results were observed when two types of age analyses were performed (Figures 1 and 2). Significant negative correlation with age was found for changes in serum magnesium (p = 0.047, r =− 0.64). Conversely, significant positive correlation with age was found for changes in serum iron (p = 0.050, r = 0.63). The changes in RBC selenium were nearly significantly positively cor-related with age (p = 0.051, r = 0.63). Additional statis-tical analysis on the age based cohorts indicated that the younger children, ages 5 and under, decreased both their RBC selenium (p = 0.011) and RBC zinc (p = 0.028) to a greater degree on average when compared to the older children, age 6 and older.
No significant changes or age correlations were ob-served for hair elemental concentrations. It was noted that each of the children had a unique profile of heavy metals in their hair as they displayed varying concentra-tions of aluminum, antimony, arsenic, cadmium, chro-mium, lead, manganese, mercury, nickel, and tin in their hair before beginning the study [82].
Analysis of organic toxins
Detectable quantities of benzene, toluene, and o-xylene were found in all serum samples at, or exceeding, national averages [83]. The change in serum benzene concentra-tion negatively correlated with age (p = 0.021, r =−0.71) as seen in Figure 3. One child in the older cohort signifi-cantly increased toluene by independent samples t-test. One child demonstrated a significant drop in o-xylene concentration by independent samples t-test. There were no significant differences in VOC concentrations in paired t-tests of pre- and post- findings for the set of ten children.
serum PCB 28 negatively correlated with age (p = 0.028, r =− 0.72) as seen in Figure 3. Two children increased PCB 28 concentrations significantly. The concentrations of PCB 52 decreased significantly in two children and in-creased significantly in two others by independent samples t-tests. No statistically significant changes or correlations were observed when PCB 101 and PCB 138 were detected and quantified, and PCB 101 was detected at the highest average concentration of all of the PCBs measured. In addition, PCBs 153 and 180 were not quantifiable in any of the ten children. There were no significant differences in PCB concentrations in paired t-tests of pre- and post-findings for the entire cohort. Overall, changes in serum
benzene and PCB 28 concentrations showed significant negative correlations with age, with the younger chil-dren showing the greatest post-cleanroom increase in concentration.
Markers of oxidative stress
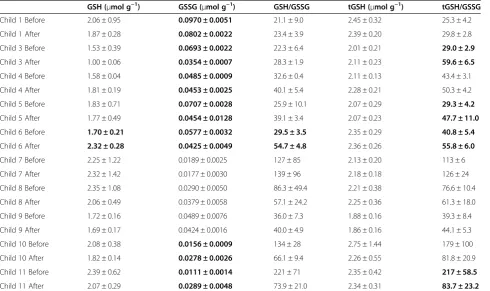
[image:6.595.59.539.88.319.2]The glutathione results are shown in Table 1. Five chil-dren significantly decreased their GSSG after the clean-room by independent samples t-test (Figure 4), four from the older cohort and one from the younger. This younger child also significantly increased GSH, reduced glutathione/oxidized glutathione ratio (GSH/GSSG), and total glutathione/oxidized glutathione (tGSH/GSSG) by
Figure 1Changes in serum magnesium, serum iron, and RBC selenium versus age.Younger children had a greater tendency to raise their serum magnesium than older children as it was negatively correlated with age (p = 0.047). There was a significant positive correlation between the change in iron and age (p = 0.050). There was a near significant positive correlation between age and change in RBC selenium concentration (p = 0.051). There are two points at 0 for age 12 for the serum iron change.
[image:6.595.59.539.562.705.2]independent samples t-test. A significant increase of tGSH/GSSG was seen in three children, one younger and two older, along with a significant decrease in tGSH/ GSSG ratio in one older child. All ten children displayed the same overall pattern- an increase, even if not statisti-cally significant, of GSH/GSSG was accompanied by a de-crease of GSSG or vice versa. No significant differences were observed using paired t-tests comparing pre-and post-measurements of glutathione species of the entire group. In all, five children improved significantly in at
least one marker of oxidative stress, with one belonging to the younger cohort.
Markers of immune dysregulation
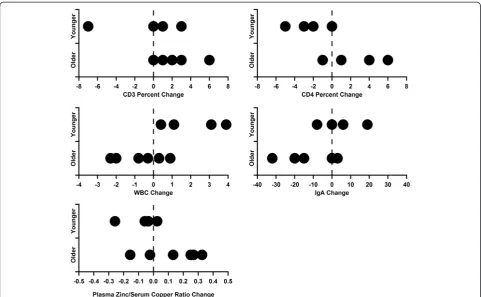
[image:7.595.59.539.89.208.2]Significant clinical results for several markers of immune regulation are summarized in Table 2. When separated into cohorts, the younger children significantly de-creased their CD3% (p = 0.036) and CD4% (p = 0.028) compared to the older children. Total white blood cell (WBC) count significantly increased in the younger
Figure 3The results of the differences for benzene and PCB-28 versus age.The results display a negative correlation with age for each chemical with p = 0.021 for benzene and p = 0.028 for PCB-28.
Table 1 The before and after red blood cell glutathione results (μmol g−1) according to EPA Method 6800 (n = 6, 95% CIs)
GSH (μmol g−1) GSSG (μmol g−1) GSH/GSSG tGSH (μmol g−1) tGSH/GSSG
Child 1 Before 2.06 ± 0.95 0.0970 ± 0.0051 21.1 ± 9.0 2.45 ± 0.32 25.3 ± 4.2
Child 1 After 1.87 ± 0.28 0.0802 ± 0.0022 23.4 ± 3.9 2.39 ± 0.20 29.8 ± 2.8
Child 3 Before 1.53 ± 0.39 0.0693 ± 0.0022 22.3 ± 6.4 2.01 ± 0.21 29.0 ± 2.9
Child 3 After 1.00 ± 0.06 0.0354 ± 0.0007 28.3 ± 1.9 2.11 ± 0.23 59.6 ± 6.5
Child 4 Before 1.58 ± 0.04 0.0485 ± 0.0009 32.6 ± 0.4 2.11 ± 0.13 43.4 ± 3.1
Child 4 After 1.81 ± 0.19 0.0453 ± 0.0025 40.1 ± 5.4 2.28 ± 0.21 50.3 ± 4.2
Child 5 Before 1.83 ± 0.71 0.0707 ± 0.0028 25.9 ± 10.1 2.07 ± 0.29 29.3 ± 4.2
Child 5 After 1.77 ± 0.49 0.0454 ± 0.0128 39.1 ± 3.4 2.07 ± 0.23 47.7 ± 11.0
Child 6 Before 1.70 ± 0.21 0.0577 ± 0.0032 29.5 ± 3.5 2.35 ± 0.29 40.8 ± 5.4
Child 6 After 2.32 ± 0.28 0.0425 ± 0.0049 54.7 ± 4.8 2.36 ± 0.26 55.8 ± 6.0
Child 7 Before 2.25 ± 1.22 0.0189 ± 0.0025 127 ± 85 2.13 ± 0.20 113 ± 6
Child 7 After 2.32 ± 1.42 0.0177 ± 0.0030 139 ± 96 2.18 ± 0.18 126 ± 24
Child 8 Before 2.35 ± 1.08 0.0290 ± 0.0050 86.3 ± 49.4 2.21 ± 0.38 76.6 ± 10.4
Child 8 After 2.06 ± 0.49 0.0379 ± 0.0058 57.1 ± 24.2 2.25 ± 0.36 61.3 ± 18.0
Child 9 Before 1.72 ± 0.16 0.0489 ± 0.0076 36.0 ± 7.3 1.88 ± 0.16 39.3 ± 8.4
Child 9 After 1.69 ± 0.17 0.0424 ± 0.0016 40.0 ± 4.9 1.86 ± 0.16 44.1 ± 5.3
Child 10 Before 2.08 ± 0.38 0.0156 ± 0.0009 134 ± 28 2.75 ± 1.44 179 ± 100
Child 10 After 1.82 ± 0.14 0.0278 ± 0.0026 66.1 ± 9.4 2.26 ± 0.55 81.8 ± 20.9
Child 11 Before 2.39 ± 0.62 0.0111 ± 0.0014 221 ± 71 2.35 ± 0.42 217 ± 58.5
Child 11 After 2.07 ± 0.29 0.0289 ± 0.0048 73.9 ± 21.0 2.34 ± 0.31 83.7 ± 23.2
[image:7.595.57.548.431.722.2]children and decreased in the older children (p = 0.031). The younger cohort tended to increase their IgA levels, while the older cohort tended to lower their IgA levels (p = 0.059). The clinical laboratory plasma zinc/serum copper ratio exhibited a tendency to increase in the older six children compared to the four younger children (p = 0.061). The results for these markers of immune dysregulation for the two cohorts are shown in Figure 5.
Behavioral rating scales
The before and after cleanroom rating scale results for all 10 children are summarized in Table 3 with significant correlation coefficients (r) and p-values listed in Table 4. The younger cohort demonstrated significant decreases in SCQ means (p = 0.025). The changes in SCQ versus age were also significant, with a positive correlation (r = 0.68, p = 0.030) seen in Figure 6. Additional positive correlations with age were found in the changes in Aut-ism Composite of the PDDBI (r = 0.64, p = 0.046) and the Sensory/Perceptual Approach Behaviors (SENSORY) subscale of the PDDBI (r = 0.64, p = 0.045). The Recep-tive/Expressive Social Communication Abilities Compos-ite (REXSCA/C) showed significant negative correlations with age (r =−0.66, p = 0.037), which indicates language
improvement in the younger cohort. None of the other domains or composites of the PDDBI produced significant results. The change in the total ABC by age of the ten children was nearly statistically significant with a p-value of 0.054 (r = 0.62). Furthermore, three of the five subscales of the ABC were significantly positively correlated with age (p = 0.034 for subscale III, p = 0.024 for subscale IV, and p = 0.035 for subscale V). The two remaining subscales of ABC showed no significant correlations.
There were no significant differences in rating scales results in the pairedt-test analyses of p and post- re-sults. The GARS-2, ATEC, and CARS produced no sta-tistically significant results for change or age correlation. In total, six scales, subscales, domains, or composites used as markers of ASD behavioral presentation agreed in finding a statistically significant correlation with age between pre-and post-cleanroom ratings. Of note, each of the four younger children improved on the SCQ scale. Of these four, two raised their GSH/GSSG ratio, with one significant by independent samplest-test.
Twins
The study contained two sets of identical twins, one younger and one older set. Children 6 and 8 were five-year-old females. Child 6 significantly improved on four out of five markers of oxidative stress seen in Table 1 (GSH, GSSG, GSH/GSSG, and tGSH/GSSG). This im-provement in oxidative stress was mirrored by a better performance in the rating scales SCQ and PDDBI; the subscales ATEC I, ATEC II, ABC I, ABC II, ABC V; GARS-2 Communication, Social Interaction, and Autism Index; and all of the maladaptive domains and compos-ites and the Autism Composite of the PDDBI (Table 3). The corresponding twin, Child 8, did not improve on any markers of oxidative stress and, likewise, did not im-prove performance on rating scales, subscales, compos-ites, and indexes.
[image:8.595.56.292.89.210.2]Children 3 and 4 were twelve-year-old male identical twins. Both children raised their GSH/GSSG, with Child 4 showing greater improvement. This disparity in im-provement was mirrored in better performance for Child 4 on many rating scales, subscales, and composites. Child 4 demonstrated better performance on the PDDBI, CARS, and SCQ; ATEC total and subscales; ABC total, I, and IV; Communication subscale of GARS-2; and the SENSORY, Social Pragmatic Problems, Semantic/Prag-matic Problems, Arousal Regulation Problems, Specific Fears, Aggressiveness, Social Approach Behavior do-mains along with the Repetitive, Ritualistic, and Prag-matic Problem Behaviors, Approach/Withdrawal, and Autism Composites of the PDDBI [82]. In both sets of identical twins, the child with the larger improvement in markers of oxidative stress showed the greater improve-ment in behavioral rating scales following the study.
Figure 4The before and after results for RBC oxidized glutathione for the ten children (n = 6, 95% CIs).Seven of the ten children decreased their mean red blood cell oxidized glutathione concentrations, with five of these decreases significant by independent samplest-test. Child #2 was unable to participate in the study.
Table 2 Statistically significant changes and trends in the commercial laboratory results of mean differences between age groups when a cutoff is applied separating children ages 3–5 from children ages 6–12
Commercial laboratory variable
Mean change younger cohort
Mean change older cohort
p-value
CD3% −2.75 2.33 0.036
CD4% −2.50 1.67 0.028
WBC 2.13 −0.70 0.031
IgA 4.25 −13.17 0.059
[image:8.595.57.291.640.733.2]Figure 5Results of the clinical laboratory differences for CD3%, CD4%, WBCs, IgA, and zinc/copper ratio.When applying a cutoff at age 5, separating the younger four children from the older six children, significant decreases were seen for CD3% (p = 0.036) and CD4% (p = 0.028), and a significant increase was seen for WBC (p = 0.031). Trends for increased IgA (p = 0.059) in the younger cohort and elevated zinc/copper ratios (p = 0.061) in the older cohort were present. For CD3% change, two points overlap at +2 in the older cohort. For CD4% change, two points overlap at both–1 and +1 in the older cohort. In the older cohort for IgA change, two points overlap at–15.
Table 3 Child number, age, and rating scale results for the children who experienced the cleanroom sleeping environment
Child number
Age ADOS composite
SCQ Autism composite (PDDBI)
Total ABC Total ATEC CARS Autism index (GARS-2)
Before Before After Before After Before After Before After Before After Before After
1 6 17 22 24 57 54 38 34 51 60 36 34 85 91
3 12 13 20 27 76 84 92 118 85 96 47 49.5 119 126
4 12 15 28 30 73 75 69 91 101 96 46.5 48 106 117
5 11 14 25 24 61 59 65 50 59 44 40 43 100 103
6 5 14 27 20 50 44 12 13 62 58 34 36.5 79 74
7 8 16 30 30 65 66 116 128 95 108 51 50.5 112 115
8 5 12 21 20 45 47 13 14 55 54 33.5 33 64 81
9 4 16 23 14 41 39 57 27 55 57 39 26.5 82 64
10 3 17 26 23 57 53 64 42 52 59 39 38 94 87
11 12 14 13 13 41 42 5 3 51 49 21 22 76 85
[image:9.595.59.541.548.725.2]Discussion
During this study ten children with ADOS certified aut-ism slept in a hospital cleanroom for a two week period. The cleanroom maintained ISO Class 5 certification, which minimized the nighttime exposure of both chil-dren and parents to heavy metals and VOCs. Given the emergent data linking exposure to environmental toxins with autism etiology, experiencing a cleanroom environ-ment during sleep was hypothesized to begin the process of detoxification by mobilizing heavy metals and chemi-cals into the blood and hair.
Five children significantly lowered their GSSG concen-trations in RBCs, the component of blood with the highest glutathione concentration [84]. The decrease in GSSG concentrations could indicate a reduction of oxidative stress, suggesting an increased ability to eliminate inflam-mation, prevent infections, and detoxify environmental
[image:10.595.57.291.114.237.2]toxins [39]. Three children raised their tGSH/GSSG ratio, an improvement in an indicator of the balance of glutathi-one species [38], which was driven by a decrease in GSSG. In all ten children, an inverse relationship was observed between the change in glutathione ratios, tGSH/GSSG and GSH/GSSG, and the change in GSSG concentration. High GSH/GSSG ratios preserve the necessary reducing environment inside of cells [85]; abnormally low GSH/ GSSG ratios may indicate an inadequacy of glutathione re-ductase [39]. Numerous studies have noted the multiple functions regulated by the redox balance of GSH/GSSG [33,39,86]. Decreases in GSSG may have been the result of improved transulfuration reducing the demand for adeno-sine [38], the nucleoside that prevents oxidative damage [87,88].
[image:10.595.57.538.470.693.2]The younger cohort showed significantly greater de-creases in RBC zinc and selenium concentrations than the older cohort. The younger children may have moved selenium and zinc more rapidly from red blood cells to tissues, increasing metalloprotein functioning more than the older children. In addition, serum magnesium changes were significantly negatively correlated with age, increas-ing in concentration in the younger children. Magnesium is a critical micronutrient that is essential in the mainten-ance of the calcium/magnesium flow across neuronal cell membranes [89]. It also plays a key role in enzymes re-lated to ATP and nucleic acid metabolism [90]. Proper brain development and homeostasis require magnesium resulting from copper-zinc superoxide dismutase activity [91]. When given as a supplement, magnesium has been shown to have a calming effect on the behavior of children
Table 4 Statistically significant difference correlations comparing child age and difference in rating scale scores
Rating scale r p-value
SCQ 0.68 0.030
PDDBI Autism composite 0.64 0.046
Total ABC 0.62 0.054
ABC III 0.67 0.034
ABC IV 0.70 0.024
ABC V 0.67 0.035
PDDBI REXSCA/C −0.66 0.037
PDDBI SENSORY 0.64 0.045
The correlations and p-values are shown for each significant variable.
and adults [92,93], which may explain the link between in-creased serum concentrations and improved behavioral presentations observed in this study. Additionally, iron concentration changes correlated positively with age. The younger children decreased and the older children in-creased their respective concentrations. Iron is critical for erythrocyte production and the promotion of oxygenation of tissues; its effects on metabolism depend on local con-centration [94]. At higher levels, though, iron can cause an excessive production of reactive oxygen species, digest-ive problems, vomiting, and the alteration of other closely related elements such as zinc, copper, and calcium [95]. The observed positive age correlation in serum iron may be explained by a faster upregulation in the metallothio-nein system of the younger children. This upregulation would lead to an increased need for erythrocyte produc-tion to enhance oxygen distribuproduc-tion to tissues, depleting serum iron. Hair selenium concentrations tended to cor-relate negatively with age. The younger children had either increases or small decreases in their hair selenium con-centrations compared to the older ones. The increased re-lease of selenium in the hair in the younger children may have been secondary to increased absorption of selenium. Significant changes in hair concentrations of elements may have required a longer period of exposure to clean-room conditions.
Prior to exposure to the cleanroom, VOCs and PCBs were quantified at concentrations above the national av-erages for adolescents [83] in many of the children. Out of the ten participants, eight decreased mean serum ben-zene, six increased mean serum toluene and five in-creased serum xylene, although none significantly. One possible explanation for these results is that, throughout the study, VOCs were mobilized from tissues into the serum at varying rates. In this scenario, benzene would be mobilized and released from the body first, leading to decreased serum concentrations. Toluene and o-xylene, however, could require more time to mobilize and result in the tendency for increased serum concentrations fol-lowing the two week exposure to the cleanroom. Like-wise, mean PCB-28 concentrations rose in six out of seven children, which significantly negatively correlated with age, with three children falling below the analytical quantification limit. This result is consistent with the hy-pothesis of the cleanroom beginning the process of mobilization of PCB-28 from tissue to serum, but re-quiring more time for elimination from the serum.
Following exposure to the cleanroom environment, the children demonstrated changes in markers of immune system functioning. These changes indicate a decrease of T cell subtypes instructing B cells to make antibodies. Notably, the younger children decreased CD3% (total T cell percent) and CD4% (total helper T cell percent) sig-nificantly more than the older cohort. This data provides
evidence that the cleanroom may have decreased dysregu-lation of the immune system, especially in the younger children. B cells promote immunoglobulin synthesis and are regulated by CD4 cells. The observed decrease in CD4% may have lessened cross reactive antibody production in the younger children, leading to a brief period of decreased brain inflammation. This is one possible explanation of the significant, but transient, improvement seen in the behavioral rating scale perfor-mances of the younger cohort.
glutathione, and immune markers observed in this study provide support for physiological change driving the behavioral improvements in the younger children.
One of the unique results of this study involved the re-sponses of two sets of identical twins and the manner in which changes in glutathione species corresponded with behavioral rating scale results. In both sets, one twin demonstrated greater improvement in oxidative stress, as evidenced by glutathione markers, and corresponding greater improvement in behavioral rating scale scores. The GSH/GSSG ratio is a critical biomarker for deter-mining healthy functioning of the methylation system in children with autism [96]. In the 5-year-old female iden-tical twin pair, the twin who raised her GSH/GSSG ratio also performed better on two behavioral rating scales, the SCQ and PDDBI. Notably, this female twin displayed the greatest improvement of oxidative stress in the study, significantly lowering GSSG and increasing GSH, tGSH/ GSSG, and GSH/GSSG values. In the older male identical twin pair, both children worsened on the behavioral scales, but the twin with greater GSH/GSSG ratio improvement displayed less worsening on the SCQ and PDDBI. Despite identical home settings and genomes, it was found in both sets that each twin responded uniquely to sleeping in the cleanroom, displaying varying degrees of change in GSH/ GSSG levels and behavioral rating scale performance. These differences suggest that still unknown epigenetic mechanisms mediated the varying results between the twins in the study. This study provides further support to the assertion of a relationship between glutathione biomarkers and behavioral rating scores in children with autism.
Conclusions
In this study, ten children with ADOS certified autism spent two weeks sleeping in a cleanroom. The overall pat-tern of results indicates greater improvements in immune dysregulation and behavior in the younger children, age 5 and under. Half of the children significantly decreased their oxidative glutathione concentrations in addition to improving other glutathione markers of oxidative stress. The relationship between GSH/GSSG and the identical twins’ behavioral performances, the opposite movements of serum iron and magnesium compared to age, and the tendency for the younger children to reduce their CD3% and CD4% all suggest the possibility of a significant physiological role for the cleanroom in explaining some of the behavioral changes. Younger children performed bet-ter on rating scales afbet-ter their two week exposure, while the older children performed slightly worse on rating scales. Psychological issues, such as greater attachment to-wards the parent in the cleanroom, may explain some of this difference; however, the noted biological differences in how the younger children performed versus older
children suggest that the cleanroom may have had a more than psychological effect. The children only slept or stayed for approximately ten hours a night in a cleanroom for two weeks; yet, significant changes in markers of oxidative stress, immune dysregulation, and behavior were ob-served. In addition, an age correlated difference in detoxi-fication physiology is suggested by the results. At the age of 6, a significant difference tended to occur in the direc-tion of change for some elemental nutrients (iron, magne-sium, selenium, and zinc), organic toxicants (benzene and PCB 28), and immune markers (CD3% and CD4%). The younger children may have started their detoxification process faster or had less to detoxify, thus explaining their significant improvement in global rating scales (SCQ, PDDBI, and ABC) compared with the older children. The differential response to the cleanroom by the identical twins suggests that epigenetic changes may be playing a role in affecting responses to a detoxifying environment. Interpretation of this prospective cohort study is limited by the lack of a control group and small sample size. The exploratory nature of the study supported not performing Bonferroni correction and the use of a p value of 0.05 for significance. The performance of a controlled study of 24 hour per day cleanroom exposure for children with autism appears to be an appropriate next step, given the physiologic changes from the limited exposure to a clean-room environment noted in this study.
Abbreviations
ABC:Aberrant Behavior Checklist; ACN: Acetonitrile; ADOS: Autism Diagnostic Observation Scale; AIT: Applied Isotope Technologies; ASD: Autism spectrum disorder; ATEC: Autism Treatment Evaluation Checklist; CARS: Childhood Autism Rating Scale; CD3%: Total T cell percent; CD4%: Helper T cell percent; CD4/CD8: Helper/suppressor ratio; CI: Confidence interval; GARS-2: Gilliam Autism Rating Scale-2; GSH: Reduced glutathione; GSH/GSSG: Reduced glutathione/oxidized glutathione ratio; GSSG: Oxidized glutathione; HEPA: High efficiency particulate air; IDMS: Isotope Dilution Mass Spectrometry;
IRB: Institutional Review Board; ISO: International Organization for
Standardization; LC-MS/MS: Liquid chromatography-tandem mass spectrometer; mg: Milligram; NK: Natural killer; PCB: Polychlorinated biphenyl; PDDBI: PDD Behavioral Inventory; r: correlation coefficient; RBC: Red blood cell; RCF: Relative centrifugal force; REXSCA/C: Receptive/Expressive Social Communication Abilities Composite; SCQ: Social Communication Questionnaire;
SENSORY: Sensory/Perceptual Approach Behaviors; SIDMS: Speciated Isotope Dilution Mass Spectrometry; TCI: The Children’s Institute; tGSH: Total glutathione; tGSH/GSSG: Total glutathione/oxidized glutathione ratio;μg g −1: Microgram gram−1;μL: Microliter;μm: Micrometer; VOC: Volatile organic
compound; WBC: White blood cell.
Competing interests
HMSK declares that he has invented and/or patented several of the measurement techniques used in this study and has licensed them to Applied Isotope Technologies. He is a part owner of AIT, a company that performs or enables others to perform chemical measurements. AIT did not measure any samples in this study and all measurements were done at laboratories other than AIT. The remaining authors declare that they have no competing interests.
Authors’contributions
data, and assisted in the writing of the manuscript. AB completed the VOC and PCB analyses along with helping with manuscript preparation. TF preprocessed the blood and carried out the glutathione analyses. JCK II performed all statistical analyses. HMSK, a co-principle investigator, assisted in study design, specified the cleanroom materials, and conceptualized and supervised the analytical testing. SF, GMZ, AB, TF, JCK II, and HMSK all reviewed and edited the manuscript. All authors read and approved the final manuscript.
Acknowledgements
Financial support was provided by the United States Health Resources and Services Administration and the Alcoa Foundation. The cleanroom was constructed by Burt Hill. The authors thank the administration and staff of The Children’s Institute including David Miles; Dr. Maryanne Henderson; Dr. Roxann Gross; Tim Bittner; Jody Mulvihill; Sandra O’Donnell, RN; Helene Conway-Long; Dr. Heather Ufberg; Dr. Jennifer Benger; Maureen McAniff; Lori Brenner; Tom Brown; Sean Wroblewski; Julie Young; Bertha Amadikwa; Marilyn Hetrick; Karen Liljequist; Janet Hoffman; and Jane Keim. Becky Pekar, RN, performed all of the blood draws and collected the hair samples. Jerry Monagan helped in determining cleanroom design, parameters, and equipment. Dr. Mizan Rahman assisted in method development for elemental analysis. Matt Pamuku and Applied Isotope Technolgies supplied the isotopic reagents and IDMS and SIDMS software. Hemasudha Chatragadda and Yosip Pineda Vargas aided with the glutathione analysis. Antonette Cabauatan helped in the preparation of graphics. Dan Bodnar, Dave Hardesty, and Lance Crosby were responsible for instrument maintenance. Agilent Technologies, Milestone, and Gerstel supplied instrumentation. Clinical laboratory testing was completed by Quest Diagnostics. The Duquesne University Department of Chemistry and Biochemistry provided the facilities necessary to complete the analytical testing. S.F. would like to thank his wife, Marianne Faber, MOTR/L, for her understanding and support.
Author details 1
Medicine, The Children’s Institute, 1405 Shady Avenue, Pittsburgh, PA 15217, USA.2Chemistry and Biochemistry, Duquesne University, 600 Forbes Avenue,
Pittsburgh, PA 15282, USA.3Mathematics and Computer Science, Duquesne University, 600 Forbes Avenue, Pittsburgh, PA 15282, USA.
Received: 20 May 2014 Accepted: 19 February 2015
References
1. Baird G, Cass H, Slonims V. Diagnosis of autism. BMJ. 2003;327:488–93. 2. Wing L, Potter D. The epidemiology of autistic spectrum disorders: is the
prevalence rising? Ment Retard Dev Disabil Res Rev. 2002;8(3):151–61. 3. Fombonne E. Epidemiologic trends in rates of autism. Mol Psychiatry.
2002;7 Suppl 2:S4–6.
4. Charman T. The prevalence of autism spectrum disorders. Eur Child Adolesc Psychiatry. 2002;11(6):249–56.
5. Fombonne E. Epidemiological surveys of autism and other pervasive developmental disorders: an update. J Autism Dev Disord. 2003;33(4):365–82. 6. Fombonne E. The prevalence of autism. J Am Med Assoc. 2003;289(1):87–9. 7. Williams JG, Higgins JPT, Brayne CEG. Systematic review of prevalence
studies of autism spectrum disorders. Arch Dis Child. 2006;91(1):8–15. 8. Baron-Cohen S, Scott FJ, Allison C, Williams J, Bolton P, Matthews FE, et al.
Prevalence of autism-spectrum conditions: UK school-based population study. Br J Psychiatry. 2009;194:500–9.
9. Shen Y, Dies KA, Holm IA, Bridgemohan C, Sobeih MM, Caronna EB, et al. Clinical genetic testing for patients with autism spectrum disorders. Pediatrics. 2010;125(4):e727–35.
10. Pinto D, Pagnamenta AT, Klei L, Anney R, Merico D, Regan R, et al. Function impact of global rare copy number varients. Nature. 2010;466(7304):368–72. 11. Landrigan PJ, Lambertini L, Birnbaum LS. A research strategy to discover the
environmental causes of autism and neurodevelopmental disabilities. Environ Health Perspect. 2012;120(7):a258–60.
12. Vrijheid M, Slama R, Robinson O, Chatzi L, Coen M, Hazel P, et al. The Human Early-Life Exposome (HELIX): project rationale and design. Environ Health Perspect. 2014;122(6):535–44.
13. Lathe R. Autism, brain, and environment. London: Jessica Kingsley Publishers; 2006.
14. Palmer RF, Blanchard S, Stein Z, Mandell D, Miller C. Environmental mercury release, special education rates, and autism disorder: an ecological study of Texas. Health Place. 2006;12(2):203–9.
15. Palmer RF, Blanchard S, Wood R. Proximity to point sources of environmental mercury release as a predictor of autism prevalence. Health Place. 2009;15(1):18–24. 16. Roberts EM, English PB, Grether JK, Windham GC, Somberg L, Wolff C.
Maternal residence near agricultural pesticide applications and autism spectrum disorders among children in the California Central Valley. Environ Health Perspect. 2007;115(10):1482–9.
17. Bertrand J, Mars A, Boyle C, Bove F. Prevalence of autism in a United States population: the brick township, New Jersey, investigation. Pediatrics. 2001;108(5):1155–61.
18. Volk HE, Lurmann F, Penfold B, Hertz-Picciotto I, McConnell R. Traffic-related air pollution, particulate matter, and autism. JAMA Psychiatry. 2013;70(1):71–7. 19. Yee S, Choi BH. Oxidative stress in neurotoxic effects of methylmercury
poisoning. Neurotoxicology. 1996;17(1):17–26.
20. Flora SJ. Arsenic-induced oxidative stress and its reversibility following combined administration of N-acetylcysteine and meso 2,3-dimercaptosuccinic acid in rats. Clin Exp Pharmacol Physiol. 1999;26(11):865–9.
21. Flora SJS, Pande M, Kannan GM, Mehta A. Lead induced oxidative stress and its recovery following co-administration of melatonin or N-acetylcysteine during chelation with succimer in male rats. Cell Mol Biol. 2004;50:OL543–51. 22. Hiura TS, Kaszubowski MP, Li N, Nel AE. Chemicals in diesel exhaust particles
generate reactive oxygen radicals and induce apoptosis in macrophages. J Immunol. 1999;163(10):5582–91.
23. Bhadauria S, Flora SJS. Response of arsenic-induced oxidative stress, DNA damage, and metal imbalance to combined administration of DMSA and monoisoamyl-DMSA during chronic arsenic poisoning in rats. Cell Biol Toxicol. 2007;23(2):91–104.
24. Sterzl I, Prochazkova J, Hrda P, Bartova J, Matucha P, Stejskal VDM. Mercury and nickel allergy: risk factors in fatigue and autoimmunity.
Neuroendocrinol Lett. 1999;20:221–8.
25. Kempuraj D, Asadi S, Zhang B, Manola A, Hoga J, Peterso E, et al. Mercury induces inflammatory mediator release from human mast cells. Journal of Neuroinflammation 2010, 7(20).
26. Calderon-Garciduenas L, Reed W, Maronpot RR, Henriquez-Roldan C, Delgado-Chavez R, Calderon-Garciduenas A, et al. Brain inflammation and Alzheimer’s-like pathology in individuals exposed to severe air pollution. Toxicol Pathol. 2004;32(6):650–8.
27. Havarinasab S, Hultman P. Organic mercury compounds and autoimmunity. Autoimmun Rev. 2005;4(5):270–5.
28. Calderon-Garciduenas L, Solt AC, Henriquez-Roldan C, Torres-Jardon R, Nuse B, Herritt L, et al. Long-term Air pollution exposure is associated with neuroinflammation, an altered innate immune response, disruption of the blood–brain barrier, ultrafine particulate deposition, and accumulation of amyloidβ-42 andα-synuclein in children and young adults. Toxicol Pathol. 2008;36(2):289–310.
29. Rossignol DA, Frye RE. Mitochondrial dysfunction in autism spectrum disorders: a systematic review and meta-analysis. Mol Psychiatry. 2012;17:290–314. 30. Rossignol DA, Frye RE. A review of research trends in physiological
abnormalities in autism spectrum disorders: immune dysregulation, inflammation, oxidative stress, mitochondrial dysfunction and environmental toxicant exposures. Mol Psychiatry. 2012;17:389–401. 31. Adams JB, Baral M, Geis E, Mitchell J, Ingram J, Hensley A, et al. The severity
of autism is associated with toxic metal body burden and red blood cell glutathione levels. J Toxicol. 2009;2009(532640):1–7.
32. Stringari J, Nunes AKC, Franco JL, Bohrer D, Garcia SC, Dafre AL, et al. Prenatal methylmercury exposure hampers glutathione antioxidant system ontogenesis and causes long-lasting oxidative stress in the mouse brain. Toxicol Appl Pharmacol. 2008;227(1):147–54.
33. Geier DA, Kern JK, Garver CR, Adams JB, Audhya T, Geier MR. A prospective study of transsulfuration biomarkers in autistic disorders. Neurochem Res. 2009;34(2):386–93.
34. Vergani L, Cristina L, Paola R, Luisa AM, Shyti G, Edvige V, et al. Metals, metallothioneins and oxidative stress in blood of autistic children. Res Autism Spectr Disord. 2011;5(1):286–93.
35. Walsh WJ, Usman A, Tarpey J, Kelly T. Metallothionein and autism [monograph]. 2nd ed. Naperville, IL: Pfeiffer Treatment Center; 2002. 36. Jacob C, Maret W, Vallee BL. Ebselen, a selenium-containing redox drug,
37. Chauhan A, Chauhan V. Oxidative stress in autism. Pathophysiology. 2006;13(3):171–81.
38. James SJ, Cutler P, Melnyk S, Jernigan S, Janak L, Gaylor DW, et al. Metabolic biomarkers of increased oxidative stress and impaired methylation capacity in children with autism. Am J Clin Nutr. 2004;80(6):1611–7.
39. James SJ, Melnyk S, Jernigan S, Cleves MA, Halsted CH, Wong DH, et al. Metabolic endophenotype and related genotypes are associated with oxidative stress in children with autism. Am J Med Genet B Neuropsychiatr Genet. 2006;141B(8):947–56.
40. Aschner M. The functional significance of brain metallothioneins. FASEB J. 1996;10(10):1129–36.
41. Faber S, Zinn GM, Kern II JC, Kingston HMS. The plasma zinc/serum copper ratio as a biomarker in children with autism spectrum disorders. Biomarkers. 2009;14(3):171–80.
42. Vojdani A, Mumper E, Granpeesheh D, Mielke L, Traver D, Bock K, et al. Low natural killer cell cytotoxic activity in autism: the role of glutathione, IL-2 and IL-15. J Neuroimmunol. 2008;205(1–2):148–54.
43. Vojdani A, Pangborn JB, Vojdani E, Cooper EL. Infections, toxic chemicals and dietary peptides binding to lymphocyte receptors and tissue enzymes are major instigators of autoimmunity in autism. Int J Immunopathol Pharmacol. 2003;16(3):189–99.
44. Singh VK. Phenotypic expression of autoimmune autistic disorder (AAD): a major subset of autism. Ann Clin Psychiatry. 2009;21(3):148–61. 45. Vargas DL, Nascimbene C, Krishnan C, Zimmerman AW, Pardo CA.
Neuroglial activation and neuroinflammation in the brain of patients with autism. Ann Neurol. 2005;57(1):67–81.
46. Kana RK, Keller TA, Minshew NJ, Just MA. Inhibitory control in high-functioning autism: decreased activation and underconnectivity in inhibition networks. Biol Psychiatry. 2007;62(3):198–206.
47. Zimmerman AW. The immune system. In: Bauman ML, Kemper TL, editors. The neurobiology of autism. 2nd ed. Baltimore: The Johns Hopkins University Press; 2005. p. 371–86.
48. Ashwood P, Wills S, Van De Water J. The immune response in autism: a new frontier for autism research. J Leukoc Biol. 2006;80(1):1–15.
49. Gupta S, Aggarwal S, Heads C. Brief report: dysregulated immune system in children with autism: beneficial effects of intravenous immune globulin on autistic characteristics. J Autism Dev Disord. 1996;26(4):439–52.
50. Denney DR, Frei BW, Gaffney GR. Lymphocyte subsets and interleukin-2 re-ceptors in autistic children. J Autism Dev Disord. 1996;26(1):87–97. 51. Faber S, Kobelak C, Caminos C. Immune dysregulation in a cohort of
children with autism spectrum disorders. In: Pediatric Academic Societies' Annual Meeting: May 5–8 2007; Toronto, Canada. 2007.
52. Ashwood P, Krakowiak P, Hertz-Picciotto I, Hansen R, Pessah I, Van De Water J. Elevated plasma cytokines in autism spectrum disorders provide evidence of immune dysfunction and are associated with impaired behavioral outcome. Brain Behav Immun. 2011;25(1):40–5.
53. Pardo CA, Vargas DL, Zimmerman AW. Immunity, neuroglia and neuroinflammation in autism. Int Rev Psychiatry. 2005;17(6):485–95. 54. Faber S, Zinn GM, Fahrenholz T, Boggess A, Kern JC, Kingston HMS. A
comparison study of inorganic and organic compounds in children with autism and controls. In: International Meeting for Autism Research: May 17–19 2012; Toronto, Canada. 2012.
55. Miller CS. Toxicant-induced loss of tolerance-an emerging theory of disease. Environ Health Perspect. 1997;105(S-2):445–53.
56. Platts-Mills TAE, Vaughan JW, Carter MC, Woodfolk JA. The role of intervention in established allergy: avoidance of indoor allergens in the treatment of chronic allergic disease. J Allergy Clin Immunol. 2000;106(5):787–804. 57. Sanda T, Yasue T, Oohash M, Yasue A. Effectiveness of house dust-mite
allergens avoidance through clean room therapy in patients with atopic dermatitis. J Allergy Clin Immunol. 1992;89(3):653–7.
58. Anyanwu EC, Campbell AW, Jones J, Ehiri J. The neurological significance of abnormal natural killer cell activity in chronic toxigenic mold exposures. Sci World J. 2003;3:1128–37.
59. Theoharides TC, Zhang B. Neuro-inflammation, blood–brain barrier, seizures and autism. Journal of Neuroinflammation 2011;8(168).
60. Slimak KM. Autistic symptoms caused by chemicals in food, indoor air and mold; and using avoidance strategies to eliminate symptoms in children suffering from severe autism. In: Seminar for environmental avoidance strategies in severe autism: March 13–14 2002; Jackson, Michigan. 2002. 61. Slimak KM. In 45 autistic children sharp decreases in autistic symptoms follow elimination of problem foods, volatile organic compounds, plastics,
resins, and molds. In: Second International Conference on Advances in Treatment of Autistic Spectrum Disorders, Opening Doors–New Biological Treatment Alternatives, Sociedad Venezolana para Niños y Adultos Autistas (SOVENIA): February 15–16 2002; Caracus, Venezuela. 2002.
62. Slimak KM. Effect of removal of low levels of volatile organic compounds on severe autistic behaviors in children. In: Annual Conference of the Association for Science in the Public Interest: May 31-June 2 2001; Virginia Commonwealth University, Richmond, Virginia. 2001.
63. Slimak KM. Reduction of autistic traits following dietary intervention and elimination of exposure to environmental substances. In: Proceedings of 2003 International Symposium on Indoor Air Quality and Health Hazards. vol. 2. Tokyo, Japan. 2003. p. 206–16.
64. Rogers SJ. Brief report: early intervention in autism. J Autism Dev Disord. 1996;26(2):243–6.
65. Butter EM, Wynn J, Mulick JA. Early intervention critical to autism treatment. Pediatr Ann. 2003;32(10):677–84.
66. Dumont-Mathieu T, Fein D. Screening for Autism in Young Children: The Modified Checklist for Autism in Toddlers (M-CHAT) and Other Measures. Ment Retard Dev Disabil Res Rev. 2005;11(3):253–62.
67. Lord C, Rutter M, DiLavore PC, Risi S. Autism diagnostic observation schedule. Los Angeles, CA: Western Psychological Services; 1999. 68. International Organization of Standardization. Cleanrooms and associated
controlled environments–Part 1: Classification of air cleanliness. Switzerland: International Organization of Standardization; 1999.
69. U.S. EPA Method 3052. Microwave assisted acid digestion of siliceous and organically based matrices in test methods for evaluating solid waste, physical/chemical methods SW-846. Washington, D.C: U.S. Government Printing Office; 1996.
70. U.S. EPA Method 6020B. Inductively coupled plasma-mass spectrometry in test methods for evaluating solid waste, physical/chemical methods SW-846. Washington, D.C: U.S. Government Printing Office; 2013.
71. U.S. EPA Method 6800. Elemental and speciated isotope dilution mass spectrometry in test methods for evaluating solid waste, physical/chemical methods SW-846. In: vol. Update IVA. Washington, D.C: U.S. Government Printing Office; 2007. p. 1–47.
72. U.S. EPA Method 1624. Volatile organic compounds by isotope dilution GCMS. Washington, D.C: U.S. Government Printing Office; 1989.
73. U.S. EPA Method 1625. Semivolatile organic compounds by isotope dilution GCMS. Washington, D.C: U.S. Government Printing Office; 1989.
74. Rutter M, Bailey A, Lord C. Social communication questionnaire. Los Angeles, CA: Western Psychological Services; 2003.
75. Cohen IL, Sudhalter V. PDD behavior inventory. Lutz, FL: Psychological Assessment Resources; 2005.
76. Aman MG, Singh NN, Stewart AW, Field CJ. The aberrant behavior checklist: a behavior rating scale for the assessment of the treatment effects. Am J Ment Defic. 1985;89(5):485–91.
77. Gilliam JE. Gilliam autism rating scale-second edition. Austin, TX: ProEd; 2006. 78. Rimland B, Edelson M. Autism treatment evaluation checklist. San Diego, CA:
Autism Research Institute; 1999.
79. Schopler E, Reichler RJ, Rochen Renner B. The Childhood Autism Rating Scale (CARS): for diagnostic screening and classification of autism. Irvington, New York: Irvington Press; 1986.
80. Berument SK, Rutter M, Lord C, Pickles A, Bailey A. Autism screening questionnaire: diagnostic validity. Br J Psychiatry. 1999;175(5):444–51. 81. Cohen IL, Schmidt-Lackner S, Romanczyk R, Sudhalter V. The PDD behavior
inventory: a rating scale for assessing response to intervention in children with pervasive developmental disorder. J Autism Dev Disord. 2003;33(1):31–45. 82. Zinn GM. The application of mass spectrometric measurement techniques
for the evaluation and assessment of autism spectrum disorders. Pittsburgh, PA: Duquesne University; 2014.
83. Fourth National Report on Human Exposure to Environmental Chemicals www.cdc.gov/exposurereport/
84. Adams JB, Baral M, Geis E, Mitchell J, Ingram J, Hensley A, et al. Safety and efficacy of oral DMSA therapy for children with autism spectrum disorders: Part A - Medical results. BMC Clinical Pharmacology 2009, 9(16). 85. Schafer FQ, Buettner GR. Redox envionment of the cell as viewed through
the redox state of the glutathione disulfide/glutathione couple. Free Radic Biol Med. 2001;30(11):1191–212.
87. Wu Y, Zheng J, Linden J, Holoshitz J. Genoprotective pathways part I. Extracellular signaling through Gs protein-coupled adenosine receptors prevents oxidative DNA damage. Mutat Res-Fund Mol M. 2004;546(1–2):93–102. 88. Almeida CG, de Mendonca A, Cunha RA, Ribeiro JA. Adenosine promotes
neuronal recovery from reactive oxygen species induced lesion in rat hippocampal slices. Neurosci Lett. 2003;339(2):127–30.
89. Chakrabarti N, Neale C, Payandeh J, Pai EF, Pomes R. An iris-like mechanism of pore dilation in the CorA magnesium transport system. Biophys J. 2010;98(5):784–92.
90. Strambi M, Longini M, Hayek J, Berni S, Macucci F, Scalacci E, et al. Magnesium profile in autism. Biol Trace Elem Res. 2006;109(2):97–104. 91. Lubkowska A, Sobieraj W. Concentrations of magnesium, calcium, iron,
selenium, zinc, and copper in the hair of autistic children. Trace Elem Electrolytes. 2009;26(2):72–7.
92. Mousain-Bosc M, Roche M, Polge A, Pradal-Prat D, Rapin J, Bali JP. Improvement of neurobehavioral disorders in children supplemented with magnesium-vitamin B6 II. Pervasive developmental disorder-autism. Magnes Res. 2006;19(1):53–62.
93. Curtis LT, Patel K. Nutritional and environmental approaches to preventing and treating autism and attention deficit hyperactivity disorder (ADHD): a review. J Altern Complement Med. 2008;14(1):79–85.
94. Marrero J, Rebagliati RJ, Leiva E, Londonio A, Smichowski P. Inductively coupled plasma optical emission spectrometric determination of fifteen elements in dietary supplements: are the concentrations declared in the labels accurate? Microchem J. 2013;108:81–6.
95. Fairweather-Tait SJ, Harvey LJ, Collings R. Risk-benefit analysis of mineral intakes: case studies on copper and iron. Proc Nutr Soc. 2011;70(1):1–9. 96. Jiang L-J, Maret W, Vallee BL. The glutathione redox couple modulates zinc
transfer from metallothionein to zinc-depleted sorbitol dehydrogenase. Proc Natl Acad Sci U S A. 1998;95(7):3483–8.
Submit your next manuscript to BioMed Central and take full advantage of:
• Convenient online submission
• Thorough peer review
• No space constraints or color figure charges
• Immediate publication on acceptance
• Inclusion in PubMed, CAS, Scopus and Google Scholar
• Research which is freely available for redistribution