Journal of Chemical and Pharmaceutical Research, 2018, 10(5): 89-95
Research Article
CODEN(USA) : JCPRC5
ISSN : 0975-7384
89
Evaluation of Soil Physical and Chemical Properties in the Fetzara
Basin-Annaba (Northeast Algeria)
Fadila Fekrache
*Department of Biology, Faculty of Sciences, University 20 August 1955-Skikda, Post Box 26, Skikda 21000, Algeria ___________________________________________________________________________
ABSTRACT
The main objective of this study was to evaluate soil properties of Fetzara lake that are very affected by the phenomenon of salinization and to study their variation with depth. The total of 20 soil samples was collected from different plots at 0-30 cm in depth and were analysed in the laboratory. The soil samples were analyzed for various physico-chemical properties viz., organic carbon (C), total Nitrogen (N), cation exchangeable (Na+, Ca+2, Mg+2, K+), pH, electrical conductivity (EC), cation exchange capacity (CEC), clay, sand and silt content, using standard laboratory procedures. The electrical conductivity of soil is characterized by a very wide variation (700-3600 µS/cm), the soil salinity has reached its maximum in the north-east and south of the lake. The result shows that the soil of Fetzara basin is predominated by sandy clay type. The pH was neutral to moderately alkaline with low to high in organic carbon and low to medium in CEC. Contents of individual exchangeable cations could be lined up in a following decreasing sequence: Ca+2>Mg+2>Na+>K+.
Keywords: Fetzara; Soil; Salinization; Cation exchangeable; Organic carbon; Total Nitrogen
_____________________________________________________________________________
INTRODUCTION
The suitability of soil for plant growth depends heavily on its structural properties and the nutriment concentration of the soil solution [1]. Soil properties are divided into physical, chemical and biological properties. Physical properties of the soil include soil texture, infiltration rate, and soil structure. Organic matter, cation and anion exchange capacity, pH, level of nitrogen, and carbonate are some of the important chemical properties of the soil [2]. Soil chemical elements have a spatial variability, especially in agricultural areas [3]. Biological properties refer to the living component, which consists of micro-organisms (such as microbes, fungi), macro-organisms (isopods and earthworms) and plant roots [4,5].
Soil physical properties influence the soil chemistry also determines its corrosivity, stability, and ability to absorb pollutants and to filter water. It is the surface chemistry of clays and humus colloids that determines soil's chemical properties. Indicators of soil chemical properties determining of the soil quality included soil organic material (organic C), the pH of the soil, Cation Exchange Capacity (CEC), total Nitrogen (N) and cations Exchangeable (Na+, Ca+2, Mg+2, K+). Basically, the soil nutrients can be divided by two categories namely organic and inorganic matters. Organic matter is a matter composed by waste of living organisms such as plants and animals in the environment; whereas inorganic matter is the natural components of the soil that are naturally composed from geological system. The total of organic matters in the soil is very important as indicators of soil fertility. Where, the fertility of soil related with its capacity to store, retain and release the nutrients that are required for plant growth especially C and N [6]. The C/N ratio is an indicator of biological activity of soil [7].
90
MATERIALS AND METHODS
Study Area
The Fetzara Basin is located in Annaba Province in the northeastern part of Algeria. The peripheral area of Lake Fetzara is 24000 ha. Fetzara Lake is located at 18 km southeast of the city of Annaba in the extreme east of Algeria. It lies on 17 km from east to west and 13 km from north to south. The basin is bordered in the north by the Edough Massif, in the south by the mountains of Ain Berda, in the west by the valley of the wadi Kébir and in the east by the sandy cord of El-kantara. The geology of the area is characterized by a metamorphic core complex of Precambrian to Palaeozoic age (the Edough Massif), overlain by a sedimentary cover mainly of Mesozoic to Quaternary formations. This area is subject to a Mediterranean climate with two distinct seasons: one humid and another dry
(Figure 1).
Figure 1: Location of the study area in Algerian Northeast
Soil Sampling and Laboratory Analysis
Sampling was done in the end of February 2017. 20 topsoil samples (0-30) were collected using a Gouge auger and mixed to obtain composite soil samples. The soil properties measured were texture, organic matter, pH, available phosphorous, available nitrogen, Electrical Conductivity (EC), exchangeable Ca+2, Mg+2, Na+ and K+. Soil pH was measured using glass electrode pH meter in distilled water using a soil to water ratio of 1:2.5. Electrical conductivity meter was used to measure the EC of 1:5 soil water suspensions. Organic carbon content was determined using acid dichromate method [14]. Pipette method [15] was used to determine soil texture and the CEC was determined according to the method described in rich (1961) [16]. Available phosphorous was determined by Olsen method [17]. Exchangeable cations were extracted by ammonium acetat method and determined by flame photometry (K+ and Na+) [18] and atomic absorption spectroscopy (Ca+2 and Mg+2) [19]. Total nitrogen was determined with Kjeldahl method. Soil organic carbon was analyzed according to the Walkley and Black method as described by Nelson and Sommers (1996) [14]. The organic matter (OM) content was calculated by multiplying the determined organic carbon by 1.724. Descriptive statistics of the analyzed soil data viz, minimum, maximum, mean, standard deviation, coefficient of variation and coefficient of correlation were determined using XLSTAT (Figure 2).
RESULTS
Data were subjected to descriptive analysis. The minimum, maximum, mean, standard deviations (SD), coefficient of variation (CV) for each soil property were computed for data analysis. Exploratory analyses were carried out for identification of outliers. The non-normally distributed soil properties were transformed using appropriate methods and then fit to approximate normal distribution. Pearson’s correlation coefficients were determined at each case to study the relationship among the estimated soil properties.
91
parameters into most (CV>35%), moderate (CV: 15-35%) and least (CV<15%) variable classes. Accordingly, EC, sand, OM, CEC, Na+, Mg+2, K+ were the most variability. Clay, silt, N, Ca+2 were the moderately variable and pH was least variable.
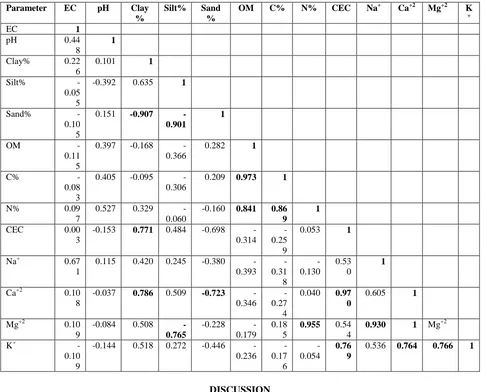
The results of the descriptive statistics (Table 1) revealed that the values of soil EC across the experimental field varied between 700 and 3600 µS/cm and the values of soil pH varied between 7.4 and 8.28. As per the standards of soil EC and pH scales [21], the field soil was characterized as saline and moderately alkaline soil. The soil pH showed a very low variability across the experimental field, as indicated by the very low value of CV of 2.759%. However, most variability of EC was observed across the experimental field with a CV value of 46.537%. Soil texture is one of the most important properties that influence most of the soil functions such as cation exchange, nutriments and water retention [22,23]. The results revealed that sand was the dominant soil texture component in the experimental field (37.500%), followed by clay (31.800%) and silt (30.100%). The clay, silt and sand contents of the Fetzara Lake ranged from 15-35%, 15-47.2% and 12-65% respectively. As indicated by the values of the coefficient of variation (CV), it was observed that the spatial variability of the clay component across the experimental field was the highest (CV of 32.289%) compared to silt (CV of 34.742%) and sand (CV of 37.355%). Organic carbon varied from medium to high in the study area. A total of 65% area was medium (4-10%), and 35% area were high (10-20%). The low OC status of these soils is due to erosion of topsoil and rate of organic matter. Available nitrogen was deficient in most of the areas with values. The acute deficiency of nitrogen is due to low OC content, increased rate of mineralization and insufficient application of N fertilizer to nutrient exhaustive crops. Moreover, N deficiency was also aggravated by high OC content of the soils. The correlation between the estimated properties (Table 2 and Table 3) showed that N was significantly correlated with OC (r=0.869), organic matter (r=0.841) indicating the influence of OC and OM on nitrogen availability.
Soil C/N ratio is a sensitive indicator of soil quality. Soil C/N ratio is often considered as a sign of soil nitrogen mineralization capacity. High soil C/N ratio can slow down the decomposition rate of organic matter and organic nitrogen by limiting the soil microbial activity ability, whereas low soil C/N ratio could accelerate the process [24]. The ratio of total organic carbon and total nitrogen is the traditional guide to the nature of the organic matter present in the soil. The passive fraction of the OM can have a C/N ratio that is medium. Consequently, medium C/N ratio soils can have a wide variation in mineralisable N status. A ratio of 10-12 is normal for an arable soil with a good rate of organic matter decomposition; 15-20 indicates slow decomposition of the organic matter. Ratios greater than 25 suggest that the organic matter is not decomposing. The C/N value of the soils varied between 0.54-13.26 of the soils surface horizon (0-30 cm).
Cation exchange capacity (CEC) is the total capacity of a soil to hold exchangeable cations. Soil with high CEC indicated that the soil has a high ability to provide cations nutrient such as K+, Ca+2 and Mg+2 for plants [25]. The larger the value of the CEC, the higher the soil’s capacity for cation nutrients. The value of CEC in the horizon (0-30 cm) of different soils varied from 7.5 to 31.8 meq/100 g with an average of 17.990 meq/100 g, which means the soils were silty or clay with medium to low organic matter level.
The cations potassium (K+), calcium (Ca+2), magnesium (Mg+2) and sodium (Na+) are an important group of nutrients essential for plant growth. Calcium is the dominant cation (Ca+2) held on the cation exchange capacity of soil clay and organic matter because it is held more tightly than magnesium (Mg+2) or potassium (K+), and other exchangeable cations. The base cations can be lined up in the following sequence: Ca+2>Na+>K+>Mg+2. In the surface layer (0-30 cm) there was a significantly higher level of all cations. Generally, the greatest accumulation of organic matter in soil leads to changes in the dynamics of macro and microelements, decreases soil acidity, maintains the predominance of cationic exchange capacity and improves microbial activity [26].
The correlation coefficient results are shown in Table 3. Soil clay was positively correlated with CEC, Ca+2 and Mg+2 and negatively with sand. Silt was negatively correlated with sand and soil sand was negatively correlated with Ca+2 and Mg+2.
92
Figure 2: USDA Textural triangle showing soil textural class of the Fetzara basin
Table 1: Descriptive statistics of the measured soil physicochemical properties (Min: Minimum; Max: Maximum; SV: Standard
deviation; CV: Coefficient of variation)
Parameter Min. Max. Mean. S. D. CV%
EC (µS/cm) 700.000 3600.000 1280.000 595.686 46.537
pH 7.400 8.280 7.911 0.218 2.759
Clay (%) 15.000 47.200 31.800 10.268 32.289
Silt (%) 15.000 49.000 30.100 10.457 34.742
Sand (%) 12.000 65.000 37.500 18.389 49.037
OM (%) 8.260 30.790 15.431 5.764 37.355
C (%) 4.800 17.900 8.777 3.400 38.744
N (%) 0.450 1.350 0.876 0.291 33.183
CEC (meq/100 g) 7.500 31.800 17.990 7.580 42.133
Na+ (meq/100 g) 0.460 1.890 0.918 0.393 42.870
Ca+2 (meq/100 g) 10.500 28.400 18.275 5.581 30.539
Mg+2 (meq/100 g) 0.850 4.600 2.504 1.278 51.056
K+ (meq/100 g) 0.340 1.080 0.591 0.226 38.156
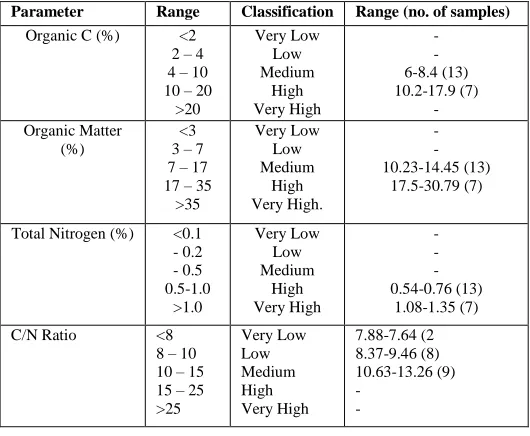
Table 2: Classification of soil quality based on Organic C, Organic Matter, Total Nitrogen and C/N Ratio
Parameter Range Classification Range (no. of samples)
Organic C (%) <2
2 – 4 4 – 10 10 – 20
>20
Very Low Low Medium
High Very High
- - 6-8.4 (13) 10.2-17.9 (7)
- Organic Matter
(%)
<3 3 – 7 7 – 17 17 – 35
>35
Very Low Low Medium
High Very High.
- - 10.23-14.45 (13)
17.5-30.79 (7)
Total Nitrogen (%) <0.1 - 0.2 - 0.5 0.5-1.0
>1.0
Very Low Low Medium
High Very High
- - - 0.54-0.76 (13)
1.08-1.35 (7)
C/N Ratio <8
8 – 10 10 – 15 15 – 25 >25
Very Low Low Medium High Very High
7.88-7.64 (2 8.37-9.46 (8) 10.63-13.26 (9) -
[image:4.612.174.439.504.722.2]93
Table 3: Correlation coefficient (r) between soil properties
Parameter EC pH Clay
%
Silt% Sand
%
OM C% N% CEC Na+ Ca+2 Mg+2 K
+
EC 1
pH 0.44
8
1
Clay% 0.22
6
0.101 1
Silt%
-0.05 5
-0.392 0.635 1
Sand%
-0.10 5
0.151 -0.907
-0.901
1
OM
-0.11 5
0.397 -0.168
-0.366
0.282 1
C%
-0.08 3
0.405 -0.095
-0.306
0.209 0.973 1
N% 0.09
7
0.527 0.329
-0.060
-0.160 0.841 0.86
9 1
CEC 0.00
3
-0.153 0.771 0.484 -0.698
-0.314 -0.25 9
0.053 1
Na+ 0.67
1
0.115 0.420 0.245 -0.380
-0.393 -0.31 8 -0.130 0.53 0 1
Ca+2 0.10
8
-0.037 0.786 0.509 -0.723
-0.346 -0.27 4
0.040 0.97
0
0.605 1
Mg+2 0.10
9
-0.084 0.508
-0.765
-0.228
-0.179 0.18
5
0.955 0.54 4
0.930 1 Mg+2
K+
-0.10 9
-0.144 0.518 0.272 -0.446
-0.236 -0.17 6 -0.054 0.76 9
0.536 0.764 0.766 1
DISCUSSION
In north easting Algeria and specifically in the region of Fetzara Lake there is endorrheic area in the Mediterranean climate where shallow lagoons have salinity problems but related to seasonal changes. The values of soil EC indicate the saline nature of soils.
According to [28] the CV values indicated low (<10%) variability of soil pH and moderate (10 to 100%) variability of soil rest of the soil properties. Low CV values for soil pH was due to transformed measurement of hydrogen ion concentration. This variability is due to interaction of geological, pedological, microclimate and land use factors including soil management practices, fertilization and crop rotation on spatial scales.
94
leaving the soil depleted in nutrients. It is for this reason that sandy soils lose much more ionic elements (free form), which could be distributed to plant nutrition, than the clay soils and/or rich in organic compounds.
The CEC is mainly influenced by specific surface area of clay minerals. The soils had the highest values of CEC, and there may be a strong correlation of CEC with the high concentrations of clay present in these soils, since the clay on its surface has a strong negative charge, which attract positively charged cationic elements.
The main determinants of CEC are clay and cations exchangeable. This is because both have a negative electric charge strong enough to attract the positively charged cationic elements. Soils with different contents of clay minerals and cations exchangeable have different values of CEC. The Pearson’s correlation analysis presented in Table 3 confirmed that there was significant correlation between CEC and clay (r=0.771), significant correlation between CEC and cations exchangeable (Ca+2: r=0.970; Mg+2: r=0.955; K+: r=0.769; Na+: r=0.530).
The total C and N in this study were determined about 8.7 and 0.87 g/kg respectively with C/N ratio about 10.52. The C/N ratio bellow 15 indicating that the soil on stress condition. The low of C/N ratio in this study is predicted as the impact of leaching on the top soil at the time of logging. In the other hand, that condition remind still not productive for all plant growth. Where, it has been reported that the ideal of C/N ratio for all plants are about 15. In contrast, the concentration of cation in this study is higher. These results are supported by soil texture analysis which found contain higher percentage of clay. The increasing of sand in the soil is significantly reducing the capability of soil to hold cation; conversely, the increasing of silt and clay significantly increased the capability of soil to hold cation.
CONCLUSION
The aim of this study was to determine the chemical and physical properties and to describe the soil of Fetzara area. Surface soil samples (0-30 cm) showed the pH ranging from 7.4 to 8.28 showing characteristic of neutral to moderately alkaline soils. Contents of organic carbon and total nitrogen were the highest in the surface of examined soils. The C/N ratio reached usually relatively low and medium values in superficial layers of studied soils. Cation exchangeable capacity and sum of exchangeable base cations varied in samples of the soil profiles. The base cations can be lined up in the following sequence: Ca+2>Mg+2>Na+>K+.
REFERENCES
[1] B Cemek; M Guler; K Kilic; Y Demir; H Arslan. Environ Monit Assess. 2007, 124: 223-234. [2] NC Brady; RR Weil. New Jersey: Prentice Hall. 2008, 992.
[3] I Bogunovic; P Pereira; E Brevik. Science of Total Environment. 2017, 535-545. [4] K Lee; RC Foster. Australian Journal of Soil Research. 1991, 29, 745-775. [5] A McCauley; N Jacobsen. Module 1, 2005.
[6] G Amlin Mohd; N Suratman, N Nadhirahmd Isa. APCBEE Procedia. 2014, 9, 75-81. [7] N Kachi; S Kachi; H Bousnoubra. Soil & Water Res. 2016, 2, 97-104.
[8] K Bencherif; A Boutekrabt; J Fontaine; F Laruelle; Y Dalpe; A Lounes-Hadjsahraoui. Science of the Total Environment. 2015, 533, 488-494.
[9] DGF. General Directorate of Forests; Annual report of the Directorate General of Forests. Constituency of the Daira of Hassi Bahbah (W. Djelfa). 2000.
[10] J Durand. SES Alger. 1950, 112.
[11]Ifagraria. General study of the agricultural development of the coastal plains of Annaba. Soc Ifagraria, Rome; Part I; 1967, 169.
[12]Japan International Cooperation Agency (JICA). Study of the feasibility of the agricultural development project in the peripheral region of Lake Fetzara. 1985, 3.
[13]R Djamai. Agricultural Science. 1993, 78.
[14]DR Nielsen; J Bouma. American Society of Agronomy. 1996, 961-1010. [15]GW Gee; JW Bauder. American Society of Agronomy. 2002, 383-411. [16]CI Riche. Soil Sciences. 1961, 92, 226-231.
[17] S Kuo. Soil Science Society of America, Inc. Madsion, 1996, 895-897. [18]JJ Hanway; H Heidel. Lowa Agriculture 1952, 57, 1-31.
95
[21] Soil Survey Division Staff. Soil survey manual, soil conservation service. U. S. Department of Agriculture Handbook 18, 1993.
[22]D Kumaragamage; KMA Kendaragama. Mapa R B, Somasiri S, Dassanayake AR (eds); 2010, 239-258. [23]M Seilsepour; M Rashidi. J World Appl Sci. 2008, 3, 200-2005.
[24]G Shunfeng; X Haigang; J Mengmeng; J Yuanmao. Open Journal of Soil Science. 2013, 3, 213-217. [25]B Hermiyanto; S Winarso; W Kusumandaru. Agriculture and Agricultural Science Procedia. 2016, 9,
181-190.
[26]V Agoume, AM Birang. Tropicultura. 2009, 27, 15-20.
[27]HD Foth; LM Turk. Soil & Tillage Research. 1972, 106, 185-193.
[28]DR Nielsen; J Bouma. Las Vegas USA, 30 th of November to 1st of December 1984, Pudoc, Wageningen,