Journal of Chemical and Pharmaceutical Research, 2014, 6(3):122-130
Research Article
CODEN(USA) : JCPRC5
ISSN : 0975-7384
Research on multi-criterion optimization of computer-communication
network reliability-using genetic algorithms
Hongbo Shao
1*, Lianjie Dong
2and Jianhui Wu
31College of Science, Agricultural University of Hebei, Baoding, China 2College of Science, Agriculture University of Hebei, Baoding, China
3Hebei Province Key Laboratory of Occupational Health and Safety for Coal Industry, Division of Epidemiology
and Health Statistics, Hebei United University, Tang Shan, China
____________________________________________________________________________________________
ABSTRACT
This paper is a study of computer communication backbone network. Based on the principles and multi-criterion models of computer-communication network reliability, the paper set up a multi-criterion optimization model for the all-terminal network reliability, with all-terminal reliability used as the indicator, where genetic algorithm is employed and proved to be able to generate a satisfactory result within the shortest time, and managed to solve the problem Np-hard, which is meant to be of high reliability and low cost.
Keywords:Computer-communication network, network reliability, network topology, multi-criterion optimization,
genetic algorithm
____________________________________________________________________________________________
INTRODUCTION
The concept of computer communication network reliability was first brought up in 1970s when the rapid development of communications technology, optical fiber technology and internet called for a deep research in this respect, which is of great theoretic and practical significance [4].
While ensuring a reliable system, the theoretical research should never neglect such indicators as linking cost, maintenance cost, time delay, blocking rate and response time. In real project application, it is concerned with two principal factors: network performance and its cost [2]. In most cases, one slight improvement of the existing typology can lead to a decrease in cost and further optimization by adopting new ideas and technology could cut down on the cost dramatically with the system performance remaining unchanged. Therefore, it is of great significance for the network system to be optimized [1].
Based on an overview of previous research, this article is going to make a theoretical analysis of the building a reliability model using genetic algorithms and thus offer strategies of safe service in the future application [3]; it is intended to set up a reliable computer communication network using optimizing operation supported with a case study.
Overseas researches of computer communication network reliability started from Lee’ study on telecom exchange network, where components failure in computer communication network led to a dramatic decline in total capacity of telecom exchange network, call congestion and thus paralyzed[7]. Lee defined the call congestion as link failure and brought up the idea of using connectivity as a criterion of a reliable computer communication network, which prevailed for quite a while.
lower bounds of all-terminal reliability and came up with its design formulas in the case of failure set and node failure. Some have made significant attempts to study two-terminal network reliability, K-terminal reliability and all-terminal reliability [9].
However, there are few studies on multi-criterion optimization of a reliable network in China since traditional design of network typology used to take the minimum cost as a constraint and scholars like Pan Qijing, Liu Xiaoe made researches by using two-terminal network reliability or node reliability as indicators for reliability [8]. This paper will apply genetic algorithms to the multi-criterion optimization of a reliable computer communication network in the hope of offering technical and theoretical support for further researches through theoretical analysis and case study.
PTINCIPLES OF DESIGNING COMPUTER-COMMUNICATION NETWROK RELIABILITY
In this respect, many researches have been done and the following principles are known to follow:
1) As is required by international standard, an open computer communication network must be adopted, supporting heterogeneous system and equipments so that it has great potential for updating.
2) Advanced and well-proved communication network technology must be combined with practical and universal network typology structure.
3) The network must be inter-linking, supporting a variety of communication protocols. 4) Highly secure and reliable, with a high capacity of redundancy and fault tolerance
5) Highly manageable with advanced network managing software and equipments supporting SNMP and CMIP 6) Sound Communication network link medium and backbone network with enough bandwidth to be highly responsive
7) Protect the existing investment in computer communication network and make full use of existing resources and hardware, Network cabling, and well-received Network Operating System software and applications
8) enhance the cost performance provided the network is highly reliable.
MULTI-CRITERION OPTIMIZATION OF COMPUTER-COMMUNICATION NETWORK
RELIABILITY
Based on the relevant theories of computer-communication network design and its optimization, it is understood that its reliability design is multi-criterion, or rather, Multi-criterion optimization involving more than one criterion function to be optimized simultaneously. It refers to seeking the decision variables (often there are more than one) which can meet the requirements so as to optimize the criterion function vector, described as
1
2
minf X min f x f x, , , f xk (1)
where minimum value of function is reached to be optimized.
The constraints is described as g Xi
0, i1, 2,m,with mreferring to the quantity of constraints, and thedecision variable is described as X
x x1, ,2 xn
T , with its value domain symbolized as . The formula f Xi
(1 i k)describes all the sub-criterion variables, with k referring to the number of them.It is usually impossible for all the sub-criterions to be optimized simultaneously, and thus non-inferior result is usually adopted, also called Pareto solution. The Pareto result set is referred to as Pareto Distribution, where lies the final result of multi-criterion optimization.
The optimization of computer-communications network reliability is actually a NP-hard problem, involving: 1) Minimizing cost with network reliability as a constraint
2) Maximizing network reliability with cost as a constraint, and
3) Under certain constraint, maximizing network reliability with the minimum cost
Here, the first two items involves single criterion optimization, saying partially one aspect of network reliability optimization, while item 3) is about multi-criterion, taking into account the interests of both operators and users by finding a middle ground between them, thus being able to meet the requirement of real-life programming. Currently, a number of thorough studies have been done home and abroad on single-criterion optimization; however, there are few researches on the multi-criterion optimization. This paper is intended to set up multi-criterion optimization model of all-terminal network reliability, where a satisfactory result can be achieved within the shortest time applying genetic algorithm [11].
constraints. It is to find one or more solutions to a problem so that the designer can accept all the possible results. Therefore, single criterion optimization can be considered as one particular case of that of multi-criterion, which may occur in departments such as engineering, production and management and national military defense [12]. For example, in designing backbone network, there are three indicators to be optimized, which are cost, time lag, reliability and survival. It can be said that mufti-criterion optimization is used in many aspects of our life.
It is often described as
1 2
min min , , ,
. . 0 0,1,2,
0,1,2,
T m
i i
V F x f x f x f x
st g x i m
h x R i m
(2)
where Vmin
F x
is the multi-criterion minimization for short, and
min
1
, 2 , , m
, 1F X f x f x f x m is vector function, with g xi
and h xi
as constraints.Traditional ways of seeking results are based on the idea of optimizing single- criterion, and most of them focus on the optimal result, which goes against the nature of multi-criterion optimization in a sense that there doesn’t exist such a result. Consequently, Pareto optimization and fuzzy optimization have been brought up together with Evaluation Function, which is used to solve multi-criterion optimization. According to its philosophy, evaluation function is formed by evaluating the multi criteria based on a certain optimizing strategy or decision so that the multi-criterion optimization is broken down to its single –criterion optimization, the results of which could be taken as that of the former when they meet the requirement for Pareto optimization and fuzzy optimization. In this sense, the result obtained could be considered satisfactory [13].
Presume there are n system parameters for the optimization, and
X
is used to indicate a set of optional parameters, thus
1, , ,2 n i , 1, 2, ,
X x x x x R i n (3)
where X is the result domain, with one set of parametersx k
x k x k1
, 2 , , x kn
is considered a result of optimizing the parameters.Presume there are m performance indicators for the evaluation function optimization, and H is a set of performance indicators, defined as:
1, , ,2 m k , 1, 2, ,
H h h h h R k m (4)
For a given parameter resultx k
,the value of its performance indicator is described as:
1
, 2 , , m
h k h k h k h k (5)
where h kk
is the value of each performance indicator, since the value of hk usually depends on the number of parameter variables, represented as hk k
x , thus
1, , ,2 m
1
, 2 , , m
h h h h x x x x (6)
According to the will of designers, a varied function can be obtained for each performance indicator:
, 1, 2, ,k k k
s g h k m gk:R
0,1 (7)k
s indicates the degree a designer is satisfied with performance indicators of hk and contributes to the satisfaction function vector:
1, , ,2
,
0,1 m ms s s s s ,with vector functiong
defining the satisfaction function for performance indicators, thus:
1
1 , 2 2 , , m
mA general satisfaction function can be defined as:
1, , ,2 m
sw f s f s s s sw
0,1 (9)The satisfaction function is a Scalar Function and is a general evaluation of performance indicators on the part of designers. It can take varied forms
Based on the above formula, the model of a satisfying multi-criterion optimization is defined as:
max sw sw f x s g h h x
(10)
wherex X R h Hn, R sm,
0,1 ,m sw
0,1m.Through this model, optimizing the result of satisfaction function for the performance indicators will lead to the optimization of system parameters.
Now the paper continues to discuss the mathematical model of optimizing multi-criterion network satisfaction, designed to seek network typology which can meet the requirements. Presume the structure of network typology is imagined as weighted undirected graph, defined as G
V E,
, where, V being the node set, can be either exchange board, router and host or subnet, when E is the edge set, indicating communications links. V is the number of node, E is the number of edges, the edge eij
v vi, j
shows a direct line between each node
v vi, j
, eij 0 means there is no direct link between the pair of dominators and ,i j1, 2, , nEach node and link in the graph can be metrically represented. In the following representations, R is the set of
real numbers andRis the Nonnegative real number set, defined as:
There are three cases of the state of edge eij in the weighted undirected graph, Edge propagation delaydelay e
ij :ER, edge cost cost e
ij :ER and edge reliabilityrel e
ij :ER,With the following parameters given: 1) Traffic requirement matrix 2) Possible Link capacity value 3) Function for communication cost 4) Reliability probability of links and nodes
Based on the above network model, the mathematical model of optimizing multi-criterion network satisfaction can be described as:
1
_ _ cos _ _
_ cos _ _
c d r
N ij j j i
gen sat G W Sat t G W Sat delay G W Sat rel G
Sat t G g Z G
Sat delay G h D G
Sat REL G S R G
dia
g
(11)
cost of using network, with the average delay and unreliability being of minimum value , and
: _
Maximize Gen sat G shows the overall satisfaction with the network being of maximum value. Wc,Wd and
r
W are indicators of weights, is Hop count between two nodes, and is the number of nodes linked directly to
i throughout the network. The two parameters are constraint constants.
In short, the satisfaction optimization can be reached in the following steps:
1) Set up a mathematical model for optimizing computer network reliability and determine the optimization parameters.
2) Employ Raglan relaxation method to determine the limit of those parameters or performance indicators that are hard to calculate.
3) Select performance indicators and design satisfaction function. 4) Design the function for overall satisfaction
5) Design the optimization through genetic algorithm, Heuristic search method and Raglan relaxation method. 6) Verify the result of optimization design through simulation.
OPTIMIZATION OF COMPUTER NETWORK RELIABILITY USING GENETIC ALGORITHMS
As a recent approach to optimization, Genetic Algorithm(GA) is employed in the research to do the optimization operation [14]. It is an adaptive heuristic search method by simulating the genetic evolution of living creatures in the natural environment. Regardless of the nature of optimization itself, its forms, models, the number of optimized parameters and other constraints, this method has the potential to avoid the problems with the traditional optimization only when the criterion function perform adaptive heuristic search guided by the probability rule, therefore it is widely used and can be used to solve the problem with reliability design such as, NP-hard. The following steps are required:
1) Set up a coding program where coded sequence is called chromosome and coding elements called Gene will randomly generate a set of initial chromosome, which is called initial set.
2) Fitness operation: decode each chromosome in the set and get a set of results, thus the adaptation of each chromosome.
3) Select operation: determine the probability of each chromosome being inherited to the next generation based on the fitness, and randomly generate chromosome from the next generation.
4) Crossover operation: match the chromosome in the set and exchange some based on crossover probability. 5) Mutation operation: according the probability of mutation, change the gene value of chromosome at the right moment of getting mutated.
Repeat iterated operation during the steps 2-5 until there is an optimized individual which can meet the requirement. When the satisfaction optimization is combined with genetic algorithm operation and the function for overall satisfaction used as the fitness value, the backbone network design which can best meet the users’ requirement is the optimized result.
The function for satisfaction is to evaluate the quality of the satisfactory result achieved under a given performance evaluation rule. Its formation is a crucial step because it has a direct impact on the quality of the result. In real-life application, the function for satisfaction must be established to reach an evaluation of the satisfactory result according to the application of optimization. Therefore, it is necessary to make a quantitative description and study on the satisfaction function in terms of its widely-used and proper representations in order to meet the requirements of scientific study and engineering operations. In the satisfaction function of Performance indicators, performance function(for cost and reliability) is the independent variable, and the satisfaction with performance indicators represents how satisfied the decision-maker is with the function result, where 1 is the maximum satisfaction and 0 is the minimum, so the results of satisfaction function ranges from 1 to 0.
This paper prefers the satisfaction functions for cost and reliability, defined as: Cost function:
min
min
min min
max max
max 1
1
1 _
0
opt opt
opt
opt opt
x cost
b cost x
cost x cost
cost cost
sat cost x
b cost x
cost x cost
cost cost
x cost
Reliability function:
0 00 0
0 _
1 1
x R sat rel x x R
R x
R
(13)
where 0R0 1,costmin is the minimum network cost,costopt is slightly more than the minimum result, and
max
cost is the maximum cost, and when the cost is above costmax, the result of satisfaction function is 0.
In this article, the set of parameters involved in the design of backbone network is described asX
x x1, 2
, where1
x is the cost for the whole network, and x2is the all-terminal reliability, which is a constraint, and the network
which could not meet the requirements has been eliminated during initialization and mutation, therefore the relative reliability of cost is getting more important. The value of cost and all-terminal reliability can be obtained from the above-mentioned method, wc0.75 and wd 0.25. As a result, the function of overall satisfaction is described as:
_ 0.75 _ 0.25 _
gen satify x sat cost x sat rel x (14)
Based on the above fitness function, the operation of genetic algorithm in optimization design of network reliability can take the following steps:
[image:6.595.231.386.390.433.2]1) Genetic representation. The binary coding method is adopted to determine the representation of computer network node gene involvingNnodes, represented as in Table 1:
TABLE 1 The representation of computer network node gene
1
N g11 g1n
2
N g21 g2n
2)The selection of fitness function.
In order to prevent such deception from happening in the genetic operation that the cost value of individuals is arranged in the way the individual of the low cost is sequenced as 1 while the one with the maximum cost value as
_
Pop size, the fitness function is designed as:
1
_ 1
f x x Pop size (15)
where x is the position in sequencing order of cost and Pop size_ is the size of the group, with 1 x Pop size_ .
3)Evolutionary operation(selection).
Roulette Wheel Selection is adopted, whose basic idea is that each genetic selection is directly proportional to its fitness. If is the fitness of individual in the population, its probability of being selected is
_
1
k k Pop size
j j
f P
f
(16)4)Genetic algorithms
The mutation operation should start from deciding the genetic representation for mutation and the number of mutations before selecting a new gene to replace the old one in a given range. In most cases, the mutation rate is
0.001,0.01
mP , with the exception where genes causing incorrect network connection might be generated when adjusting operation is also needed.
5)Adjusting operation steps
When the genetic representation of network nodes is an inaccurate representation of the original computer network typology, adjustments should be made in the following steps:
for the encoding of each node mutated in the chromosome for j=l,N
If gij=1 then if gji=0 then gji=1 else
if gji=1 then gji=0 End for
End for
6) Termination
Commonly, the algorithm terminates when either an iteration with a maximum number of generations has been produced, or a satisfactory fitness level has been reached for the population.
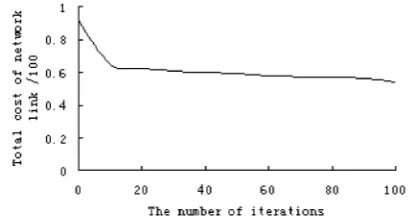
In order to prove the validity of the above operation, a simulated experiment has been made, where the number of network nodes N 6, the constraining constant of reliability 2, 2, and there are 100 iterations, thus the cost matrix for computer network linksC0 and its reliability matrix R0 are respectively:
0
0 6 8 15 16 9
6 0 8 9 13 6
8 8 0 6 12 10
15 9 6 0 3 4
16 13 12 3 0 7
9 6 10 4 7 0
C
, 0
0 0.95 0.97 0.99 0.96 0.98
0.95 0 0.994 0.952 0.97 0.99
0.97 0.994 0 0.98 0.996 0.96
0.99 0.952 0.98 0 0.95 0.93
0.96 0.97 0.996 0.95 0 0.98
0.98 0.99 0.96 0.93 0.98 0
R
[image:7.595.73.415.385.473.2]According to genetic algorithm operation and its adjustment operation, a simulated result can be produced and the simulation terminates when 100 iterations has been produced. The simulated results show that the minimum cost of network links is 54 when the network reliability is ensure to be up to 0.925, and both are described in the following Fig. 1 and Fig. 2.
[image:7.595.199.407.535.645.2]Figure 2. Computer network reliability
A CASE STUDY OF MULTI-CRITERION OPTIMIZATION OF COMPUTER NETWORK RELIABILITY USING GENETIC ALGORITHMS
The communication network in the case study involves 4 service center (n4)) and 8 stations (m8), with each center connected to no more than 3 stations (gi3). The real-life network shows that there is a high cost linking service centeri and j , so w1ijis randomly generated between
100,300
. Since the cost linking iand station j is much lower, w2ijis randomly generated between
1,100
and the total communication flows cifrom service centeri reaches 50,thus the range of values of w1ijand w2ijis respectively:1
0 260 240 130 260 0 255 264 240 255 0 152 130 264 152 0
w
,
2
35 9 12 84 86 52 71 64 55 62 31 11 15 28 49 75 62 51 85 76 25 61 35 39 64 59 82 5 17 84 53 61
w
The reliability of service center is 0.95; of the station is 0.9; that of linking service centers is 0.9; and that of linking service centers and stations is 0.85, with Rmin=0.9. The GA in this paper operates under Matlab7.0, and its
parameters are POPXZE = 100, the maximum number of iteration MAXGEN =500, crossover rate is Pc=0.3, mutation rate Pm =0.7 and the number of program iteration reaches 32, where different generations are formed during each operation and the best results are selected for comparison during the 32 iteration.
In Reference [5], The GA parameters are set to produce the values of cost, average delay and reliability so as to design the parameters for performance satisfaction function. a1=700, a2=900, a3=1200,when it comes to the satisfaction of total cost, and b1=0.5,b2=0.9, b3=l.5 for reliability satisfaction with a=0.7,b=0.8,c=0.7.
If the network cost Wc ,average delay Wr and reliability Wd are of equal importance, their value for overall satisfaction is respectively WcWr Wd 1 3 and the node for optimization center is shown as 1,2,converted into tree diagram with three sides: (3,l),(1,2), (2,4),stations being 2,4,4,4,3,3,3,2;if unreliable results are eliminated during initialization and mutation, and network cost and average delay are treated equally regardless of reliability, the values of the three parameters for the overall satisfaction would be respectively: WcWd 0.5,Wr 0, and the result center is l,2,the three sides in a tree diagram being(3,l),(l,2),(2,4), stations being 3,l,3,3,4,4,4,2;and if cost is slightly preferred to average delay, the result will be Wc 0.8,Wd 0.2,Wr 0,and the node for result center is l,2,and the three sides in the tree diagram are respectively:(3,l),(l,2),(2,4),with stations being 3,l,3,3,l,2,2,2,2.The above comparison of performance is shown in table 2.
[image:8.595.74.251.324.440.2]Weight Cost Reliability Cost satisfaction Reliability satisfaction Overall satisfaction
1 3
c r d
W W W 602 1 0.992 1 0.985
0.5
c d
W W Wr 0 608 0.9365 0.974 0.965 0.996
0.8
c
W Wd 0.2 Wr 0 551 0.9237 1 0.933 0.995
The above analysis indicates that a satisfactory reliability can be reached when the parameters are weighted differently. The combination of multi-criterion optimization with GA can lead to satisfactory result with the least time. Different weighing of parameters successfully solved the problem NP-hard and is a quick optimization of computer communication network typology.
CONCLUSION
The paper started from an analysis of the computer communication network reliability and its influence factors before a case study of its optimization, where multi-criterion optimization was combined with genetic algorithm and a satisfactory result has been achieved. The design proved to be able to successfully solve the problem NP-hard. It is flexible and practical and can enhance the network reliability because the satisfaction function of all the performance indicators can be adjusted according to the application and design purposes.
REFERENCES
[1] Bema Dengiz, Alice E.mith,IEEE Trans reliability,1997,MARCH, vol.46, No.1.
[2] Behr, A Camarinopoulos, L.&Pam Poukis, Cx, IEEE Transactions on Reliability, 1995, Vol.44, no.4, pp.705-707.
[3] Agarwal KK, GuPta JS., Misra K B,IEEE Trans On Communication,1975, Vol.23, pp.563-566. [4] Fu Min Yeh, Sy Yen Kuo, “Electronics Letters,1997, Vol.33, No.4, pp. 759-760.
[5] Jong, Ryul, Kim, Mitsuo Gen,IEEE, 1999, pp. 2272-2279.
[6] Ayoub J N, Saafin W H, Kahhaleh B Z, “K-Terminal Reliability of Communication Networks,” Electronics, Circuits and Systems, 2000, ICECS 2000.The 7thIEEE International Conference on,2000, 1, pp.374-377.
[7] Colboum C J, The Combinatories of Network Reliability,New York oxford: oxford University Press, 1987. [8] Lovelace W M, Townsend J K,IEEE Journal on Selected Areas in Communications,2002, vol. 20, no. 9, pp. 1646-1651.
[9] Homier E A, Scholtz R A, “Rapid acquisition of ultra2widebandsignals in the dense multi path channel,”,IEEE Conference on Ultra Wideband Systems and Technologies Baltimore, MD , USA,2002, pp. 105-110.
[10] Fhihg R, Kushner C, Roberts G, et al, “Rapid acquisition for ultra wide band localizers,”Proc. of Conference on LIWB Systems & Technologies, Baltimore, MD, USA,2002, pp. 245-250.
[11] Yang L, Tian Z, Giannakis G B, “Non2data aided timing acquisition of ultra wide band transmissions using cyclostationarity,”[C],Proc. of Intl. Conf. on ASSP, Hong Kong, China,2003, pp.:121-124.
[12] Saleh A A, Valenzuela R A, IEEE Journal on Selected Areas in Communications, 1987, vol.5, no. 2, pp.128-137.