UNIVERSITI TUN HUSSEIN ONN MALAYSIA
STATUS CONFIRMATION FOR DOCTORAL THESIS
LEAN THINKING APPROACH TO SUSTAINABLE IMPROVEMENT FOR PUBLIC OFFICE BUILDINGS FROM OCCUPANTS’ PERSPECTIVE
ACADEMIC SESSION: 2015/2016
I, ADEGBENGA ADEYEMI, agree to allow this Doctoral Thesis to be kept at the Library under the following terms:
1. This Doctoral Thesis is the property of the Universiti Tun Hussein Onn Malaysia. 2. The library has the right to make copies for educational purposes only.
3. The library is allowed to make copies of this report for educational exchange between higher educational institutions.
4. ** Please Mark (√)
CONFIDENTIAL (Contains information of high security or of great importance to Malaysia as STIPULATED under the OFFICIAL SECRET ACT 1972)
RESTRICTED (Contains restricted information as determined by the Organization/institution where research was conducted)
FREE ACCESS
Approved by:
ADEGBENGA ADEYEMI PROF. Sr DR. DAVID MARTIN @ DAUD JUANIL
Permanent address:
Department of Real Estate Management,
Faculty of Technology Management and Business, UTHM, 86400 Parit Raja, Batu Pahat, Johor.
Date: _______________________________ Date: _______________________________
This thesis had been examined on 15th February, 2016 and is sufficient in fulfilling the scope and quality for the purpose of awarding the Degree of Doctor of Philosophy.
………...……… Prof. Dr. Sulaiman bin H. J. Hasan (Chairman)
……….………. Prof. Sr Dr. Megat Mohamed Ghazali bin Megat Abd Rahman (External examiner)
LEAN THINKING APPROACH TO SUSTAINABLE IMPROVEMENT FOR PUBLIC OFFICE BUILDINGS FROM OCCUPANTS’ PERSPECTIVE
ADEGBENGA ADEYEMI
A thesis submitted in
fulfillment of the requirement for the award of the Doctor of Philosophy
Faculty of Technology Management and Business Universiti Tun Hussein Onn Malaysia
I hereby declare that the work in this thesis is my own except for quotations and summaries which were duly acknowledged
Student: ………
Adegbenga Adeyemi
Date: ………
Supervisor: ………
Prof. Sr Dr. David Martin @ Daud Juanil
Co-Supervisor: ………
DEDICATION
This work is dedicated to my LORD and Saviour Jesus Christ, whose grace was sufficient for me to embark on this research; all glory and honour be unto Him.
Through it all, I have learnt to trust in Jesus and depend upon His Word - 1
Corinthians 15:57 But thanks be to God, which giveth us the victory through our
ACKNOWLEDGEMENT
First of all, I thank my Lord and Saviour Jesus Christ, for keeping me alive to make my dream come true. To Him be all the glory and honour.
I give my unreserved appreciation to my supervisor - Professor Sr Dr. David Martin @ Daud Juanil, for his relentless guidance throughout the period of my research; from the initial project proposal to the completion of this thesis. Despite his busy work schedule, he gave his full support, spent time to go through the drafts and prepared me for the viva. His regular encouraging words to me were: “You can do it”. I also acknowledge my co-supervisor Prof. Madya Dr. Rozilah Kasim for her advice and direction during the course of the research. I thank the administrative staff of FPTP for your cooperation through my research period, especially Noorashikin, Lily and Mimi.
This thesis would have been impossible without the moral support I received from my immediate family; I therefore acknowledge my wife Oluwayemisi and my children - Adedoyin, Adewunmi, Oluwaseyi, Olawale and Oluwamayowa for their tremendous encouragement, unfailing love and their belief in me throughout this research. Thank you so much.
I specially appreciate Dr. Abubakar Aliyu, Ugbede Onalo and Sulaiman Lame for their encouragement and help during the research. There are also a lot of friends too numerous to mention, who encouraged me throughout my research period; some by just being interested in my studies, asking me about my research and cheering me on to complete the thesis, thanks to you all.
Finally, I thank my fellow labourers in His Vineyard both at the Chapel of Victory, Bauchi and Hope BP, for their prayers and for checking on me from time to time, especially Pastors Emma, Vincent, Elijah, Patrick, Uche, Joe, Matthew, Ibrahim, Dr. Peniel and Bro. Sunny; your words of encouragement also kept me going. May the Lord continue to bless your ministries in Jesus name. Amen!!
ABSTRACT
ABSTRAK
TABLE OF CONTENTS
DEDICATION ... iii
ACKNOWLEDGEMENT ... iv
ABSTRACT ... v
ABSTRAK ... vi
TABLE OF CONTENTS ... viii
LIST OF TABLES ... xvii
LIST OF FIGURES ... xxi
LIST OF ABREVIATIONS ... xxviii
LIST OF APPENDICES ... xxxi
DEFINITION OF KEY TERMS ... xxxii
CHAPTER 1 ... 1
INTRODUCTION ... 1
1.1 Background to the research ... 1
1.2 The problem statement ... 3
1.3 Aim of the research ... 6
1.4 Research questions (RQs)... 6
1.5 Research objectives (ROs) ... 6
1.6 Research hypotheses ... 7
1.7 Scope of the research ... 7
1.8 Research methodology ... 8
1.9 Significance of the research... 9
1.9.3 Generation of sustainable buildings from existing asset ... 10
1.9.4 Guide to office building designers on aesthetics and functionality ... 10
1.9.5 Promotion of bottom-up approach to policy formation ... 11
1.9.6 Participatory multi-stakeholder approach to SD ... 11
1.9.7 Guide for SD laws and regulations formulation ... 11
1.10 Structure of the thesis ... 12
1.11 Summary ... 13
CHAPTER 2 ... 14
LITERATURE REVIEW... 14
2.1 Introduction ... 14
2.2 The concept of sustainable development ... 14
2.2.1 Perceptions of the concept and definition of SD ... 15
2.2.2 The Triple Bottom Line (TBL) of SD ... 16
2.2.3 Suggested practical approach to SD ... 17
2.2.4 Past studies on SD in the built environment in Nigeria ... 18
2.2.5 Multi-stakeholder and interdisciplinary approach to SD ... 21
2.3 Waste and inefficiencies (muda) in existing office buildings ... 21
2.3.1 Waste ... 21
2.3.2 Inefficiencies ... 22
2.3.3 Development of RQ1 with objective and hypothesis ... 23
2.4 Definition and concept of building maintenance... 24
2.5 Concept of building improvement as against maintenance ... 25
2.6 Other improvement terminologies used in literature ... 27
2.6.1 Adaptation ... 27
2.6.2 Refurbishment ... 28
2.6.3 Rehabilitation ... 29
2.6.5 Remodeling ... 30
2.6.6 Revitalization ... 30
2.7 Sustainable improvement of existing buildings ... 30
2.7.1 Benefits of improvement of existing buildings ... 32
2.7.2 Factors affecting improvement of existing office buildings ... 36
2.7.3 Sustainable improvement of office buildings ... 37
2.8 Sustainable improvement concepts ... 37
2.8.1 Zero Emissions (ZE) ... 38
2.8.2 Green Building (GB) ... 39
2.9 The concept of Lean Thinking ... 41
2.9.1 History of lean thinking ... 41
2.9.2 Principles of lean thinking ... 42
2.9.3 Application of lean thinking in previous studies ... 44
2.9.4 The muda drivers... 47
2.9.5 Critical views of lean thinking concept ... 48
2.9.6 Justification for the adoption of the lean thinking concept ... 50
2.9.7 Development of RQ2 with objective and hypothesis ... 51
2.10 The classification of design features ... 52
2.10.1 Development of RQ3 and RQ4 with objectives and hypotheses ... 53
2.10.2 Criteria for office building improvement ... 54
2.10.3 Effect of Information Technology (IT) in office improvement ... 54
2.11 Users’ requirement and satisfaction ... 55
2.11.1 Importance of users’ requirement ... 56
2.11.2 Typical improvement diagnosis of existing office buildings ... 59
2.11.3 Reflection of users’ requirement in sustainable office buildings ... 59
2.11.4 Concepts used to assess users’ requirement in past studies ... 60
2.12 Key Performance Indicators (KPIs) in office buildings ... 64
2.12.1 Technical performance requirements ... 65
2.12.2 Functional performance requirement ... 68
2.12.3 Personal control over local environment ... 71
2.13 Office environment effect on job productivity ... 72
2.13.1 Theoretical framework for perceived job productivity ... 73
2.13.2 Self-assessed job productivity in the office environment ... 76
2.14 Post-Occupancy Evaluation (POE) ... 77
2.14.1 Problems constraining the use of POE in Nigeria ... 78
2.14.2 Types of POE ... 78
2.14.3 Past studies using POE ... 79
2.14.4 POE as a data acquiring tool ... 83
2.15 The role of legislation in SD ... 84
2.16 Research gap ... 85
2.17 Establishment of the objective research paradigm ... 88
2.18 Research deductive approach based on direct literature finding ... 89
2.19 Concept of the theoretical framework ... 92
2.20 Rationalization for adoption of the theoretical framework ... 92
2.21 Establishment of research reasoning approach ... 94
2.22 Research framework for evaluation of relevance of lean thinking ... 96
2.23 Justification of the study area ... 97
2.24 Summary ... 101
CHAPTER 3 ... 102
RESEARCH DESIGN AND METHODOLOGY ... 102
3.1 Introduction ... 102
3.2 Research design ... 102
3.3.1 The positivism tradition ... 104
3.3.2 The interpretivism tradition... 104
3.4 Research paradigms ... 105
3.4.1 Ontology ... 105
3.4.2 Epistemology ... 106
3.4.3 Axiology ... 106
3.5 Selection and justification of the research philosophy ... 107
3.6 Research approach ... 108
3.7 Research method ... 109
3.7.1 Qualitative method ... 109
3.7.2 Quantitative method ... 110
3.7.3 Mixed methods approach ... 110
3.7.4 The importance of the quantitative method to this research ... 110
3.8 Research techniques ... 111
3.8.1 Survey research technique... 111
3.8.2 Direct observation ... 112
3.8.3 Archival or document review ... 112
3.8.4 Adoption of cross-sectional technique for data collection ... 113
3.9 Research population and sample selected ... 113
3.9.1 Research population ... 114
3.9.2 Research sample frame ... 114
3.9.3 Research sample size... 114
3.9.4 Sampling technique for selection of respondents ... 115
3.9.5 Sample size calculator ... 115
3.10 Determinant variables adopted in this research ... 116
3.10.1 Variables adopted for RQ1 and test of H1 ... 116
3.10.3 Variables adopted for RQ3 and test of H3 ... 118
3.11 Development of the assessment framework ... 118
3.12 Sources of data ... 120
3.12.1 Primary data ... 120
3.12.2 Secondary data ... 121
3.12.3 Questionnaire design and pilot study ... 121
3.12.4 Instruments for data collection ... 123
3.13 Conditions for use of SEM AMOS ... 124
3.14 The preliminary data analyses using SPSS ... 125
3.15 Survey and analysis tools applied for RO1 ... 127
3.15.1 Method 1: Hassanain & Mudhei (2006) ... 128
3.15.2 Method 2: Hassanain (2008) and Adewunmi et al. (2012) ... 128
3.16 Survey and analysis tools applied for RO2 ... 129
3.17 Survey and analysis tools used for RO3 ... 130
3.18 Survey and analysis tools for RO4 ... 131
3.19 Standards used to measure the significance of lean thinking ... 131
3.20 Confirmatory factor analysis (CFA) for the measurement models... 132
3.20.1 Muda measurement models... 132
3.20.2 Job productivity (JBP) measurement models ... 139
3.20.3 Design features (DSF) measurement models ... 142
3.21 Test for unidimentionality, validity and reliability ... 145
3.21.1 Unidimensionality ... 146
3.21.2 Validity ... 147
3.21.3 Reliability ... 151
3.22 The assessment of normality for the data ... 152
3.23 Expected outcomes ... 153
3.25 Summary ... 155
CHAPTER 4 ... 156
DATA PRESENTATION AND ANALYSIS ... 156
4.1 Introduction ... 156
4.2 Description of the study area ... 156
4.3 Total survey response ... 158
4.4 The survey demographic statistics... 159
4.4.1 Gender distribution of respondents ... 159
4.4.2 Age distribution of respondents ... 160
4.4.3 Geo-political zones distribution of respondents ... 160
4.4.4 Ethnic group distribution of respondents ... 161
4.4.5 Educational levels of respondents ... 162
4.4.6 Religion distribution of respondents ... 163
4.4.7 Respondents’ duration in government service ... 163
4.4.8 Respondents’ duration in present office ... 164
4.4.9 Income groups of respondents ... 165
4.5 Area of investigation 1: Perceived muda ... 166
4.5.1 Respondents’ view on muda driver - Defect ... 166
4.5.2 Respondents’ view on muda driver - Inventory ... 173
4.5.3 Respondents’ view on muda driver - Waiting/Delay ... 176
4.5.4 Respondents’ view on muda driver - Motion ... 181
4.5.5 Respondents’ view on muda driver - Transportation ... 186
4.5.6 Respondents’ view on muda driver - Over-processing ... 190
4.5.7 Respondents’ view on muda driver – Overproduction ... 195
4.5.8 Respondents’ view on muda driver – Human Talent ... 201
4.5.9 Establishment of perceived muda ... 205
4.5.11 Summary of Area of investigation 1 ... 207
4.6 Area of investigation 2: Effects of muda on job productivity ... 208
4.6.1 Physical environment effect on perceived job productivity ... 208
4.6.2 Behavioural environment effect on perceived job productivity ... 217
4.6.3 Estimation of perceived job productivity on its sub-constructs ... 225
4.6.4 The regression weights in the structural model... 227
4.7 Area of investigation 3: Effect of muda on design features ... 229
4.7.1 Respondents’ perception of the spatial plan... 229
4.7.2 Respondents’ perception of the structure ... 232
4.7.3 Respondents’ perception of the facilities ... 236
4.7.4 Regression weights of sub-constructs in predicting design features .. 240
4.7.5 Causal effect of perceived muda on perceived design features ... 241
4.7.6 The test of hypothesis H3 ... 242
4.8 Area of investigation 4: Design feature(s) to minimize muda ... 242
4.8.1 Summary of respondents’ perception of design features ... 242
4.8.2 Respondents’ observations and requirements ... 243
4.8.3 Correlation between perceived job productivity and design features 245 4.8.4 The test of hypothesis H4 ... 246
4.9 Summary ... 246
CHAPTER 5 ... 247
IMPROVEMENT DIAGNOSIS TECHNIQUE FRAMEWORK ... 247
5.1 Introduction ... 247
5.2 The essence of the research re-visited ... 248
5.2.1 The establishment and ranking of perceived muda ... 248
5.2.2 The effect of perceived muda on perceived job productivity ... 250
5.2.3 The effect of muda on design features ... 252
5.3 Proposed building performance feature(s) improvement diagnosis ... 254
5.4 Summary ... 256
CHAPTER 6 ... 257
CONCLUSION AND RECOMMENDATIONS ... 257
6.1 Introduction ... 257
6.2 Summary of findings of the research... 257
6.3 Summary of research objectives (RO) ... 259
6.4 Conclusion ... 262
6.5 Contribution to knowledge ... 263
6.5.1 Theoretical contribution ... 263
6.5.2 Practical contribution ... 264
6.5.3 Contribution to facilities management ... 264
6.5.4 Contribution to government policy formulation ... 265
6.6 Limitations of the research ... 266
6.7 Recommendations ... 266
6.8 Areas for further research ... 267
6.9 Closure ... 268
REFERENCES ... 269
APPENDIX ... 300
LIST OF TABLES
2.1 Compilation of studies on SD in Nigeria 20
2.2 Compilation of past studies that used lean thinking 45 2.3 Application of muda drivers in past studies 47 2.4 Concept of muda adapted for public office buildings in research 48 2.5 Research approaches of the improvement concepts 51 2.6 Measures involved in the NBRI improvement criteria 54
2.7 Occurring changes in offices since the 1970s 55
2.8 Predicted and experienced comfort levels 60
2.9 Studies on unsatisfactory users’ requirement in sustainable buildings
61
2.10 A compilation of concepts used in assessing users’ requirement 62 2.11 Characteristics of change of users’ requirement 64
2.12 The 4 components of job productivity 74
2.13 Studies on sustainable improvement of office buildings 80 2.14 KPIs variables used in past studies for users’ requirement 83 2.15 Studies on sustainable improvement of office buildings 86 2.16 Past studies using muda for improvement purposes 91 2.17 Summary of research framework for the lean thinking approach 97
3.1 Contrasting positivism with interpretivism 105
3.2 Ontological, epistemological and axiological differences of research paradigms
107
3.3 Perceived job productivity sub-constructs 117
3.4 Design features sub-constructs 118
3.5 Reviewers of research questionnaire 122
3.6 Demographic data of the pilot study 122
3.7 Cronbach’s alpha internal consistency rating 126
3.8 The internal consistency test 126
3.10 Rate of satisfaction 129
3.11 Classification of effect sizes 131
3.12 Summary of FI for Defect (DEF) measurement model 133 3.13 Summary of FI for Inventory (INV) measurement model 133 3.14 Summary of FI for Waiting (WAT) measurement model 134 3.15 Summary of FI for Motion (MOT) measurement model 135 3.16 Summary of FI for Transportation (TRN) measurement model 136 3.17 Summary of FI for Over-processing (OPS) measurement model 137 3.18 Summary of FI for Over-production (OPN) measurement model 138 3.19 Summary of FI for Human talent (HMT) measurement model 138 3.20 Summary of FI for Comfort (CFT) measurement model 139 3.21 Summary of FI for Office layout (OFL) measurement model 140 3.22 Summary of FI for Interaction (INT) measurement model 141 3.23 Summary of FI for Distraction (DST) measurement model 142 3.24 Summary of FI for Spatial layout (SPL) measurement model 143 3.25 Summary of FI for Structure (STR) measurement model 144 3.26 Summary of FI for Facilities (FAC) measurement model 145 3.27 CFA results for all the measurement models after modification 146
3.28 CR and AVE formulas 147
3.29 Fitness Indexes category and level of acceptance 148 3.30 Summary of FI for all construct measurement models 149 3.31 The discriminant validity index summary for all the constructs 150 3.32 The assessment of normality for items in the respective constructs 152
4.1 Constructional details of the study area 158
4.2 Total field survey response 158
4.3 Gender statistics of respondents 160
4.4 Age distribution of respondents 160
4.5 Zones of respondents within the country 161
4.6 Ethnic groups of respondents 162
4.7 Educational levels of respondents 162
4.8 Religion of respondents 163
4.9 Respondents’ duration in government service 163
4.11 Respondents’ gross monthly incomes 165 4.12 Degree of satisfaction for muda driver - Defect 167 4.13 Rate of satisfaction for muda driver - Defect 167 4.14 Fire safety design concerns in office structures 173 4.15 Degree of satisfaction for muda driver - Inventory 173 4.16 Rate of satisfaction for muda driver - Inventory 174 4.17 Degree of satisfaction for muda driver - Waiting 177 4.18 Rate of satisfaction for muda driver - Waiting 177 4.19 Degree of satisfaction for muda driver - Motion 182 4.20 Rate of satisfaction for muda driver - Motion 182 4.21 Degree of satisfaction for muda driver - Transportation 186 4.22 Rate of satisfaction for muda driver - Transportation 186 4.23 Degree of satisfaction for muda driver - Over processing 190 4.24 Rate of satisfaction for muda driver - Over processing 191 4.25 Degree of satisfaction for muda driver - Over production 195 4.26 Rate of satisfaction for muda driver - Over production 195 4.27 Required number of toilets and washbasins for mixed use 199 4.28 Degree of satisfaction for muda driver - Human talent 202 4.29 Rate of satisfaction for muda driver - Human talent 202
4.30 Summary of FI for muda constructs 205
4.31 The regression weights and P-value of sub-constructs in predicting muda
206
4.32 Range and interpretations of effect sizes (R2) 206 4.33 SI and muda ranking based on βeta coefficients 207
4.34 Comfort parameters with their mean scores 209
4.35 Office layout parameters with their mean scores 213 4.36 Interaction parameters with their mean scores 217 4.37 Distraction parameters with their mean scores 221 4.38 Respondents’ perception of perceived job productivity
sub-constructs
225
4.39 Summary of FI for perceived job productivitysub-constructs 226 4.40 Effect of perceived Job Productivity on sub-constructs and
significance
4.41 Summary of FI for the structural model 227 4.42 The regression weights and paths of constructs in the structural
model
228
4.43 The causal effect of muda on perceived job productivity 228
4.44 Respondents’ perception of spatial plan 229
4.45 Respondents’ perception of structure 233
4.46 Respondents’ perception of facilities 237
4.47 Summary of FI for design featuresconstructs 241 4.48 The regression weights of sub-constructs in predicting design
features
241
4.49 The causal effect of perceived muda on design features 242 4.50 Summary of respondents’ perception of design features 243
4.51 Respondents comments on spatial plan 243
4.52 Respondents comments on structure 243
4.53 Respondents comments on facilities 243
LIST OF FIGURES
2.1 Typical issues and criteria comprising SD in office building 16
2.2 Overlapping TBL components of SD 17
2.3 Classifications of building maintenance 24
2.4 Building maintenance vs. improvement 25
2.5 Building improvement effect on job productivity 26
2.6 The range of building adaptation strategies 28
2.7 Poor state of Nigerian public office buildings in use 33
2.8 Effect of poor maintenance culture in Nigerian public office 33
2.9 Factors influencing building improvement 36
2.10 Integrated ZE building concept 38
2.11 Key components of green building 39
2.12 Five steps to effective muda reduction or elimination 44 2.13 Office environment and job productivity relationship 57 2.14 Current and proposed role of FM in building design 58
2.15 Campaign posters for disabled people 71
2.16 IEQ and users well-being/productivity structure 72 2.17 Theoretical framework for perceived job productivity 74
2.18 Types of POE 79
2.19 Legislation as the driver of SD 85
2.20 Typical office building improvement diagnosis 87
2.21 Research deductive approach from literature 90
2.22 Deductive and inductive approaches 94
2.23 Outline of current research framework based on deductive reasoning
95
2.24 Concept of lean improvement 96
2.25 Federal secretariat office complex, Bauchi 98
2.26 Left wing internal view 98
2.28 Middle wing internal view 98
2.29 Unkempt toilet within the complex 98
2.30 Location of Bauchi in Nigeria 99
3.1 Nested research methodology 103
3.2 The research onion model 103
3.3 Research approaches continuum 108
3.4 Philosophical views and research paradigm for current research 109
3.5 Research questions formulating process 110
3.6 Proposed scope of research 111
3.7 Data collection and analysis techniques 113
3.8 Sample size graph 116
3.9 Determinant KPIs and muda drivers adopted for RQ1 and H1 116
3.10 Determinant variables adopted for RQ2 and H2 117
3.11 Determinant variables adopted for RQ3 and H3 118
3.12 Research framework to evaluate the significance of lean thinking 119 3.13 Theoretical framework relating all research variables 120
3.14 Sources of data collection 121
3.15a Defect (DEF) construct before modification 132
3.15b Defect (DEF) construct with good FI after modification 133 3.16 Inventory (INV) construct with good FI at first run 133 3.17a Waiting (WAT) construct before modification 134 3.17b Waiting (WAT) construct with good FI after modification 134
3.18a Motion (MOT) construct before modification 135
3.24b Office layout construct with good FI after modification 140 3.25a Interaction (INT) construct before modification 141 3.25b Interaction (INT) with good FI after modification 141
3.26a Distraction construct before modification 142
3.26b Distraction (DST) construct with good FI after modification 142 3.27a Spatial layout (SPL) construct before modification 143 3.27b Spatial layout (SPL) with good FI after modification 143 3.28a Structure (STR) construct before modification 144 3.28b Structure (STR) construct with good FI after modification 144 3.29a Facilities (FAC) construct before modification 145 3.29b Facilities (FAC) construct with good FI after modification 145
3.30 Covariance of all constructs with good FI 149
3.31 Accomplishment of the research process 154
4.1 2-Storey floor section from outside the building 157 4.2 2-Storey floor section from inside the building 157
4.3 Typical 2-flight staircase between floors 157
4.4 Section of car parking within the complex 157
4.5 Circulation route with handrails 157
4.6 Glazed top-hanging rear office windows 157
4.7 Typical louvre windows and flush door 157
4.8 Terrazzo tiles in circulation routes 157
4.9 Total survey response 159
4.10 Gender distribution of respondents 159
4.11 Age distribution of respondents 160
4.12 Geo-political zones distribution of respondents 161
4.13 Ethnic groups of respondents 161
4.14 Educational achievements of respondents 162
4.15 Religion of respondents 163
4.16 Respondents’ duration in government service 164
4.17 Respondents’ duration in present office 164
4.18 Respondents’ gross monthly incomes 165
4.19 Responses to defect driver 167
4.21 Responses to level of acoustical comfort 169
4.22 Responses to level of ventilation 169
4.23 Response to level of provision for the disabled 170
4.24 Usable landing width reduced by balustrade 171
4.25 Responses to level of car parking facility 172
4.26 Responses to level of fire safety measures 172
4.27 Responses to inventory driver 174
4.28 Responses to storage facility 174
4.29 Responses to type of materials stored 175
4.30 Responses to durability of materials stored 176
4.31 Responses to availability of materials 176
4.32 Responses to waiting/delay driver 177
4.33 Responses to access to hidden works 178
4.34 Responses to increased maintenance cost 179
4.35 Responses to identification of faults 179
4.36 Responses to damage to building fabrics 180
4.37 Responses to disruption in general services 181
4.38 Responses to motion driver 181
4.39 Responses to movement in offices 182
4.40 Responses to office ergonomics 183
4.41 Guide to office ergonomics 183
4.42 Good ergonomics positions 184
4.43 Responses to office size in relation to furniture 184 4.44 Responses to office size in relation to operation 185 4.45 Responses to overall comfort in relation to health 186
4.46 Responses to transportation driver 187
4.47 Responses to distance to complimentary offices 187
4.48 Responses to orientation of offices 188
4.49 Responses to circulation routes 189
4.50 Rain water accumulation on circulation route 189
4.51 Rain water accumulation on staircase 189
4.52 Responses to location of ancillary rooms 190
4.54 Responses to quality of openings in the complex 192
4.55 New prefab doors at the complex 192
4.56 Responses to wall finish in the complex 193
4.57 Responses to ceiling finish in the complex 193
4.58 Responses to electrical and mechanical fittings 194 4.59 Responses to overall finish quality in the complex 195
4.60 Responses to overproduction driver 196
4.61 Responses to office shape in the complex 196
4.62 Responses to quality of toilet facilities 1
4.63 Poor condition of WHB 197
4.64 Evidence of broken WHB 197
4.65 WC without seat covers 198
4.66 Leakages in toilets 198
4.67 Leaking plumbing installation in toilet 198
4.68 Poor toilet facility 198
4.69 Responses to adequacy of toilets facilities 199
4.70 Responses to personal storage facilities 200
4.71 Responses to intranet and internet facilities 201
4.72 Responses to human talent driver 201
4.73 Responses to involvement in past POEs 202
4.74 Responses to involvement in other user survey 203 4.75 Responses to contribution to maintenance policy 204
4.76 Responses to control over natural elements 204
4.77 Regression weights of sub-constructs predicting muda 205 4.78 Effect of natural illumination on job productivity 209 4.79 Effect of office temperature on job productivity 210 4.80 Effect of office cleanliness of job productivity 211
4.81 Effect of office décor on job productivity 212
4.82 Effect of security facilities on job productivity 212 4.83 Effect of storage facilities on job productivity 214 4.84 Office ergonomics effect on job productivity 214
4.85 Effect of office size on job productivity 215
4.87 Effect of circulation routes on job productivity 216 4.88 Effect of social interaction on job productivity 218 4.89 Effect of work interaction on job productivity 218 4.90 Effect of aesthetics qualities on job productivity 219 4.91 Effect of refreshment areas on job productivity 220 4.92 Effect of creative environment on job productivity 220
4.93 Effect of noise on job productivity 221
4.94 Effect of toilet sanitation on job productivity 222
4.95 Effect of overall IAQ on job productivity 223
4.96 Effect of downtime frequency on job productivity 224 4.97 Effect of erratic power supply on job productivity 224 4.98 Regression weights of drivers predicting perceived job
productivity
226
4.99 The proposed structural model showing causal effects of muda 227
4.100 Respondents’ perception of offices design 230
4.101 Respondents’ perception of offices layout 230
4.102 Perception of ancillary rooms design 231
4.103 Perception of ancillary rooms’ layout 232
4.104 Perception of building design 232
4.105 Respondents’ perception of walls 233
4.106 Respondents’ perception of floors 234
4.107 Respondents’ perception of windows 235
4.108 Responses to doors in the complex 235
4.109 New prefab door at the complex 236
4.110 Respondents’ perception of ceiling 236
4.111 Respondents’ perception of water supply 237
4.112 Typical condition of toilet in the complex 238
4.113 Unkempt toilet in the complex 238
4.114 Respondents’ perception of electricity supply 238
4.115 Perception of intranet/internet facilities 239
4.119 Users’ requirement by design feature themes 244 4.120 Correlation between job productivity and design features 245
5.1 The research questions 247
LIST OF ABREVIATIONS
AED - Advanced English Dictionary, 2014 edition ACSI - American Customers Satisfaction Index AGFI - Adjusted Goodness Fit Index
AMOS - Analysis of Moments Structures
ASHRAE - American Society of Heating, Refrigerating and Air-Conditioning Engineers
AVE - Average Variance Extracted
BEAM - Building Environmental Assessment Method (HK) BQA - Building Quality Assessment
BREEAM - Building Research Establishment Environmental Assessment Method (UK)
BS - British Standard
BUS - Building Use Studies
CASBEE - Comprehensive Assessment System for Built Environment Efficiency (Japan)
CFA - Confirmatory Factor Analysis CFI - Comparative Fit Index
Chisq - Discrepancy Chi square
Chi/df - Chi Square/Degree of Freedom
CO2 - Carbon-Dioxide
CR - Composite Reliability
EPIQR - Energy Performance Indoor Environmental Quality Retrofit
EU - European Union
FESTAC - Festival of Arts and Culture FHA - Federal Housing Authority
FI - Fitness Index(es)
FM - Facilities Management
GBL - Green Building Labels (China) GFI - Goodness of Fit Index
GHG - Green House Gases
GS - Green Stars (Australia)
HK - Hong Kong, China
IAQ - Indoor Air Quality
IEQ - Indoor Environmental Quality
JIT - Just in Time
KPIs - Key Performance Indicators KSA - Kingdom of Saudi Arabia
LEED - Leadership in Energy and Environmental Design (USA)
MD - Managing Director
MSDs - Musculoskeletal Disorders
NBRI - Norwegian Building Research Institute
NFI - Normed Fit Index
NRC - Noise Reduction Coefficient
PG - Post Graduate
POE - Post-Occupancy Evaluation
PROBE - Post-occupancy Review Of Buildings and their Engineering (UK)
PVC - Polyvinyl Chloride
Rio + 20 - Twenty years after the UN 1st Earth Summit of 1992 in Rio de Janeiro, Brazil
RMSEA - Root Mean of Error Approximation
SD - Sustainable Development
SEM - Structural Equation Modelling
SERVPERF - Service Performance User Survey Tool SERVQUAL - Service Quality User Survey Tool SI - Satisfaction Index
SPSS - Statistical Package for the Social Sciences STC - Sound Transmission Class
TLI - Tucker-Lewis Index
TOBUS - Tool for Office Building Upgrading Solutions TQEM - Total Quality Environmental Management
UK - United Kingdom
UN - United Nations
UNESCO - United Nations Educational, Scientific and Cultural Organization
USA - United States of America
WC - Water Closet
WCED - World Commission on Environment and Development
WHB - Wash (Hand) Basin
LIST OF APPENDICES
APPENDIX TITLE PAGE
A Publications and conference paper related to the thesis 300 B Cadre of respondent civil servants at study area 301
C Research questionnaire 302
D Data Code Book 309
E Normal P-P plot of regression between job productivity dependent sub-constructs and lean independent variables
311
F Normal P-P plot of regression between design features dependent sub-constructs and lean independent variables
313
G Normal P-P plot of linear regression between 2nd order constructs of job productivity and muda
315
H Normal P-P plot of linear regression between 2nd order constructs of design features and muda
316
I Correlation of the 8 muda sub-constructs with good FI 317 J Correlation of the 4 job productivity sub-constructs with
good FI
318
K Correlation of the 3 design featuressub-constructs with good FI
319
L Compilation of Nigeria public office buildings in publication
320
DEFINITION OF KEY TERMS
The following terms were defined as used in this research:
1. Sustainable Development (SD) was defined as humanity’s ability to meet the needs of the present without compromising the ability of future generations to meet their own needs (WCED, 1987).
2. Improvement is an intervention work carried out on existing buildings in an attempt to upgrade or update them to modern standards whilst retaining their current use (Marir & Watson, 1995); thus a condition superior to an earlier condition (AED, 2014). The synonyms used for improvement include refurbishment, adaptation, retrofitting, rehabilitation, remodeling, revitalization, modernization, upgrade, among others.
3. Maintenance: In the context of this research, maintenance had been limited to restoring, holding, keeping, sustaining or preserving the building or structure to its original design standard (Adeyemi, 2010).
4. Waste and Inefficiencies which were collectively referred to as muda (in Japanese), are facilities which absorb resources but create no value from end-user’s standpoint (Womack & Jones, 2005). Waste in addition means excesses (or immoderations) that are not appreciated by end-users (Nicholas & Soni, 2006); while inefficiencies are related to inadequacies or ineffectiveness (Sharp & Jones, 2012).
5. Triple Bottom Line (TBL) comprises the environmental, economic and social factors (or three pillars) that constitute effective SD (Wilkinson, 2012).
6. Key Performance Indicators (KPIs) are performance assessment or diagnosis factors used to make vital future decisions for continuous and consistent improvement of existing buildings (Cohen et al., 2001).
8. End-users are defined as the people who use or occupy the building; they are not experts in managing it, but have knowledge and opinions, nonetheless, about its performance in relation to their own objectives (Pemsel et al., 2010). 9. Comfort was defined in this research as the absence of unpleasant sensations, which has a positive effect on human well-being (Feige et al., 2013). It is seen as a key determinant of end-users’ requirement.
10.Job productivity in this research is defined and limited to the level of workers’ performance as related to their official assignment in the office (Haynes, 2007a). According to Smith & Pitt (2011), it is the quintessence of an office. 11.Causal effect (also referred to as causation or causality) is the relation between
the independent variable (the cause) and the dependent variable (the effect), where the independent variable is understood to be responsible for the dependent variable (Pallant, 2011).
12.R2 or Effect size tells the magnitude or strength of the effect of a variable. It explains the percentage of variability in the dependent variable, which is accounted for by the independent variable (Adams & Lawrence, 2015). 13.Practical significance (or P-value) refers to the usefulness of the research
results or findings i.e. how the result affect or apply to daily life (Adams & Lawrence, 2015).
14.Standardized coefficients means that the estimates for each of the different variables have been converted to the same scale so that they can be compared (Pallant, 2011).
CHAPTER 1
INTRODUCTION
1.1 Background to the research
The improvement of old buildings from existing asset for sustainability is termed sustainable improvement (Mansfield, 2011; Wood & Muncaster, 2012), and it is an offshoot of Sustainable Development (SD), which was defined as the ability to meet the needs of the present users without compromising the ability of future generations to meet theirs (WCED, 1987). In a bid to reach the goal of environmental sustainability, the UN Earth Summit of 1992 in Rio de Janeiro, Brazil called on member States to adopt and integrate the principles of SD into their national policies and programmes which would build upon and harmonize the various sectoral economic, social and environmental policies and plans operating in their respective countries. In 1997, the special session of the UN General Assembly set a target in the United Nations Millennium Declaration, to formulate and elaborate by year 2002. However, over twenty years after the Earth Summit (termed Rio + 20) many countries, especially the developing countries, were yet to make significant headway in the quest for SD of their built environment. Wood & Muncaster (2012) observed that the developed countries have in common, huge numbers of buildings built to standards that were barely adequate in their day and inadequate for the present and future, and that those in the developing countries are even apparently worse.
Thus, for any noteworthy impact on SD in the built environment, particularly in developing countries, it is essential that existing buildings be given due attention. Zavadskas, Kaklauskas & Gulbinas (2004) opined that it is necessary to carry out an exhaustive investigation of all solutions that form an existing building in order to sustainably improve it; this will involve macro-level factors, incorporating the Triple Bottom Line (TBL) of SD and micro-level factors embracing Key Performance Indicators (KPIs). However, despite all these, it had been reported that many purported sustainably improved buildings do not adequately reflect end-users’ requirement, which is the quintessence of SD (Gou, Lau & Chen, 2012). According to Mickaityte et al. (2008), sustainable improvement is a significant problem in existing buildings.
Another reason is the use of top-down approach to policy formulation and eventual implementation in most developing countries (Jiboye, 2011b). The principle of delegation is that authority should be delegated as far down the line as possible (Martimort & Stole, 2002); an advantage of this is that those who are closest to the ‘scene of action’ may be regarded as the best persons to analyze and deal with the problems that arise (Jagoda, Lonseth & Lonseth, 2013).
Brandon & Lombardi (2010) estimated that 87% of existing buildings will still stand by 2050, which therefore goes without saying that existing buildings require effective sustainable improvement that will satisfactorily reflect end-users’ requirement, particularly in developing countries such as Nigeria with an estimated population of over 170 million people (National Population Commission, 2012), the 6th most populous country in the world, the most populous and largest economy in Africa (Chiejina, 2014). Jiboye (2009), observed that despite efforts at both the local and international levels, current realities suggest that the goal of achieving sustainability in Nigeria is yet unrealized.
Lean thinking is a philosophy of improvement (Bryde & Schulmeister, 2012; Samuel, Found & Williams, 2015), with the underlying principle that by identifying and eliminating muda, standard (hence performance) can be improved to meet end-users’ requirement at reduced cost (Averill, 2011; Kempton, 2006). According to Lamb (2011), lean determines what is truly important to the end-user and consequently reshapes to deliver it; along the way, muda drops out. Womack & Jones (1996) introduced lean thinking principles as applicable beyond manufacturing environment (from whence it was conceived) into any field, while Schipper & Swets (2010) opined that muda is universal, appearing in every situation and remain constant.
In summary therefore, the research explored the feasibility of SD of the built environment in developing countries through the sustainable improvement of existing buildings, which were constructed when sustainability was not a concern but form the bulk of existing assets. The sustainable improvement concept of lean thinking, which involves the identification of muda can thus be applied for enhanced assessment of users’ requirement and promotion of the bottom-up approach principle of delegation, and thus integrated end-users into SD as stake-holders. This is consistent with the definition of SD as meeting the needs of the present, accordingly the research considered the need to meet end-users’ requirement for sustainability.
1.2 The problem statement
comfort; prolongs buildings life cycle, increases value of the buildings, reduces negative impact to environment and guarantees healthy living and working conditions (Mickaityte et al., 2008). Thus the satisfaction of these requirements is obligatory in sustainable improvement of existing buildings provision. Over the years therefore, systematic methods for sustainable building improvement studies were developed, which include: Energy Performance Indoor Environmental Quality Retrofit (EPIQR), for residential apartments (Zavadskas et al., 2004) and Tool for Office Building Upgrading Solution (TOBUS) for office buildings (Flourentzou, Genre & Roulet, 2002). The methods incorporated relevant micro and macro factors (i.e. KPIs and TBL components) into the models for reliable diagnosis and decision-making for sustainable improvement.
In Nigeria as in most other countries, the sustainable improvement of existing buildings’ standards (hence the performance) had been mainly through retrofitting for energy and GHG emissions reduction, incorporating the KPIs parameters as related to the TBL factors of SD, for reliable diagnosis and decision-making (Ofori, 2000; Nwafor, 2006; Haddad, 2010; Nwokoro & Onukwube, 2011; Ma et al., 2012); nonetheless SD in the built environment is still a far cry, especially in Nigeria (Nwokoro & Onukwube, 2011; Emmanuel, Ibrahim & Adogbo, 2014; Oribuyaku, 2015), as in most developing countries (Jiboye, 2009; Haddad, 2010; Wood & Muncaster, 2012). Studies had also shown that purported sustainably improved buildings’ performance had not adequately reflected end-users’ requirement (Schakib-ekbatan, Wagner & Lussac, 2010; Wilkinson, Reed & Jailani, 2011; Monfared & Sharples, 2011; Deuble & de Dear, 2012).
Love & Bullen (2009) opined that current assessment systems of performance of existing buildings pose challenging problems because they do not provide a full profile of sustainability since they excluded major inputs from end-users. Hence, the question that had risen is – how can existing building improvement diagnosis technique enhance the assessment of users’ requirement for sustainability in developing countries? Literature research revealed 3 sustainable improvement concepts that have proven successful in their varied areas of application, namely: Lean Thinking, Green Building and Zero Emissions; and although they all laid emphasis on the elimination or minimization of muda as the primary basis for improvement, only Lean thinking laid additional emphasis on end-users’ perspective and all the TBL factors. Jylhä & Junnila (2014) opined that the ultimate goal is to produce and deliver end-users’ requirement, which only the end-users themselves can define.
The problem statement therefore is – “Can lean thinking approach enhance the assessment of users’ requirement in sustainable improvement diagnosis technique for public office buildings?” Mickaityte et al. (2008), opined that with the SD principles reaching many spheres of human activities, the improvement of public buildings should not be an exemption. Thus, for sustainable improvement to be achieved, perceived muda inherent in existing buildings should be identified from the end-users’ perspectives, since their contributions were not initially taken into consideration (Majamaa et al., 2008; Pemsel et al., 2010) after which intervention measures should be well-thought-out to improve the original building standard by way of possibly eliminating or minimizing perceived inherent muda; thereby enhancing building performance. Muda is perceived in the sense that it is detected by instinct or inference of the respondents (i.e. occupants) rather than by recognized perceptual hints.
1.3 Aim of the research
The research aimed at the enhancement of users’ requirement for sustainable improvement of public office buildings from occupants’ perspective using the lean thinking approach, with a view to propose way(s) to generate more sustainable buildings from existing asset in developing countries with Nigeria as an example.
1.4 Research questions (RQs)
In order to achieve the above aim, the following research questions were raised: 1. What are the perceived muda inherent in existing public office buildings in
Nigeria from occupants’ standpoint?
2. How has the perceived muda affected perceived job productivity from occupants’ standpoint?
3. How has the perceived muda affected existing public office buildings design features from occupants’ standpoint?
4. How can the public office buildings’ standard be sustainably improved through the elimination or minimization of the perceived muda and guard against in future designs?
1.5 Research objectives (ROs)
The following objectives were developed to answer the above research questions: 1. To establish perceived muda inherent in the public office buildings in Nigeria
from occupants’ standpoint;
2. To evaluate the effect of the perceived muda on perceived job productivity from occupants’ standpoint;
3. To evaluate the effect of perceived muda on existing public office buildings’ design features from occupants’ standpoint; and
1.6 Research hypotheses
The following hypotheses were generated alongside the RQs during the literature review in the succeeding chapter to test the research objectives:
H1 - Perceived muda is significantly inherent in public office buildings.
H2 - Perceived muda has a significant effect on perceived job productivity;
H3 - Perceived muda has a significant effect on design features; and
H4 - There is significant relationship between perceived job productivity and
design features.
1.7 Scope of the research
This research examined existing public office buildings and their role in SD through the sustainable improvement (as against maintenance) of their standards. In maintenance, the original standard at construction is restored, while in improvement, the original standard is upgraded, hence maintenance carried out on non-sustainable existing building can at best reinstate it to its original non-sustainable standard (refer Figure 2.4 in section 2.5). The definition of improvement adopted is a condition superior to an earlier condition (AED, 2014), it thus promotes the virtues of a more positive outlook that starts with what had been inherited from the past, how to realize its value and improve on it, but was restricted to the lean thinking approach to sustainable improvement diagnosis of existing public office buildings for enhanced assessment of users’ requirement from occupants’ perspective.
office complex was also selected because of the circumstances surrounding it and the researcher’s in-depth local knowledge of it (Yin, 2013; Creswell, 2014).
The Post-Occupancy Evaluation (POE) tool was adopted for acquiring data from occupants (as end-users), and related to the SD triple bottom line (TBL) factors of environmental, economic and social dimensions (Zheng, Shen & Wang, 2014; Bond, Pope & Morrison-Saunders, 2015), but limited to:
(a) The ‘environment’ covering issues, which include temperature, ventilation, air quality, glare, daylight and noise (Kim et al., 2012; Bluyssen, 2014).
(b) The ‘economy’ covered issues of occupants’ satisfaction and comfort through the provision of adequate space, services and facilities thereby increasing job productivity. A leading argument for economic sustainability is the belief that sustainable buildings are healthier and lead to job satisfaction, less employee absenteeism and higher levels of productivity thereby boosting the overall profitability of business occupiers (Wilkinson et al., 2011; Bluyssen, Aries & Van Dommelen, 2011; Olanrewaju, 2012). Satisfaction with the physical working environment was suggested to be directly related to job productivity (Warr, 2011; De Been & Beijer, 2014).
(c) The ‘social’ covered the issue of aesthetics; where buildings having pleasing aesthetic qualities with prompt repair and regular upkeep, enhancing their surroundings, security, health and the well-being of humans (Wilkinson et al., 2011; Akadiri, Chinyio & Olomolaiye, 2012).
The research dwelt only on the building superstructure i.e. that part of the building which is above the ground and serves the purpose of the building’s intended use (Pemsel et al., 2010).
1.8 Research methodology
the R2 (or effect size), which explains the variances of the constructs; and the P-value, which indicates practical significance, were used as standards of measurement (Adams & Lawrence, 2015) to determine the significance of the lean thinking approach, with respect to the research question, objectives and hypotheses.
The diagnostic POE tool adopted for this research has its working depth limited to the systematic evaluation of opinion to determine perceived muda in the building and its effects on perceived job productivity and design features from end-users’ perspective through questionnaires, in order to assess how well the building match their satisfaction, expectancies and needs, and identifies ways to sustainably improve the building standard, performance and fitness for purpose (Fennimore, 2013).
1.9 Significance of the research
It is hoped that the findings of this research will highlight perceived muda inherent in existing public office buildings and its impact on perceived job productivity and design features from occupants’ standpoint, and further expose feature(s) to be incorporated in future designs with a view to eliminate muda inherent in public office buildings based on performance metrics. The research would thus allow public office stakeholders, including government policy-makers and lawmakers; and designers/ developers to better understand the optimal type and level of sustainability to be incorporated into public office buildings, as enumerated below:
1.9.1 Enhanced assessment of users’ requirement in public office buildings
1.9.2 Enhancement of public office buildings and job productivity
The research will provide information to developers as to the actual occupants’ requirements in public office buildings: it is expected that future design of sustainable office buildings with adequate provision for users’ requirement will enhance building performance with respect to acoustic; thermal; day-lighting; air/ventilation qualities; and support services, to produce healthier buildings which will lead to user satisfaction, less employee absenteeism, less distraction at workplace, and higher levels of job productivity thereby boosting the overall productivity of public office occupiers. A benefit of sustainable buildings includes increased productivity, less absenteeism and less churn rates than non-sustainable buildings.
1.9.3 Generation of sustainable buildings from existing asset
This research will also promote the virtues of a more positive outlook that starts with what has been inherited from the past, how to realize its value, and how to improve on it, thus enhancing the generation of more sustainable public office buildings from existing asset in developing countries. This is a promotion of conversion of common resources, whereby we do not deprive future generations by spending more resources than necessary today as implied in SD. Any serious impact on SD should involve giving more consideration to existing buildings.
1.9.4 Guide to office building designers on aesthetics and functionality
1.9.5 Promotion of bottom-up approach to policy formation
Again, the research would promote a system of “Bottom-up” approach to policy formulation and subsequent implementation as against the ‘Top-down” approach prevalent in many developing countries. Delegation is essential in any organization, because those who are closest to the scene of action may be regarded as the best persons to identify the problems that arise, while considerable times may be saved by not sending information up and down the reporting authority line.
1.9.6 Participatory multi-stakeholder approach to SD
Sixthly, the research re-envisaged building improvement by putting people, rather than buildings, at the center of considerations. The roles of end-users in SD is highlighted as they make contributions to building designs, thus promoting synergy of more stakeholders in which each contributes discipline-specific data in the built environment as against far narrower definition of success by different individual participants. The integration of multi-disciplinary activities within the built environment in facilities management will also involve facilities managers who are more conversant with the end-users, after other professionals have ceased to be involved in the building immediately after the construction activities. The TBL factors of social, economic and environmental issues surrounding infrastructure in the new millennium are increasingly becoming too complex to be left to the engineering community alone, and concluded that by necessity, there is need for multi-stakeholder and interdisciplinary collaborative approach to solving these problems.
1.9.7 Guide for SD laws and regulations formulation
be seen as the driver of SD on which the success of the TBL rest. During the preliminary research survey, it was discovered that SD legislations were not available in Nigeria.
1.10 Structure of the thesis
This thesis is structured into 6 chapters as follows: Chapter 1 accentuates SD and the need to address existing buildings in developing countries for sustainability, especially in the quest for enhanced assessment of users’ requirement. The aim and objectives of the research as derived from the research problem and questions were therefore geared towards sustainable improvement diagnosis technique for existing public office buildings for enhanced assessment of users’ requirement from occupants’ perspective. The chapter includes the research motivation, the research scope, brief research methodology, and the significance of the research.
Chapter 2 is a literature review of relevant literature on the research topic as related to the research questions, aim and objectives. It reviewed the concepts of SD generally, and relevant previous works on SD in Nigeria; concept of lean thinking and muda in existing buildings; distinction between concepts of maintenance and improvement; users’ requirement; KPIs; perceived job productivity and design features parameters; and POE. The research gap and the development of the theoretical framework for the research were developed in the chapter. The chapter also justified the adoption of the lean thinking concept, and concluded with the justification of the choice of the study area for the research. Chapter 3 was dedicated to the research design and methodology. The chapter justified the adoption of the positivism philosophy and quantitative method adopted for the research and also provided information on the research population and sample size. The chapter also established the determinant variable and assessment framework, while the survey and analysis tools, standard of measurement adopted and the confirmatory factor analysis conducted were discussed, together with the expected outcomes.
muda inherent in public office buildings, with its effect on perceived job productivity and design features, and proposed the design feature(s) needing dire improvement in public office buildings. Chapter 6 is the conclusion and recommendations and includes the research’s contributions to practice and knowledge.
1.11 Summary
CHAPTER 2
LITERATURE REVIEW
2.1 Introduction
This chapter reviewed the literature of major concepts and previous works in the field of sustainable improvement of standards of existing office buildings, which include the application of the SD concept; concept of maintenance and its limited application to standards upgrade vis-à-vis concept of improvement; importance of existing buildings to sustainability; sustainable improvement concepts, including Lean thinking, Zero Emissions and Green Building; users’ requirement and satisfaction; key performance indicators (KPIs); perceived job productivity; design features; post-occupancy evaluation (POE); and the role of legislation in SD. The research gap was established in the chapter, as well as the sketching of the composition of the research framework to determine the significance of lean thinking approach to sustainable improvement diagnostic technique of existing public office buildings in Nigeria. The justification and adoption of the theoretical research framework, the determinant variables and the study area were also discussed in this chapter.
2.2 The concept of sustainable development
The SD concept came into general usage following the publication of the 1987 report of the UN Brundtland Commission – formally called World Commission on Environment and Development (WCED). According to the report (WCED, 1987):
environmental resources and by the ability of the biosphere to absorb the effects of human activities. But technology and social organization can be both managed and improved to make way for a new era of economic growth... Yet in the end, sustainable development is not a fixed state of harmony, but rather a process of change in which the exploitation of resources, the direction of investments, the orientation of technological development, and institutional change are made consistent with future as well as present needs. (p 15)
2.2.1 Perceptions of the concept and definition of SD
Ofori (2000) observed that SD has emerged as a guiding paradigm to create a new kind of built environment, while Kibert et al. (2000) opined that the creation, operation and disposal of the built environment dominated humanity’s impact on the natural world. Several other definitions were given to explain this concept; one of such by Mediawiki (2008) defined SD as the process of building communities and living comfortably without consuming all resources, implying that SD is a way of conserving common resources; not just about consummation, but includes change in our culture to make conservation a way of life. Brandon (2012) considered SD as a process of change in which exploitation of resources, the direction of investments, the orientation of technological developments and institutional change are all in harmony, enhancing current and future potential to meet human needs and aspirations.
Slessor, cited in Abley & Heartfield (2001) suggested that the Bruntland’s commission definition only serves as a starting point and hardly sufficed as an analytical guide or policy directive. Hartshorn et al. (2005) went on to explain that a particular difficulty with the considerable disagreement over its precise meaning is that it combined unresolved political, philosophical and technical issues from the ‘environment versus growth’ debate.
Based on the ongoing debate as to the suitable definition for SD, this research had adopted the WCED (1987) definition in its face value which is “the ability to make development sustainable to ensure that it meets the needs of the present without compromising the ability of future generations to meet their own needs” and related it to the ability to conservatively meet users’ requirement in existing public office buildings. In spite of the supposed imprecision in its meaning, McLennan (2004) believes that SD is an improvement philosophy that seeks to maximize the quality of the
built environment.
2.2.2 The Triple Bottom Line (TBL) of SD
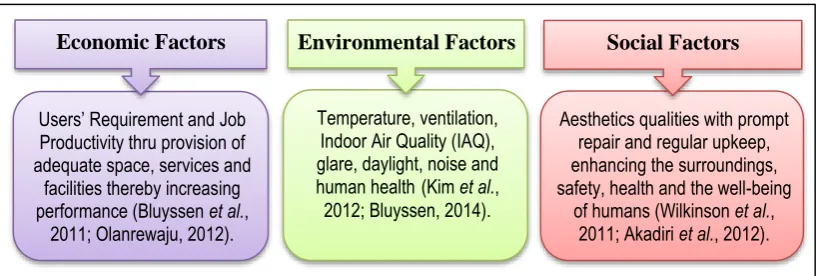
[image:51.595.115.526.584.722.2]Zheng et al. (2014) opined that no matter what conceptualization of sustainability is applied, the consensus from literature suggests that SD has 3 pillars, namely: social, economic, and environmental, which are termed the Triple Bottom Line (TBL) as illustrated in Figure 2.1, which has become the popular approach to achieving a more sustainable society in most contexts. According to Meir et al. (2009), users may either be satisfied or otherwise with a building depending on the balance of incorporation of the TBL in the sustainable improvement design.
Figure 2.1: Typical issues and criteria comprising SD in office building
Users’ Requirement and Job Productivity thru provision of adequate space, services and
facilities thereby increasing performance (Bluyssen et al.,
2011; Olanrewaju, 2012).
Temperature, ventilation, Indoor Air Quality (IAQ), glare, daylight, noise and human health(Kim et al., 2012; Bluyssen, 2014).
Aesthetics qualities with prompt repair and regular upkeep, enhancing the surroundings, safety, health and the well-being
of humans (Wilkinson et al., 2011; Akadiri et al., 2012).
Social Factors Environmental Factors
Gervásio & Simões da Silva (2012) opined that SD is a multidimensional concept gaining increasing relevance in all spheres of life which aimed to balance the social, economic and environmental impacts of all human actions, now and in the future. Wilkinson (2012) however observed that undoubtedly there is a strong and often overlapping relationship between the three components of the TBL (Figure 2.2).
Figure 2.2: Overlapping TBL components of SD (Adams, 2006)
2.2.3 Suggested practical approach to SD
There is harmony in literature that the same approach cannot be used universally to achieve SD, for example, Myllyla & Kuvaja (2005) argued that approaches to urban environment that have originated in a particular region carry inherently the region’s inferences and policy solutions that may have particular constraints when scrutinizing SD’s societal context in another region. Rana (2009) also observed that SD goals cannot be addressed the same way for all nations because of societal and cultural differences. He argued thus:
The remaking of a sustainable city is a great challenge, particularly in the cities… where urban population growth is unpredictable and even uncontrollable... the hope of fulfilling the goals by the developing countries is a utopia, where overwhelming rural-urban migration is uncontrollable, good governance is rare, unequal resources distribution is explicitly visible. In this unpredictable and complex situation, any goal-based development policies will certainly be misleading or partially achievable. Therefore, the same goal of sustainable city will not be suitable in quest of sustainability in all cities of the world, while societal and cultural resources are different. (p 506-507)
Zetter & Georgia (2006) also suggested sustainability through the integration of culture and the identity of a place into SD. This research therefore approached SD within the local setting, i.e. considering requirement from ethnic, culture, class, gender, etc. (Strzelecka, 2008) from occupants’ standpoint in a public office building in Nigeria, along the TBL factors, rather than straight adoption of global policies.
2.2.4 Past studies on SD in the built environment in Nigeria
The literature revealed that modest research in the field of SD in the Nigerian built environment had been done in spite of the dire necessity for it, while most of the studies were barely on the improvement of existing public office buildings for SD with respect to elimination of perceived muda.