Journal of Chemical and Pharmaceutical Research, 2016, 8(8):475-485
Research Article
CODEN(USA) : JCPRC5
ISSN : 0975-7384
Sequential optimization by statistical designs for levansucrase and levan
production by Bacillus subtilis M and its evaluation of antioxidant activity
Mona A. Esawy
1, Amal M. Hashem
1, Eman F. Ahmed
1*, Hanan A. A. Taie
2,
Abeer A. Abd El Aty
1, Bassem M. Salama
1, Amira A. Gamal
1and Ghada E. A. Awad
11Department of Chemistry of Microbial and Natural Products; National Research Center, Giza, Egypt
2Department of Plant Biochemistry-National Research Centre, Dokki, Cairo, Egypt
ABSTRACT
Among fifteen different nutritional factors, results of statistical analysis that obtained by Plackett– Burman design
showed that sucrose, ZnSO4 and MnSO4 were the most promising factors affecting levansucrase production by
Bacillus subtilis M with confidence levels more than 97%. For optimum concentrations of the selected variables,
central composite design (CCD) was applied. Variance analysis (ANOVA) showed a determination coefficient (R2)
value of 0.86 for levansucrase and 0.911 for levan production ensuring a satisfactory adjustment of the quadratic model with the experimental data. A high similarity was observed between the predicted and experimental results reflected the accuracy and model applicability for optimization. The correlation analysis showed that there was 83% correlation between levansucrase production and levan production yield. In compare to the basal medium, overall 7.58 and 7.82 folds increase in levansucrase and levan respectively. Investigation of in vitro levan antioxidant activity using different methods showed that 56.25 ± 0.57 % DPPH inhibition was achieved at 4.5 mg/ml
concentration. Concentration 2.5 mg/ml exhibited strongest reducing power (1.023± 0.015) of Fe3+ (CN-)6. Highest
FRAP value (2669 ± 74.63 µmol TE/ 100 g) was obtained at (2.5 mg /ml) levan. Free radical scavenging activity of
levan against ABTS+ cation radical was recorded.
Key words: Levansucrase, levan, Bacillus subtilis, Central composite design, antioxidant.
INTRODUCTION
Fructansucrase is an enzyme responsible for synthesis of fructose polymer by a transfer of the sucrose fructosyl moiety to polymer chain. Levansucrase is one of the most important fructosyltransferase enzymes (sucrose: 2.6-β -D-fructan-2.6-β-D-fructosyltransferase, E.C.2.4.1.10 [1-2]. It was responsible for β- (2→6) levan yield through transfructosylation reaction. A variety of microorganisms in the fermentation process could yield levan by the action of levansucrase [3-6]. Different microorganisms, such as: Bacillus subtilis, Aerobacter levanicum and Erwinia
herbicola could yield high molecular weight levan when grown on sucrose medium [7].
Nutrient concentration and environmental conditions are essential parameters for levansucrase production and levan yield. Different statistical methods were applied to evaluate these parameters which affect enzyme production and levan yield to great extent. These methods could evaluate the effect of several factors and their interaction in the optimization process.
Recently, researchers pay attention to the bacterial polysaccharides as they characterized as a potential antioxidants. [10] reported a strong free radical scavenging activity of levan derivatives (SL1 and SL2) with DPPH.
This study was focused on three points, first point aimed to evaluate the factors affecting the production of Bacillus
subtilis M levansucrase by Plackett–Burman design. The second point depended on optimization of the production
medium for maximum levansucrase production and levan yield through central composite design. The main target of the third point was the evaluation of the levan antioxidant activity by different ways.
EXPERIMENTAL SECTION
Microorganism
The strain was previously isolated from a honey bee collecting nectar from desert flower (Libya). Honey is fresh non treated ripe honey (directly collected in beehives). The isolate was identified as Bacillus subtilis M based on 16S rRNA gene and molecular identification [3]. It was cultivated on Luria Bertani (LB) agar medium consisted of (g/L): Tryptone, 10, Yeast extract, 5, NaCl, 10, and Agar, 20 (pH 7.0). After 24 h cultivation at 30 °C, the arisen colonies were harvested in 50% glycerol solution (v/v) and stored in 2 ml cryovials (Nalgen Nunc Int., Rochester, NY, USA) and stored at -80 °C as master cell bank.
Levansucrase assay
Levansucrase assay was performed according to Yanase et al. method [11]. Decreasing amounts of sugars produced were measured by glucose oxidase kits. One unit of enzyme activity was defined as the amount of enzyme that produced decreasing sugars equivalent to 1µ mol of glucose/min.
Precipitation of levan from Bacillus subtilis M culture
Bacillus subtilis M Levan was isolated from culture filtrate through precipitation with (2:1, v/v) ethanol (96%)
culture filtrate. The resulting mixture were mixed and left for 24 h at 4ºC. Precipitated levan was separated from the culture filtrate by centrifugation at 5000 rpm for 15 min. A dialysis process was performed after that to purify the polymer by using dialysis bags with porous size (12 kDa to 14 kDa).
Chromatographic analysis for Levan identification
Acid hydrolysis was done using 0.1 N HCl in boiling water bath for 1 h. Hydrolysis product was analyzed by descending paper chromatography using Whattman no. 1 and solvent system n-butanol: acetone: water (4:5:1, v/v/v).
Experimental designs Plackett–Burman design
Plackett–Burman experimental design was used to evaluate the relative importance of various nutrients for Bacillus
subtilis M levansucrase production [12]. Fifteen components were selected for the study, each variable was
represented in two levels, high concentration (+1) and low concentration (−1) in 16 trials as shown in Table (1). Each row represented a trial run and each column represented an independent variable. The tested factors included sucrose, glucose, starch, yeast extract, peptone, (NH4)2SO4, NaNO3, K2HPO4, MgSO4, NaCl, CuSO4, FeSO4, ZnSO4
and MnSO4 at pH 7, 30 ºC in Erlynmyer flask contained 50 ml medium.
Plackett–Burman experimental design is based on the first order model:
Y= B0 +ΣBiX………. Eq. (1)
Where, Y was the response (levansucrase production), B0 was the model intercept and Bi was the variables estimates.
The effect of each variable was determined by following equation,
E (Xi) = 2(Σ M i +
−M i −
)/N ………. Eq. (2)
Where, E (Xi) was the effect of the tested variable. Mi+ and Mi− represented levansucrase production from the trials
where the variable (Xi) measured was present at high and low concentrations, respectively and N was the number of
trials in Eq. (2).
The standard error (SE) of the concentration effect was the square root of the variance of an effect and the significance level (p-value) of each concentration effect was determined using student’s t-test
E (Xi) was the effect of variable Xi.
Central composite design
After the identification of components affecting the enzyme production by Plackett–Burman design three variables (sucrose, ZnSO4 and MnSO4 concentrations) were selected for response surface methodology of central composite
design (CCD). CCD proposed by Adinarayana et al and Box et al. [13-14]. For this study, 23 factorial design with six star points and six replicates at the central points were employed to fit the second order polynomial model, the experimental design consisted of 20 runs and the independent variables were studied at five different levels. The experimental design used for the study was shown in Table (3). All the experiments were done in triplicate and the average of levansucrase production and levan yield were taken as the dependent variable or response (Y). The second order polynomial coefficients were calculated and analyzed using the ‘SPSS’ software (Version 16.0). Second degree polynomials, Eq. (4), which included all interaction terms, were used to calculate the predicted response:
Y =ß0 + ß 1 X 1 +ß 2X2 +ß 3X3 + ß 11X12 + ß 22X22 + ß 33X32 + ß12X1X2 + ß 13X1X3 + ß 23X2X... Eq. (4)
Where, Y was the predicted levansucrase activity (U/ml) and for levan yield (g/l) X1, X2 and X3 were the independent
variables corresponding to the concentration of sucrose, ZnSO4 and MnSO4 respectively; ß0 was the intercept, ß1, ß2
and ß3 were linear coefficients, ß11, ß22 and ß33 were quadratic coefficients, ß12, ß13 and ß23 were cross product
coefficients. Statistical analysis of the model was performed to evaluate the variance analysis (ANOVA). Statistical significance of the model equation was determined by Fisher’s test value and the proportion of variance explained by the model was given by the multiple coefficients to determine each variable, the quadratic models were represented as contour plots (3D) and response surface curves were generated by using STATISTICA (0.6).
Evaluation of antioxidant activity for precipitated levan DPPH free radical scavenging assay
The free radical scavenging activity using DPPH reagent was determined by Brand-Williams et al [15]. Crude levan was dissolved in 85% methanol. To 0.5 ml of the levan sample (2.5, 3, 3.5,4 and 4.5 mg/ ml) and 1.0 ml of freshly prepared methanolic DPPH solution (20 µg ml-1) was added and stirred. Decolorizing process was recorded after 5 min of reaction at 517 nm and compared with a blank control. All samples were analyzed in triplicate. The ability to scavenge the DPPH radical was calculated using the following equation:
DPPH scavenging activity (%) = [(control absorbance - sample absorbance)/ control absorbance] × 100
Reducing power assay
Levan reducing power (0.5 ml of each concentration) was evaluated by Oyaizu [16], (0.5, 1, 1.5, 2 and 2.5 mg/ ml) was added to phosphate buffer (2.5 ml, 0.2 M, pH 6.6) and 1% potassium ferric cyanide (2.5 ml). The mixture was incubated at 50 °C for 20 min. Aliquots of trichloroacetic acid (2.5 ml, 10%) were added to the mixture, which was then centrifuged at 1000 rpm for 10 min. The upper layer of solution (2.5 ml) was mixed with distilled water (2.5 ml) and a freshly prepared FeCl3 solution (0.5 ml, 0.1%). The intensity of the blue green color was measured at
700 nm. In this assay, the yellow color of the test solution changes to green depending on the reducing power of test specimen. The presence of reluctant in the solution causes the reduction of the Fe3+/ ferricyanide complex to the ferrous form. Therefore, Fe2+ can be monitored by the measurement of the absorbance at 700 nm. Increasing the absorbance of their action mixture indicated increasing of reducing power.
Ferric reducing antioxidant power (FRAP) assay
The assay was done according to Benzie and Strain [17], with some modifications. The stock solutions included 300 mM acetate buffer, pH 3.6, 10 mM of TPTZ (2, 4, 6- tripyridyl-s-triazine) solution in 40 mM HCl, and 20 mM FeCl3.6H2O solution. The fresh working solution was prepared by mixing 25 ml acetate buffer, 2.5 ml TPTZ
solution, and 2.5 ml FeCl3..6H2O solution and then warmed at 37 °C before using. Levan concentrations (0.5, 1, 1.5,
2 and 2.5 mg/ml) 500 µl were allowed to react with 2500 µl of the FRAP solution for 30 min in the dark condition. Readings of the color product (ferrous tripyridyl triazine complex) were then taken at 593 nm. Results are expressed in µ mol Trolox/ 100 g dry matter. Additional dilution was needed if the FRAP value measured was over the linear range of the standard curve.
ABTS radical scavenging activity
solution with 60 ml methanol to obtain an absorbance of 0.706 ± 0.001 units at 734 nm using the spectrophotometer. ABTS radical solution was freshly prepared for each assay. From each levan concentration (0.5, 1, 1.5,2 and 2.5 mg /ml), 0.5 ml was allowed to react with 2.5 ml of the ABTS reagent and the absorbance were taken at 734 nm after 7 min using the spectrophotometer. The ABTS radical cation decolorization assay capacity of the extract and percentage inhibition calculated as ABTS radical scavenging activity:
ABTS radical scavenging activity (%) = [(Abs. control – Abs. sample)]/ (Abs. control)] ×100
Where Abs. control is the absorbance of ABTS radical cation methanol; Abs. sample is the absorbance of ABTS radical cation sample extract.
RESULTS AND DISCUSSION
Estimation of factors affecting levansucrase production
Plackett–Burman design was applied to exhibit the relative importance of different medium components. Averages of levansucrase activity in U/ml were given by different trials Table (1). Data in Table (1) showed a significant variation from 158.1 to 285.2 U/ml of levansucrase activity.
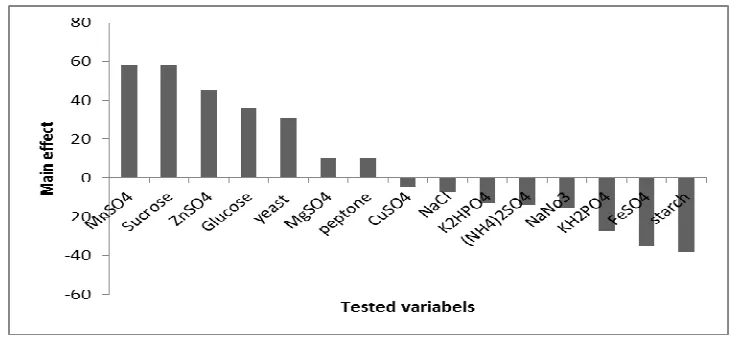
Main effects of the factors that were examined on enzyme activity were calculated and presented in Figure 1 which introduced the vision for the ranking of factor estimates that were obtained by Plackett–Burman design.
Table (2) showed the regression coefficients, calculated t- test, P- values of the examined variables. Sucrose, ZnSO4,
MnSO4, glucose, yeast extract, peptone and MgSO4 showed a significant effect on levansucrase activity. Starch,
NaNO3, (NH4)2SO4, NaCl, KH2PO4, CuSO4 and FeSO4 showed a negative contribution.
[image:4.595.122.490.357.526.2]
Fig. (1): Effect of medium composition on levansucrase (U/ml) produced by B. subtilis M
Table 1. Coded levels and real values for Plackett-Berman experiment
Levansucrase activity (U/ml) X15 X14 X13 X12 X11 X10 X9 X8 X7 X6 X5 X4 X3 X2 X1 Trial No. MnSO4 ZnSO4 FeSO4 CuSO4 NaCl MgSO4
KH2PO4
K2HPO4
NaNO3
(NH4)2SO4
Peptone Yeast extract Starch Sucrose Glucose 162.2 +1(0.001) -1(0) +1(0.001) -1(0) +1(0.4) +1(0.4) +1(5) -1(1) -1(1) +1(3) -1(1) +1(3) +1(120) +1(120) -1(80) 1 158.1 -1(0) +1(0.001) -1(0) +1(0.001) -1(0.1) +1(0.4) +1(5) +1(5) -1(1) -1(1) -1(1) -1(1) +1(120) -1(80) +1(120) 2 263.3 +1(0.001) +1(0.001) +1(0.001) -1(0) +1(0.4) -1(0.1) +1(5) -1(1) +1(3) -1(1) -1(1) +1(3) -1 (80) +1(120) +1(120) 3 205.2 +1(0.001) +1(0.001) -1(0) +1(0.001) -1(0.1) +1(0.4) -1(1) +1(5) +1(3) -1(1) +1(3) -1(1) +1(120) +1(120) -1(80) 4 158.8 -1(0) -1(0) +1(0.001) -1(0) +1(0.4) -1(0.1) +1(5) +1(5) +1(3) +1(3) +1(3) -1(1) -1(80) -1(80) +1(120) 5 240 +1(0.001) +1(0.001) +1(0.001) +1(0.001) -1(0.1) +1(0.4) -1(1) -1(1) -1(1) +1(3) +1(3) -1(1) -1(80) +1(1120) -1(80) 6 185.5 -1(0) -1(0) -1(0) +1(0.001) +1(0.4) -1(0.1) +1(5) +1(5) +1(3) +1(3) -1(1) +1(1) -1(80) -1(80) -1(80) 7 197 -1(0) +1(0.001) +1(0.001) -1(0) +1(0.4) +1(0.4) -1(1) -1(1) -1(1) -1(1) +1(3) +1(3) +1(120) -1(80) -1(80) 8 238.8 -1(0) -1(0) -1(0) +1(0.001) -1(0.1) +1(0.4) +1(5) -1(1) +1(3) +1(3) -1(1) +1(3) +1(120) -1(80) +1(120) 9 285.2 +1(0.001) +1(0.001) -1(0) -1(0) +1(0.4) -1(0.1) +1(5) -1(1) -1(1) -1(1) +1(3) -1(1) +1(120) +1(120) +1(120) 10 285.2 +1(0.001) +1(0.001) -1(0) -1(0) -1(0.1) +1(0.4) -1(1) +1(5) +1(3) +1(3) -1(1) +1(3) -1(80) +1(120) +1(120) 11 163.7 -1(0) -1(0) +1(0.001) -1(0) -1(0.1) -1(0.1) +1(5) +1(5) +1(3) -1(1) +1(3) -1(1) (120) 1 + -1(80) -1(80) 12 235.5 +1(0.001) +1(0.001) +1(0.001) +1(0.001) -1(0.1) -1(0.1) -1(1) +1(5) -1(1) +1(3) +1(3) +1(3) -1(80) +1(120) +1(120) 13 162.2 -1(0) -1(0) +1(0.001) +1(0.001) +1(0.4) -1(0.1) -1(1) -1(1) +1(3) +1(3) -1(1) -1(1) +1(120) -1(80) -1(80) 14 280 +1(0.001) -1(0) -1(0) +1(0.001) +1(0.4) +1(0.4) -1(1) +1(5) -1(1) -1(1) +1(3) +1(3) 1(80) -+1(120) +1(120) 15 224.4 -1(0) -1(0) -1(0) -1(0) -1(0.1) -1(0.1) -1(1) -1(1) -1(1) -1(1) -1(1) -1(1) 1(80) --1(80) -1(80) 16
[image:4.595.19.595.567.732.2]Table (2): Statistical analysis of Plackett- Burman design showing coefficient values, t-and P- values and percent of confidence level for each variable on levansucrase activity
Confidence level (%)
P-value t-statistics Coefficient Variables 214.23 Intercept 99.88 0.0012 2.949716 0.75 glucose 99.99 0.0001 4.714112 0.11 sucrose 99.61 0.0039 -3.07137 -0.58 starch 98.78 0.0122 2.504055 13.33 yeast 79.33 0.2067 0.841444 15.69 peptone 86.08 0.1392 -1.1249 -4.48 (NH4)2SO4
88.42 0.1158 -1.24655 9.10 NaNO3 84.58 0.1542 -1.05434 -13.08 K2HPO4
97.85
0.0215 -2.21006
-4.30 KH2PO4
93.09 0.0690 0.851582 -41.76 MgSO4 72.39 0.2761 -0.60827 -49.03 NaCl 64.73 0.3527 -0.38524 -5585.08 CuSO4 99.41 0.0059 -2.86861 74008.00 FeSO4 99.5 0.005 3.659773 2400.62 ZnSO4 99.99 0.0001 4.714112 32941.00 MnSO4
The correlation between the fifteen factors and the levansucrase activity was described by the first order linear model and presented as follows:
Y activity = 214.23+ 0.75X1+ 0.11X2- 0.58X3+ 13.33X4+ 15.69X5- 4.48 X6+ 9.10X7-13.08X8- 4.30X9- 41.76X10-
49.03X1- 5585.08X12+ 74008.00X13+ 2400.62X14+ 32941.00X15 ... Eq. (5)
According to the calculated t- test and p- values Table (2), it was noticed that medium components, sucrose, ZnSO4
and MnSO4 were the most significant variables affecting levansucrase activity. Based on this result,a medium of the
following composition (g/L): yeast extract, 3; peptone, 3 and MgSO4, 0.4 was used for further investigations.
Table (3): Factors evaluated and respectively levels of performed experiments
Table (4): Central composite design (CCD) consisting of 20 experiments for three experimental factors in coded and actual values for the production of levansucrase and levan by Bacillus subtilis M
No. of
trials X1 X2 X3
Levansucrase activity (U/ml) Levan yield (g/L)
Experimental Predicted Experimental Predicted
1a -1 -1 -1 244 257 41 54.8
2a +1 -1 -1 60 67 59 69
3a -1 -1 +1 222 177 40 62.9
4a +1 -1 +1 180 183 57 60.5
5a -1 +1 -1 222 209 38 41
6a +1 +1 -1 310 360 55 65.7
7a -1 +1 +1 222 186 40 68.3
8a +1 +1 +1 288 290 58 68
9b -2 0 0 244 230 32 48.1
10b +2 0 0 360 387 86 87
11b 0 0 -2 333 320 51 60.3
12b 0 0 +2 288 350 56 60.3
13b 0 -2 0 288 298 48 37.3
14b 0 +2 0 310 340 49 54.3
15c 0 0 0 470 460 56 66.5
16c 0 0 0 470 460 45 66.5
17c 0 0 0 470 460 47 66.5
18c 0 0 0 470 460 47 66.5
19c 0 0 0 470 460 47 66.5
20c 0 0 0 470 460 47 66.5
Application of central composite design for optimization of the culture conditions
Concentrations of the most significant medium components (Sucrose, ZnSO4 and MnSO4) were optimized according
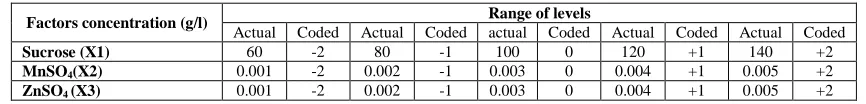
to the CCD experimental. Coded and uncoded levels of three independent variables were listed in Table (3). CCD
Factors concentration (g/l) Range of levels
Actual Coded Actual Coded actual Coded Actual Coded Actual Coded
Sucrose (X1) 60 -2 80 -1 100 0 120 +1 140 +2
MnSO4(X2) 0.001 -2 0.002 -1 0.003 0 0.004 +1 0.005 +2
[image:5.595.89.522.404.456.2] [image:5.595.158.454.491.708.2] [image:5.595.161.455.493.707.2]experimental plan observed and predicted levansucrase productivity and levan yield Table (4). The following second order polynomial equation (6) was given by multiple regression analysis of experimental data.
Yactivity= -1863.924+ 29.849X1+ 308490.416X2+ 207712401X3– 0.123X12- 0.000004 X22- 0.000004973X32-
1336.636X1X2- 120.681X1X3- 0.000002658X2X3 ... Eq.6
Ylevan= 4.497- 0.028X1- 599.88X2- 162.989X3+ 0.001X12+ 96821.2X22- 19299.27X32- 6.868X1X2-5.092X1X3+
237364.96X2X3 ... Eq.7
Where, Yactivity was the response (levansucrase production) while, Ylevan represented (levan yield) and X1, X2 and X3
were the code values of the tested variables (sucrose, MnSO4 and ZnSO4) respectively. The regression equation was
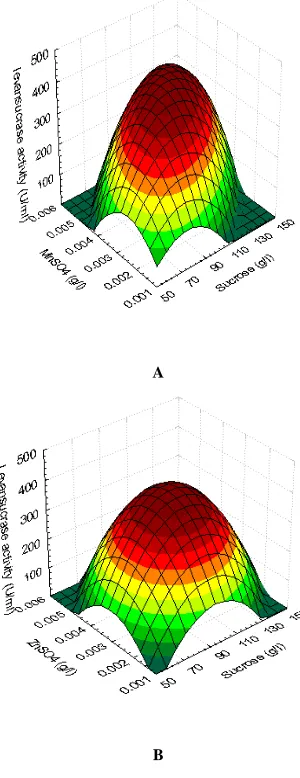
graphical represented by the three-dimensional response surface and the two dimensional contour plots. They can helpf in understanding the main and the interaction effects of the factors on the response value. Fig. (2) A, B, C showed the response surface of sucrose and ZnSO4 (A), Sucrose and MnSO4 (B) and ZnSO4 & MnSO4 (C) on
levansucrase productivity respectively, keeping the other components at the fixed zero level.
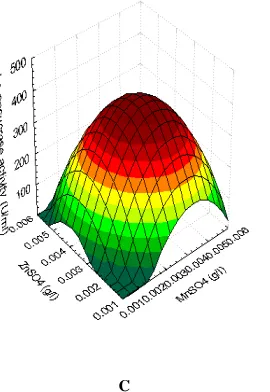
Fig. (2) E, F, G showed the response surface of Sucrose and ZnSO4 (E), sucrose and MnSO4 (F) and ZnSO4 &
MnSO4 (G) on levan productivity respectively, the other component was kept at the zero level.
A
[image:6.595.227.377.302.691.2]C
Fig. (2) A,B,C: Response surface plot of levansucrase production by B.subtilis M showing the Interactive effects of different concentrations of Sucrose and MnSO4at X3= 0 (A) Sucrose and ZnSO4at X2= 0 (B) ZnSO4 and MnSO4 at X1= 0 (C)
ANOVA analysis represented in Table (5, 6) showed a significant F- value (6.863, 11.342) for levansucrase productivity and levan yield respectively which implied the significance of the model. Model terms having values of Prob> F (0.003, 0.0001) levansucrase productivity and levan yield respectively less than 0.05, considered significant. To check the model goodness, coefficient (R2) and correlation coefficient (R) could be determined. The R2 value is always between 0 and 1. The results indicated that coefficient (R2) was calculated as 0.861 for levansucrase activity and 0.911 for levan yield (a value of R2> 0.75). The value of R was (0.928) for Eq. (6) and the value of R was (0.954) for Eq. (7). The correlation analysis showed that there was 83% correlation between levansucrase production and levan yield. In compare to the basal medium, 7.58 and 7.82 folds increase in levansucrase and levan respectively was being achieved after application of RSM.
E
[image:7.595.244.379.80.276.2]G
Fig. (2) E, F, G:Response surface plot of levan production by B.subtilis M showing the Interactive effects of different concentrations of Sucrose and MnSO4at X3= 0 (E) Sucrose and ZnSO4at X2= 0 (F) ZnSO4 and MnSO4 at X1= 0 (G)
Table (5): Model coefficients estimated by multiples linear regression (significance of regression coefficients) for levansucrase
Term Regression coefficient Standard error t- test P-value
Intercept -1863.924 651.434 -4.228 0.002
X1 29.849 8.142 4.741 0.001
X2 308490 140415.074 5.245 0.000
X3 207712 142696.475 7.132 0.000
X12 -0.123 0.030 -4.319 0.002
X22 -0.000004 0.000001149 -6.684 0.000
X32 -0.000004973 0.000001218 -6.628 0.000
X1X2 -1336.636 1096.609 -0.030 0.976
X1X3 120.681 1242.187 -3.856 0.003
X2X3 0.000002658 0.000002193 -2.978 0.014
F value = 6.863; P>F = 0.003 ; R2= 0.861; R = 0. .928; Adjusted R2 = 0 .735.
Table (6): Model coefficients estimated by multiples linear regression (significance of regression coefficients) for levan production
Term Regression coefficient Standard error t- test P-value
Intercept 4.497 4.943 0.91 0.384
X1 -0.028 0.062 -0.446 0.665
X2 -599.88 1065.391 -0.563 0.586
X3 -162.989 1082.702 -0.151 0.883
X12 0.001 0 2.631 0.025
X22 96821.168 87165.877 1.111 0.293
X32 -19299.27 92442.794 -0.209 0.839
X1X2 -6.868 8.32 -0.825 0.428
X1X3 -5.092 9.425 -0.54 0.601
X2X3 237364.96 166409.14 1.426 0.184
F value = 11.342; P>F = 0.0001 ; R2 = 0.911; R = 0 .9540.; Adjusted R2= 0 .830
Polynomial model was used to predict the validation under medium optimum conditions. The experimental levansucrase production of 470 U/ml which was closer to the predicted levansucrase production of 460 U/ml after 24 h incubation validating the proposed model. While the experimental levan yield of 86 g/L was obtained which, is closer to the predicted levan yield of 87 g/L.
A second order polynomial model was applied by the use of central composite design to identify the relationship between the three variables and the levansucrase and levan yield. Optimization of the concentrations of final medium components for both levan and levansucrase productions were the same except sucrose concentration, 100 g/L was favor for levansucrase production and the high concentration 140 g/L for levan yield.
The other medium components were (g/L): yeast extract, 3; peptone, 3; MgSO4, 0.4, ZnSO4.7H2O, 0.003 and
MnSO4.7H2O, 0.003.
Levan identification
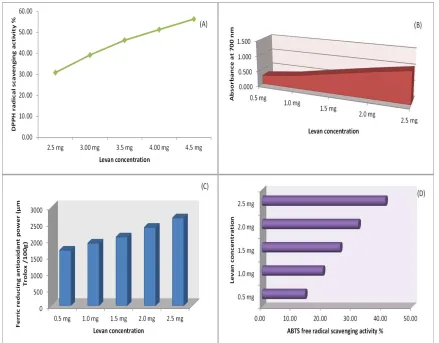
[image:8.595.242.375.78.247.2] [image:8.595.182.433.448.566.2]Evaluation of antioxidant activity for precipitated levan DPPH Radical Scavenging Activity
As shown in Fig. (3) A for the various concentrations of levan extract, the highest concentration exhibited the highest Scavenging Activity of the DPPH the other. showed 56.25 ± 0.57 % antioxidant potentialof DPPH at a concentration of 4.5 mg/ ml.
Reducing power assay
Levan extract showed concentration dependent reducing power. However, the concentration of 2.5 mg/ ml exhibited the strongest reducing power (1.023 ± 0.015). The reducing power activity of the lowest concentration of levan extract (0.5 mg/ ml) was found to be 0.282 ± 0.013.
Ferric reducing antioxidant power assay
Antioxidant potential of different levels of levan extract (0.5, 1, 1.5, 2 and 2.5 mg/ml) were calculated and the results are presented in (Fig. 3 C). Ferric ion reducing activities of levan extracts was increased due to the formation of the Fe2+ TPTZ complex by the increase in levan concentration. The highest FRAP value (2669 ± 74.63 µmol TE/ 100 g) was obtained at 2.5 mg/ml extract. While the concentration of 0.5 mg/ml showed a lower FRAP value (1695 ± 9.165).
ABTS free radical scavenging activity
Free radical scavenging activity of Levan against ABTS+ cation radical was examined. The results illustrated in Fig. 3 (D) recorded 14.32 ± 0.43, 20.21 ± 0.35, 25.92 ± 0.55, 32.013 ± 0.29 and 40.97 ± 0.21 for 0.5, 1, 1.5, 2, 2.5 mg/ml levan respectively.
Improvement of the levansucrase productivity and levan yield is the aim for many researches. This is due to their urgent demand in industrial field especially food industry [19-20]. Previously, Bacillus subtilis M was evaluated as levansucrase producers and levan yield. Till now there is scarce publication concerning levan and levansucrase optimization and levansucrase through factorial design.
Fig. (3): Antioxidant activity of Levan extract using different antioxidant assays: (A) Scavenging ability on DPPH radical, (B) Reducing power, (C) Antioxidant capacity FRAP assay and (D) Scavenging ability on ABTS radicals
[image:9.595.88.527.392.735.2]In this study factorial design was achieved according two steps, first one aimed to optimize the levansucrase through Plackett–Burman design and the second steps focused in levan and levansucrase optimization through central composite design.
Plackett–Burman design was applied to evaluate the significance of various medium components. The main effect of each variable upon levansucrase activity was estimated as the difference between both averages of measurements made at the high level (+1) and at the low level (-1) of that factor. The analysis of the data from the Plackett– Burman experiments involved a first order (main effects) model. Our results indicated a wide variation in levansucrase activity which reflected the importance of optimization of medium for higher productivity.
In order to search for the optimum concentration of the most significant medium components, sucrose, ZnSO4 and
MnSO4 showing confidence level 99% above in the Plackett–Burman design for levansucrase productivity;
experiments were performed according to the CCD experiment. In this finding, Esawy etal [19] reported that sucrose and ZnSO4 showed positive effect on levansucrase productivity from Bacillus subtilis NRC1aza. On the other hand,
Babu etal [21] used factorial design and found that the most important factors in levansucrase production by
Bacillus subtilis were the carbon and nitrogen sources used in the fermentation medium.
Multiple regression analysis of the experimental data is an appropriate way to analyze the experimental data. The production of Bacillus subtilis M levansucrase using statistical methodologies showed higher values than that obtained from recombinant Bacillus megaterium under the optimized conditions using sucrose (14 Uml-1) [22]. While the experimental levan yield of 86 g/L was obtained which is closer to the predicted levan yield of 87 g/L.[23] reported that the yield of levan with the optimized variables was increased significantly from 0.54 to 13.25 g/L. A second order polynomial model was established using central composite design to identify the relationship between the three factors and the levansucrase production and levan yield. Final optimized medium for both levan yield and levansucrase production were similar except sucrose concentration, 100 g/L was favor for levansucrase production and the high concentration 140 g/L for levan yield. These results in agreement with [24] who indicated that, at high sucrose concentrations, oligosaccharides and polysaccharide polymerization reaction most catalyzed by levansucrase. On the contrary of our result, Berté etal, [25] reported that 300 g/L sucrose was the optimum for levansucrase production. Finally, ten samples of levan have the highest molecular weights were analyzed by paper chromatography. The results pointed to the main samples structure was fructose. This result confirmed that the variation in medium components had no effect on levan yield.
DPPH free radical scavenging assay is based on the reduction of DPPH (a stable free radical with a deep violet color) to a stable diamagnetic molecule by any substance [26]. Imen et al. [27] explained the effect of levan against oxidative stress linked atherosclerosis.
Reducing power was measured by electron donation during the reduction of Fe3+ (CN-)6 to Fe+2(CN-)6 to form the intense Prussian blue color complex and then measured at λ700 nm. Bacillus subtilis M levan has good reducing power. Antioxidant compounds are able to reduce the reactive radicals into more stable and unreactive species [28] Ferric reducing antioxidant power assay(FRAP) is based on the ability of antioxidants to reduce Fe3+ to Fe2+ in the presence of tripyridyltriazine (TPTZ) to form an intense blue Fe2+ -TPTZ complex with an absorbance maximum at 593 nm [29]. The results showed that the formation of the Fe2+ -TPTZ complex was increased as Bacillus subtilis M levan concentration increased. To the best of our knowledge no one has evaluated the FRAP assay of levan.
The ABTS free radical scavenging activity assay is based on hydrogen donating ability of the antioxidant , The antioxidant potential against ABTS or DPPH were correlated with the concentration, chemical structures, and polymerization degrees of organ antioxidants [30]. The results of the antioxidant of levan revealed a potent activity against different oxidizing species at a concentration 2.5 mg/ml.
CONCLUSION
In recent years, levansucrase production and levan yield were the aim for many researchers. This is due to their importance in the food and pharmaceutical industries. In this finding, levansucrase from Bacillus subtilis M was optimized by Plackett–Burman design. Then central composite design was achieved successfully for levan and levansucrase optimization. Bacillus subtilis M levan showed a promising antioxidant activity which recommended it to be used in industrial applications.
Acknowledgment
REFERENCES
[1]AF Abdel-Fattah; DAR Mahmoud; MA Esawy. Curr microbial.; 2005, (51), 402-407. [2] G Sangiliyandi; KC Raj; P Gunasekaran. BiotechnolLett.;1999, ( 21), 179-182.
[3] MA Esawy; EF Ahmed; WA Helmy; NM Mansour; WM El-Senousy; MM El-Safty. Carbohydr Polym.; 2011, (36), 823-830.
[4] KH; Jang KB Song; CH Kim; BH Chung; SA Kang; UH Chun; RW Choue; SK RheeBiotechnolLett.; 2001, (23), 339-344.
[5] C Korneli; CJ Bolten; T Godard; E Franco-Lara; C Wittmann. BiotechnolBioeng.; 2012, (109), 1538–1550. [6] IL Shih; YT Yu; CJ Shiehand; CY Hsieh. J Agric Food Chem.; 2005, (53), 8211-8215.
[7] VK Ananthalakshmy P Gunasekaran. Braz Arch Biol Technol.; 1999, (42), 291-297. [8] I Freidovich. Acad Sci.;1999,(893), 13-18.
[9] I Dahech; B Harrabi; K Hamden; A Feki; H Mejdoub; H Belghithand KS Belghith. Int J BiolMacromol.; 2013, (58), 281-286.
[10] AM Abdel-Fattah; AM Gamal-Eldeen; WA Helmy; M.A Esawy. CarbohydrPolym.; 2012, (89), 314–322. [11] H Yanase; H Fukushi; N Ueda ;Y Maeda; A Toyoda; K Tonomura. Agric Biol Chem.; 1991, (55), 1383–1390. [12] RL Plackett J; Burman. Biometrika.; 1946, (33), 305-325.
[13] K Adinarayana ;P. Ellaiah, B. Srinivasulu, R. Bhavani Devi, and G Adinarayana. Process Biochem.; 2003, (38),1565–1572.
[14] GEP Box; WG Hunter JS Hunter. Statistics for experiments. In An introduction to design.Data analysis and
model analysis. New York: John Wiley and Sons; 1978, 291–334.
[15] W Brand-Williams; ME Cuvelier; C Berset. Lebensmittel-Wissenschaft&Technologie.; 1995, (28),25-30. [16] M Oyaizu. Jpn. J. Nutr.; 1986, (44), 307–315.
[17] IFF Benzie; JJ Strain. Anal.Biochem.; 1996, (239), 70-76.
[18] R Re; N Pellegrini ; A Proteggente ; A Pannala; M Yang. Free RadicBiol Med.; 1999, (26),1231-1237.
[19] MA Esawy; AM Abdel-Fattah; MM Ali; WA Helmy; BM Salama; HAA Taie; AM Hashem; GEA Awad.
CarbohydrPolym.; 2013,(96),332– 341.
[20] L Freire dos santos; FCB Cabral de melo; WJ Martins paiva, D Borsato; MLC Custódio da silva; MAP ColaboneCelligoi. Rom Biotech Lett.; 2013, (18), 8413-8422.
[21] IS Babu; S Ramappa; DG Mahesh; KS Kumari; GS Rangaiah. . Res J Microbiol.; 2008, (3),114-121.
[22] C Korneli; R Biedendieck; F David; D Jahn; C Wittmann. ApplMicrobiolBiotechnol. 2012, DOI 10.1007/s00253-012:4567-1.
[23] R Srikanth; G Siddartha; C H Sundhar Reddy; B S Harish; M JanakiRamaiah ; KB Uppuluri. Carbohydr
Polym.; 2015, (123)8-16.
[24] G Meng; K Fütterer. BMC StructBiol.; 2008, (8), 8-16.
[25] SD Berté; D Borsato; P B da Silva; J A Vignoli; M Antonia; PC Celligoi. Afr J Microbiol Res.; 2013, (7), 898-904.
[26] K Lee; T Shibamoto. Food Chem.; (2001), (74), 443.
[27] A Imen; H Najjaa; M Neffati. Eur. Food Res. Technol.; 2013, (237), 521-527. [28] I Gulcin; M Oktay; E Kirecci; O I Kufrevioglu. Food Chem.; 2003, (83), 371−382. [29] I F F Benzie; JJ Strain. Methods Enzym.; 1999, (299), 15–27.