International Journal of Emerging Technology and Advanced Engineering
Website: www.ijetae.com (ISSN 2250-2459, Volume 2, Issue 6, June 2012)372
Computerized Experimental Setup for Analysis of Four Bar
Mechanism - A Demonstrative Model Approach
Pranao G kalmegh
Abstract— In the age of automation we can’t be dependent totally on manual working of any mechanism, it leads mechanism to take much time with less accuracy. In case of analysis of four bar mechanism if we go by graphical method it will take at least one hour just for single position of crank and if we analyze it with computer interfacing, it can be done in very short time for different positions of crank with greater accuracy.
For third year mechanical engineering students, there are two experiments based on analysis of four bar mechanism in order to construct velocity & acceleration diagram in Theory of Machine Lab, but at this moment they use to do this with graphical method in which they can’t visualize actual motion of different links for different mechanisms. Hence we have prepared such equipment, which will give outputs like angular velocity (w), angular acceleration (a), linear velocity (v), linear acceleration (a) for fraction movement of crank within few minutes and visualization of actual motion of links for different mechanism can be studied, such as
1. Crank-crank mechanism 2. Crank-rocker mechanism 3. Rocker-rocker mechanism 4. Slider crank mechanism
And also we have made an arrangement for its manual working and by obtaining both the result of manual & computer outputs we can compare it and this equipment will also help in introducing the students with interfacing knowledge.
Keywords—four bar mechanism, visual basic, interfacing kit, demonstrative model, velocity and acceleration analysis.
I. INTRODUCTION
The four bar mechanism is the simplest possible closed loop mechanism & has numerous uses in industry and for simple devices found in automobiles, today’s, spacecraft etc. the device gets its name from its four distinct links as shown in figure.
Fig.1: Basic four bar mechanism
Links 1 is a ground link(sometimes called frame or fixed link), &it assumes to be motionless link 2&4 each rotates relative to the ground link about fixed pivots Ao&Bo. Link 3 is called coupler link and is the only link and the only link that can trace paths of arbitray shape (because it is not rotating about a fixed pivot) usually one or the “ground links” link 2 or link 4 serves as the input link which is the link which may be either turned by hand or perhaps driven by an electric motor or a hydraulic or pneumatic cylinder of link 2 is the input link then link 4 is called the follower link, because its rotation merely follows the range of motion as determined by the input and coupler link motion of link 2 is the input link and its possible range of motion is ultimate, it is called a crank and the linkage is called crank rocker crank rockers are very useful because the input link can be located continuously while a points on its coupler curve. Our main aim is to analyze the four bar mechanism for using it in various application. Analization of four bar mechanism includes, finding out velocities and acceleration of different links. The traditional methods of analysis are Graphical and analytical may be limited when they are applied to complicated problems. Graphical methods, although they provide a good understanding of kinetics, lack of accuracy and tend to be time consuming. These are the reasons why not used for repetitive or three dimensional analysis. Analytical or closed form methods can be extremely efficient, although they are application dependent, and may suffer from excessive complexity problems.
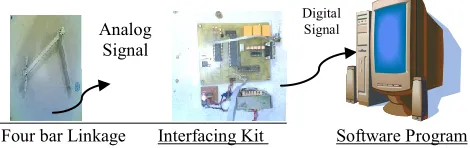
Now, to overcome above difficulties we have built one operative model of four bar mechanism, which has sensors (angular sensors) 4 in number on each joint which will find out angle moved by different links. We have to provide an angular motion to crank only. There is one interfacing kit which is linkage between mechanical assembly and computer. Now, we will give input to computer by rotating the crank, this input is in analog form (from sensor to kit) and give to analog digital converter which will convert this input into digital form and give to software program & similarly values for other links will also be provided. Now, software program will calculate the velocities, acceleration of different links, for different positions of crank. Now by obtaining this result we will try to find out same velocity and acceleration of links by automatic method Means instead of giving motion to the crank we will directly provide the input to software program.
We have the relations for analysis purpose:
t
/
,v
r
,
/
t
,a
r
.
2 Where,
Angle moved by links.
t
Time for which crank has moved
International Journal of Emerging Technology and Advanced Engineering
Website: www.ijetae.com (ISSN 2250-2459, Volume 2, Issue 6, June 2012)373
Hence, by observing both result sheets we can compare both methods of analyzing four bar mechanism.
This method can be helpful to Third year Mechanical Egg. Students because they are having practical on analysis of Four Bar Mechanism in syllabus, by having this model they can visualize actual motion of links & different mechanisms obtain from Four Bar Mechanism.
Different mechanisms obtained from Four bar mechanism: Some as the above by changing the input link means simply varying lengths of different links we can obtain various mechanisms from this basic Four Bar Mechanism Which are as follows:
1 Crank-crank mechanism:- 2 Crank-rocker mechanism:- 3 Rocker-rocker mechanism:-
[image:2.612.353.534.138.197.2](2) (3) (4) Fig. 2: Crank-crank mechanism
Fig.3 Crank-rocker mechanism Fig. 4: Rocker-rocker mechanism
II. Fabrication of model Design section:
1. Link Dimensions:
For providing a better aesthetic look we have used Acrylic as material for the fabrication of link with required dimensions. All the four links are made of same material for simplicity. The fabricated model and interfacing kit both are mounted on MDS Sheet along with a covering of acrylic box for safety purpose. Crank: length : 5cm,Width: 1.5cm,Thickness: 0.3cm
Figure.5: Crank
[image:2.612.50.272.254.385.2]Coupler: length : 20cm,Width: 1.5cm,Thickness: 0.3cm
Figure 6:Coupler
Rocker: length: 15cm, Width: 1.5cm,Thickness: 0.3cm
Figure 7:Rocker Fixed Link: 25cm
2. Model Dimensions:
A fabrication model along with electronic hardware kit (interfacing kit)is mounted on the MDS Sheet in a box along with the covering of acrylic sheets. On the sheet there is one hole through which wires are connected from sensor to interfacing kit.
Figure 8: A demonstrative model Length: 58cm ,Width: 38cm ,Height: 7cm
Electronics section:
In this project, a software program for coordinating activities of four bar mechanism model is developed. It is interfaced with model through computer system with the help of electronics hardware kit for directing and monitoring the four bar mechanism activities.
The electronic hardware consists of transformer, integrated circuits, serial port connectors, resistors, capacitors, timers, voltage regulator; filter Analog Digital convertor, microcontroller with biasing network mounted on PCB. An analog signals are coming out from various sensors are provided to Analog-Digital Convertor where signal conversion is carried out and further sends to a microcontroller which processed that digital signal ang send to CPU through serial port.Transformer, Rectifier, Capacitor & Regulator are belongs to power supply line from which supply is provided to different devices on PCB and sensors as per there requirement.
Figure 9: Layout of Electronic Hardware Kit
1. Interfacing:
In interfacing the electronic hardware kit is used and interfaced with software program on computer. Due to the movement of crank, data is sends in term of analog signals to software program in order to analyze the mechanism. In interfacing (analog) signal flow from various sensors to electronic hardware kit and after conversion into digital quantity it further sends to a software program.
Digital Signal Variable Processing Unit
INPUT
Analog Signal
Figure 10 :Block diagram of Interfacing
SOFTWARE PROGRAM
CENTRAL PROCESSING
UNIT
ELECTRONIC HARDWARE KIT
TO FOUR BAR MECHANISM SOFTWARE
PROGRAM
ELECTRONIC HARDWARE KIT
[image:2.612.311.597.580.679.2]International Journal of Emerging Technology and Advanced Engineering
Website: www.ijetae.com (ISSN 2250-2459, Volume 2, Issue 6, June 2012)374
Interfacing kit:
[image:3.612.360.527.126.209.2]Figure shows an interfacing kit which consist of following components:
Figure 11: Interfacing Kit
1. TRANSFORMER
2. LM78XX SERIES VOLTAGE REGULATORS 3. SENSOR (10K Pot type Potentiometer) 4. ANALOG-DIGITAL CONVERTER 5. LM555/NE555/SA555 SINGLE TIMER
6. 8-BIT MICROCONTROLLER WITH 4 KBYTES FLASH
1 Transformer General Description:
A transformer is a device that transfers electrical energy from one circuit to another. Transformer is based on two principles: firstly, that an electric current can produce a magnetic field (electromagnetism) and secondly that a changing magnetic filed within a coil of wire induces a voltage across the ends of the coil (electromagnetic induction). Changing the current in the primary coil changes the magnitude of the applied magnetic field. The changing magnetic flux extends to the secondary coil where a voltage is induced across its ends. Figure shows the transformer
[image:3.612.47.271.131.323.2].
Figure 12: Transformer
2. LM78XX SERIES VOLTAGE REGULATORS
General Description:
The LM78XX series of three terminal regulators is available with several fixed output voltages making them useful in a wide range of applications. It is used for regulating and maintaining the voltage which is to be provided to further devices such as sensors, ADC, Microcontroller etc on PCB. Initially 230V AC supply is converted into 9V AC Supply with the help of transformer. This 9V AC supply is further moves towards the rectifier where its conversion is done into 9V DC supply. Through a filter (Capacitor) a purely 9V DC Supply is proved to a Voltage regulator which regulates the 9V DC Supply and maintain it at 5V DC supply and supplies to various devices on PCB & sensors as per their requirement i.e. Maximum 5Volt.
Figure 13: Voltage Regulators
During the transmission of 9V DC supply from filter to regulator, large amount of heat is dissipated to atmosphere & for that a heat sunk is provided at the top.
3. SENSOR (10K Pot type Potentiometer) Description:
[image:3.612.51.217.458.500.2]It is nothing but a potentiometer which works as a sensor. It is three terminal resistor with a wiper & resistive strip. It is constructed using a semi circular resistive element with a sliding contact wiper. The wiper is connected through another sliding contact to another terminal. It is manually adjustable resistor. It has three terminals, one terminal is connected to the power source, another one terminal is hooked up to ground (a point which have no voltage or resistance & which serves as a neutral reference point) while third terminal runs across a strip of resistive material. This resistive strip generally has a low resistance at one end; its resistance is gradually increased or decreased to maximum resistance at other end. Third terminal is usually interfaced to user by means of knob or lever. Users can adjust the position of third terminal along a resistive strip in order to manually increase or decrease resistance. By controlling resistance, a potentiometer can determine how much current flow through a circuit. When used to regulate current, a potentiometer is limited by maximum resistivity of strip.
Fig. 8 shows the potentiometer mounted at four different positions on model. When we are providing a motion to a link (crank) all links will also move through certain degree and due to which knob (through a rotation of spindle) providing a sliding motion to wiper on resistive strip. If the knob controlling the resistance is positioned at exactly halfway point on resistive strip then output voltage will drop by exactly 50%, no matters how high the potentiometer input voltage.
4.ANALOG-DIGITAL CONVERTER :
Analog signals
Timer select line (S1,S2)
Figure 14: Analog-Digital Converter
[image:3.612.322.558.561.657.2]International Journal of Emerging Technology and Advanced Engineering
Website: www.ijetae.com (ISSN 2250-2459, Volume 2, Issue 6, June 2012)375
Description:
It is one of the most important component in an interfacing kit. It is used for the conversion of analog signal into digital one. Whatever analog signal coming in the form of electrical quantity (Resistance or Voltage) is getting converted into digital signal with the help of multiplexer and Timer (8 channels Multiplexer along with processing control logic unit and signal timer555) Analog signals (in electrical quantity) are send from various four sensors (A,B,C & D) are initially collected at multiplexer which is nothing but a device which receives no. of input at a time but gives only one output at that time by processing that signal in logic control unit and converts into digital one. Timer also play a major role in order to processed the signal by making a particular sequence or manner in which signal is get processed in multiplexer. Figure shows the ADC along with Multiplexer and Timer selection line.
5. LM555/NE555/SA555 SINGLE TIMER
6. 8-BIT MICROCONTROLLER WITH 4 KBYTES FLASH
Testing & Comparison Of Experimental Setup- 1.Working Of Experimental Setup:
For taking a trial on the actual working of four bar mechanism-a demonstrative model, we have two options by which analysis can be possible. We can go for either automatic method or manual method. As compared to traditional method this approach give the required output in less time and better accuracy along with better visualization of various links of mechanism.
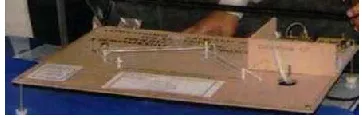
Figure shows the experimental setup for analysis of four bar mechanism. Which consist of fabrication model, interfacing kit and software program inside a computer system.
[image:4.612.50.285.479.553.2]
Four bar Linkage Interfacing Kit Software Program
Figure 16: Experimental Setup
For manual operation, first manually we have to provide a motion to a crank as per required position. Due to motion of crank other links will also move through certain degrees. Now, Sensors will recognize the different angle taken by different links from initial position to the final position of crank. Along with that stopwatch will provide time taken to move crank from initial position to final one. These two parameters (Angles and time) is then provided to the software program which will finally gives output as velocity & acceleration for all the links of mechanism.
In automatic operation we will directly give the inputs (angle & time) to the software program instead of rotating the crank. And software program will give the required outputs.
By obtaining these results several calculations have been made to find out velocity and acceleration of all links and both results are compared.
2 Comparison Between Theorotical Drawn & Computer Assisted Velocity & Acceleration Diagram
Traditionally we have two methods for the analysis of four bar mechanism as graphical method and analytical method, but these methods are having certain limitations due to which desired results are not possible. These are very complex and time consuming and do not provide actual motion of links i.e. proper visualization is not possible.
In this project, analysis of each & every link of linkage is possible with proper visualization at every position of crank. And gives the required output in short span of time.
We can make the comparison between outputs given by traditional method and that given by a demonstrative model approach; by doing so we came to know that compared results are 95% correct.
Following are some problems which gives the comparison between traditional (Graphical) method and demonstrative model approach.
Prob. Analyze a four bar mechanism having following given data & Space diagram:
Crank Length (AB):- 5cm, Coupler (BC):- 20cm, Rocker (CD):- 15cm, Fixed Link (AD):- 25cm and
Angle between crank and fixed link is 900, when crank is
rotating with 0.5233 rad/sec. Soln :
By Graphical Method We know that
Crank length (r2) = 5 cm.
Angular Velocity of crank (w2) = 0.5233 rad/sec.
So Velocity of crank = r2 * w2
V2 = 5* 0.5233 = 2.616 cm/sec = 0.02616 m/s.
Take scale as 1cm. = 1cm/sec. for drawing velocity diagram. By Measurement: V3 = 1.3cm/sec = 0.013m/sec
V4 = 2.35cm/sec = 0.0235 m/sec
Now Radial comp. of acceleration of crank is given as ar2 = V22 / r2
= 2.612 / 5 = 1.36 cm/sec.
Similarly ar3 = 0.013*0.013 /0.1 =0.00169m/s2 , ar4 = 0.02352 /0.15 = 0.00378 m/s2
Tangential comp. of acceleration of crank as at = 0.872 cm/sec2 = 0.00872 m/sec2
Taking scale as 1cm= 0.436cm/sec2
By measurement: at3 = 2.5*0.436 = 1.09cm/sec2 = 0.0109m/sec2
at4 = 0.55*0.436 = 0.218 cm/sec2 Acceleration = sq.root ( ar2 + at2 )
now a2 = 1.61 cm/sec2, a3 = 1.1 cm/sec2 a
4 =0.426cm/sec2 Analog
Signal
International Journal of Emerging Technology and Advanced Engineering
Website: www.ijetae.com (ISSN 2250-2459, Volume 2, Issue 6, June 2012)376
By Experimental setup : Step 1
Step 2
Step 3
Future scope
Study of forces acting on this mechanism, it is possible by using different sensors. By using these sensors we can determine force acting on different links of mechanism. Also we can convert this mechanism into five bar or six-bar mechanism by adding one or more links with some modification. With this instrument we can draw velocity and acceleration diagrams from results obtaining for different positions of crank.
III. CONCLUSION
This developed “Demonstrative model of four bar mechanism”, has set standards in the field of analysis of four bar mechanism and slider crank mechanism for finding velocity, acceleration of different links of mechanism for various positions of crank.
In concluding statements it can be claimed that this project “computerized experimental setup for analysis of four bar mechanism- a demonstrative model approach” is successful in great extent to reduce the complexity in analysis of four bar mechanism, obtaining accurate and faster results in terms of displacement, velocity, acceleration of four bar mechanism which also results in saving of time, visualization of actual motion of links for different mechanisms obtaining from four bar mechanism. We have compared the analysis outputs obtained from experimental setup approach & graphical method which are found to be approximately 99% correct.
References
[1]. R. S. Khurmi– Text Book Of Theory Ofmachine [2]. S. S. Ratan - Text Book Of Theory Of Machine
[3]. R.M. Bhurchandi- Text Book Of Electronic Devices & Controls.
[4]. J.M. Nagrathan- Text Book Of Communication Theory [5]. B.Ram. -Fundamentals Of Microcontroller And
Microcomputers
[6]. Enggineering Academy Of Southern New England, University Of Rhode Island – Mechanical Enggineering Projects
[7]. Synthesis Of Four Bar Mechanisms Using Pattern Matching Approach Course: Computer Aided Enggineering Design Instructer: Dr. Amitabh Mukherjee Team: Shorya Awtar & Vipul Gupta [8]. Computer Aided Analysis Of Mechanical
Systems,Prentice – Hall (1988)
[9]. Global Spec. Journal On Mechanical Engineering By Dr.J.M.Ross
[10]. Herbert & Schildt - Text Book Of Visual Basic 6.0 S.Robertson & Mcgraw Hill Publication- Textbook On Visual Studio
Theta in degre es
Thet a in radi ans
R (lin k leng th) (cm )
Ti me (se c)
Omeg a= theta/t ime (rad/s ec)
Alpha= omega/ time (rad/se c2)
Velocit y= R1*om ega (m/s)
ar
= V2
/R at
= Alp ha *R
Acc.
0 0 25 0 0 0 0 0 0 0
0 0 5 0 0 0 0 0 0 0
0 0 20 0 0 0 0 0 0 0