Journal of Chemical and Pharmaceutical Research, 2014, 6(7):2255-2263
Research Article
ISSN : 0975-7384
CODEN(USA) : JCPRC5
Simulation and survey method for remote sensing data
Li Wei
University of Science and Technology Liao Ning, China
_____________________________________________________________________________________________
ABSTRACT
To obtain dynamic real-time display of global topography data, based on the study of multiple LOD algorithms and synthesizing the advantages of three level-detailed algorithms, we propose an improved LOD algorithm based on extensible quadtree structure. Our algorithm adopts mipmapping method to simplify the grids, which keeps the efficiency of Ulrich and the simplicity of Geomipmapping. To eliminate the possible crack of different level-detailed blocks in splicing, we add skirt vertexed to the terrain blocks, so as to fully utilize the CPU batch in triangle processing and make optimization of the memory and speed. The experiments results show that the improved method can provide real-time and dynamic display of mass global topography data out of core. The combination with fractal algorithm has also increased the drawing resolution effectively.
Keywords: remote sensing, LOD, quadtree, block, level-detailed, resolution
_____________________________________________________________________________________________
INTRODUCTION
Remote sensing survey and mapping technology is used to obtain the remote sensing image data of geographical surface and 3D topographic data. Then 3D visualization technology can be used to draw three-dimension graph for stellar and it is one of main missions to detect terrain. The main problem of terrain rendering is the size of data quantity. When computer is applied to draw terrain landscape in large range, one of the important problems is how to render all these perceiving information real-time [1]. However, due to restrictions of detection technology methods, acquired accuracy and resolution of topographic and image data are very low, so further requirements of remote sensing and mapping task cannot be satisfied. Lindstrom proposed continuous level or detail algorithm CLOD [2] whose rough and simplified steps are simple as well as effective and they can efficiently be realized in modern graphic hardware. However, since it needs to use quadtree subdivision framework network in real-time during the systematic operation, it will largely take up CPU resource and the drawing efficiency will be influenced. Based on Clipmap algorithm of graphic hardware and spherical Clipmap algorithm [3], through storing terrain data in graphic display memory and the annular array in improving data utilization, the drawing speed is largely improved. But Clipmap algorithm has high requirement on terrain as well as image data and data preprocessing is very complex.
refinement method from top to bottom of terrain and it does not utilize the data block in CLOD algorithm. The advantages of this algorithm are to separate between generation and usage of the triangle strip, so as to extend the hardware feature effectively. Uirich proposed a hierarchy detail algorithm [6] whose purpose is to efficiently render the massive terrain data on modern graphic data. This algorithm quotes some ideas of geomipmap but further improvements are also made. This method is based on quadtree structure. Each node of quadtree covers one area to form a continuous inheritance relationship. At root node, there is a polygonal grid of the lowest resolution to cover the whole terrain. Its four child nodes individually cover a quarter of terrain but higher resolution terrain recursively subdivides till it obtains original resolution terrain.
Based on above ideas, this paper designs an extensible quadtree structure to level and block the global terrain data. The terrain and image quadtree pyramid are set up draw the massive data out of core.The leveling detail algorithm in this paper integrates the advantages of three-level for detail algorithms in references [7,8]. Its basic principle is partially similar to the part of coarsening simplification in Lindstrom’s algorithm. Our method is based on quadtree structure and we adopt the idea in reference [9,10] to simplify the grid, so that the algorithm keeps high efficiency of Ulrich algorithm and geomipmapping simplicity. Since this paper needs to consider real-time dynamic display of the global massive terrain, we comprehensively analyze the advantages and disadvantages of mainstream LOD algorithm and use LOD algorithm of extensible quadtree fragment to draw the global geological data. From extensible quadtree structure of this algorithm, each fragmental data block is completely independent from other data blocks even the tree itself. It is a good characteristic for simplified realization as well as data scheduling exceeding memory. Besides, this quadtree structure can combine fractal technology to effectively improve terrain drawing resolution.
RELATED WORKS
2.1 Tile Block Terrain Drawing Algorithm
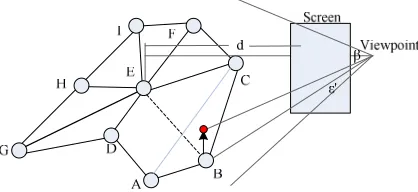
In order to understand the difference in terrain rendering based on block and quadtree method, we use a 33×33 size terrain for explanation in figure 1. The red triangle in figure refers to visual cone and triangulated grid refers to those terrain blocks intersecting or inside visual cone.
In figure 1(a), all terrain blocks have the largest 5×5 resolution which expresses classical terrain brute force algorithm. Simplification based on block is shown as figure 1(b). In this method, special error criterion is used to determine the detailed level of each block and the simplification between blocks is independent. In addition, each block containing vertex numbers will change with level of detailed change, but the block size will not. The simplification based on quadtree is shown as figure 1(c). From this method, terrain block size is different but vertex number in each terrain block is stable. This type of simplification uses quadtree space partition principle to determine the terrain block size. The common point of these two simplified methods is using quadtree space segmentation principle. From the method based on block, quadtree is only used to determine visual terrain block and it does not involve level of detail selection. But from the method based on quadtree, the quadtree is used to determine the size of each terrain block.
(a) Without simplification algorithm (b) Simplification based on block (c) Simplification based on quadtree
Figure 1. Terrain simplification algorithm
2.2. LOD Algorithm Based on Quadtree
processing, and data storage reduction through corresponding compression algorithm. So most of current LOD algorithms are based on RSG model. LOD algorithm based on RSG is mainly divided into quadtree tile block LOD algorithm and continuous LOD algoithm considering viewpoint and terrain characteristics. Clod adopts the data
structure of quadtree and assume the terrain data size is
(2
n+ ×
1) (2
n+
1)
. Quadtree structure is used to divide square terrain data. The root node covers whole terrain and its four child nodes respectively cover a quarter of terrain zone. There is one edge overlapped among the brother nodes of quadtree.The data quantity of polygonal grid which is included in quadtree node is an important factor to determine the performance of LOD algorithm drawing. The most simple polygonal grid which is stored in quadtree node is a quadrangle constructed by two triangles. But this storage mode will frequently call drawing API by traversing the nodes of quadtree and cause larger computing burden on CPU, which influences the generating ability of polygon.
In order to furthest improve the producing ability, the algorithm is demanded to process more triangles during calling drawing API at one time. One of the simplest methods to satisfy requirements is storing a suitable polygonal grid in quantity in quadtree nodes. The paper defines terrain grid which is stored in quadtree node as terrain tile block [11] to utilize the performance of current graphic hardware. After experiment, this paper proves that drawing performance is the best when grid size of quadtree nodes’ stored tile data is 33×33. In tile quadtree, each tile data block is completely independent from other data block even the tree itself. This independence shows good characteristic for simplification and data scheduling of exceeding memory.
IMPROVED LOAD ALGORITHM BASED ON EXTENSIBLE QUADTREE BLOCKS 3.1. Grid Simplification
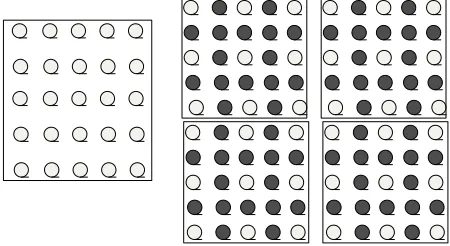
Based on grid simplification of terrain data from bottom to the top, different levels of detailed tile data blocks are generated. On leaf nodes at the bottom of quadtree, polygonal grid is directly generated from original elevation data. By combining adjacent 2×2 terrain data, polygonal grid is simplified to generate parent node. This process continues till polygonal grid is simplified to simple grid which meets the demand and it is positioned on root node. This simplified method is similar to geometrical mipmapping: After each step is finished, the vertex data at interval of one line and one column in grid will be removed and four child nodes in quadtree will be combined as one parent node as shown in figure 2.
Figure 2. Elevation data simplification with geomipmapping
The reason to use this simplified program is that it is simple and convenient for realization. In addition, another feature of this program is that it can keep the same grid structure in all polygonal grid, that is, all grids are regular triangulation squares with the same size. This ensures that algorithm can fully utilize the ability of CPU to massively process triangular surface and optimization of memory and speed.
3.2. Error Simplification
The error
ε
C of each block determines which level of block is to be rendered.ε
C equals to the maximum valueThe error of some vertex is computed in object space and it equals to the distance of the side constructed by this vertex and its adjacent points. Its calculation equation is:
|
|
2
Z Z
C Z
B
D
C
ε
=
−
+
(1)Z
B
,C
Z,D
Z respectively denote the of vertexB
,C
andD
.The error of block with low-detail level is bigger than the block with high-detailed level. To ensure that the error of block can be increased along the quadtree, we adopt the method in [12] to compute
ε
C. It equals to the sum ofmaximum errors of
ε
Ci of its sub-nodes and its own errorsε
m. That is0 1 2 3
0
max{
,
,
,
}
C
C C C C m
if chunk is leaf node
otherwise
ε
ε ε ε ε
ε
=
+
[image:4.595.193.402.374.470.2]By the comparison of error
ε
C we can determine whether some level of block satisfies suitable details, or whether it will be replaced by higher-leveled block. After each block in object space is acquired, it needs to be mapped to screen space to generate screen spaceε
. Then it is compared to defined thresholdη
. Ifε η
>
, more leveled details with higher resolution are needed; otherwise, we think current blocks satisfy our demand.Figure 3. Calculation simplification of mapping error
We assume the viewpoint of sight direction parallels to the horizontal, as is shown in figure 3. The method in [13] describes how to map
ε
C to screen space to getε
. Since its operation is too complicated, this paper adopts an approximated simple method instead.The process to map error
ε
C to screen space can be described as'
2 | tan( ) |
2
C
S
d
ε ε
=
β
(2)S
is the height of screen in pixels,d
is the distance from viewpoint to blocks,β
is the sight angle in radians.min
2
| tan(
) |
2
C
S
fov
d
η ε
=
(3)min
2 | tan(
) |
2
CS
d
fov
d
ε
=
(4)For each blocks,
d
min can be precalculated and stored. But if error thresholdη
is changed, thend
min needs recalculation. Therrefore, we only store the precalculated valueC
instead ofε
C. During the selection of leveled details we multiplyC
toε
C to getd
min. The advantage of such measure is whenη
is changed onlyC
is needed to be computed.3.3. Detail Selection and Error Standard
By reducing half of scaling factors, one terrain block can be divided into four smaller terrain blocks. Thus, we can start from one terrain block covering the whole terrain and recursively divide it into four child nodes till obtained terrain block resolution is the same to height field. By means of recursively evaluating each terrain block, it can be determined to be rendering or continuing to subdivide into smaller terrain block. Therefore, we can obtain rational terrain when reducing the rendering triangle quantity [15]. This paper uses simple evaluation standard based on distance. The terrain block far from viewpoint can cover more areas while the details will be more abundant which are near the viewpoint. Reference [2] will be adopted to use the maximal screen space error. It will not only consider distance between viewpoint and terrain block but also the roughness of terrain surface. Evaluation standard based on
distance is shown by the following formula:
l
C
d
<
. Parameterl
refers to distance from terrain block center toviewpoint,
d
refers to grid distance of terrain block in world coordinate system andC
refers to an adjustable parameter of controlling terrain rendering quality. If test is successful, the terrain blocks are divided into four child nodes to continue to recursively check downward. If failed, terrain blocks will be rendered.For terrain block size selection, if the terrain block is too large, it will cause that terrain is too rough or precise. Although using small terrain block can change a lot on level of detail, it will increase the times of rendering function calling. Therefore, suitable terrain block size needs to be determined based on experiment in order to acquire rendering call times and triangle size. After these extra skirt vertexes are added to last vertex cache, terrain tile block is rendered in index cache during rendering and one degraded triangle is added to render the skirt triangle. Meanwhile, for optimal performance, the skirt triangle and terrain tile block triangle need to be drawn by throwaway triangle strip. Even though the skirt algorithm may cause some light and texture tension problems, since filling crack is usually small, these problems are easily ignored. In addition, although this method can increase some polygonal quantity, this comparison can be ignored in comparison with applying CPU to suture and it is easily realized on GPU.
3.4. Realization of Extensible Quadtree
We can increase more details for elevation data by means of increase more sampling values, because the elevation data of our algorithm is stored in title quadtree. In order to increase more sampling values, quadtree must apply new tile extension. Since our purpose is to extend quadtree real-time, the elevation data with low resolution may be input but rendering may have higher level of detail.
(1) Dynamic and static node
level of dynamic node, these error values of dynamic node are not zero. Similar to dynamic error value, it is difficult to obtain exact value of dynamic error value. The method in this paper is to endow error value of child node as half of its parent node.
(2) Detail selection after adjustment
According to requirements, the nodes can dynamically increase to quadtree so each node in quadtree is internal node in principle. Therefore, during the selecting level of detail, it will not need to judge whether node is internal node or not. So this causes a little change on level of detail algorithm.
(3) Adding node to quadtree
Since leaf node error in quadtree is totally larger than zero, it can be judged whether leaf node has larger error, it needs higher level of detail chunk data. Dynamic node generation is a reverse process of level-detailed simplification. At first, its elevation data range of parent node is divided into four smaller domains. By increasing new sampling values between each line and column, the sampling density increases four times, as is shown in figure 4.
[image:6.595.185.410.321.444.2]The elevation data of new sampling value can be obtained through the calculation of above chapters’ fractal algorithm. Four new dynamic nodes are produced and insert in quadtree as four child nodes Using new elevation values.
Figure 4. Addition of the nodes of quadtree
RESULTS AND DISCUSSION
4.1 Computation of Error Simplification
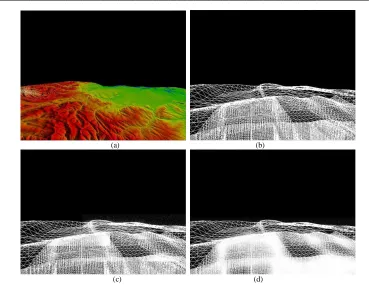
The experiment adopts the data of some area with 30-meter resolution DEM and 1-meter resolution remote sensing images. The original DEM size is 2266×1895 and the image size is 13974×11535. The original are resampled to make the DEM size be 2048×2048 and the image size be 8192×8192. Figure 5 describes the result of the firs experiment. (a) is the drawing effect of superimposed texture. (b), (c) and (d) are different terrain resolutions with different simplification control factors, when the viewpoints are at the some location.
(a) (b)
(c) (d)
[image:7.595.110.479.96.384.2]Figure 5. Experiment results
Figure 6 shows the comparison of drawing frame rate when improved method is used. Similar with previous results, since most data is eliminated, the drawing efficiency has been increased greatly. The improved scheme keeps stable state from beginning to end. The average frame rate is 34fps after simplification, compared the situation of 13.5fps without simplification. The drawing efficiency is increased by two times. When the viewpoint is roaming at the border of block data, the system should read and retrieve different data files on hard disk, which leads to instantaneous deterioration. If the simplification is not adopted, the due to the low drawing efficiency, it will not influence the final result. Compared to CLOD, the defect lies in that the level-detail is only related to the distance of viewpoint, and is nothing to do with the terrain conditions. So it is wasted to be used on flat areas triangle which has relative topography.
0 20 40 60 80 100 120 140 160 180 200
10 15 20 25 30 35
viewpoint
fr
a
m
e
r
a
te
Before Simplification After Simplification
4.2 Level-detailed Selection with Quadtree Structure
This experiment is based on 60-meter resolution STRM-Dem and 30-meter resolution Landsat7 images in most areas. The data is divided into 11 layers and the total amount of data is 30GB. The experimental data with higher resolution are added to basic data for multi-resolution rendering. Figure 7(a) and (b) are 0.5-meter high-resolution aerial images of some areas in aerial spot. The original size of image is 41400×34230 and the DEM resolution is 10 meters. The experimental data is divided into 6 layers. From these figures we can see that since the quadtree based on block is completely independent with other data block other itself, the data scheduling is simple and the scheduling efficiency is high. The skirt technology eliminating the crack from view has greatly simplified the algorithm. By batch processing and block data processing, the algorithm can better utilize the graphical processing ability of CPU and improve the drawing efficiency of data.
Figure 7. Drawing results of the mountains area in aerial spot
CONCLUSION
Satellite remote sensing and mapping technology is used to obtain stellar surface remote sensing image data and three-dimensional topographic data. Then three-dimensional visualization technology can help to draw three-dimensional graph for celestial bodies, which is one of the main tasks on space remote sensing. Considering that this paper needs to realize real-time dynamic display of global massive terrain, we comprehensively analyzes the advantages and disadvantages of mainstream LOD algorithm and integrates the features of three level-detailed algorithms on CLOD, Chunk-LOD and Geometrical Mipmapping. Then we propose an improved LOD algorithm based on extensible quadtree structure. Experiment proves that our algorithm is very suitable for real-time drawing of large range even globally geographical topographic data. But since space environment element is restricted by immaturity of computing model and less sampling monitoring sampling data, the obtained element data still have more invalid data. This paper only rejects these invalid data and replaces the nearest valid data. However, this processing method will result in data expression error, so there needs further research to improve data processing method to acquire the largest fitness of real data.
REFERENCES
[1]Gao W., Y. Gao and L. Liang. Journal of Chemical and Pharmaceutical Research. 2013a,5(9):592-598.
[2]Gelan Yang, Huixia Jin, and Na Bai. Mathematical Problems in Engineering, 2013, vol. 2013, Article ID 272567, doi:10.1155/2013/272567.
[3]Zhang B., Zhang S., Lu G.. Journal of Chemical and Pharmaceutical Research, 2013, 5(9), 256-262.
[4]YANG, Gelan, Yue WU, and Huixia JIN. Journal of Computational Information Systems, 2012, 8(10): 4315-4322.
[5]Yang G, He Q, Deng X. International Journal of Advancements in Computing Technology, 2011, 3(10).pp. 266-273.
[6]Wu Yue, Gelan Yang, Huixia Jin, and Joseph P. Noonan. Journal of Electronic Imaging, 2012, 21(1): 013014-1. [7]Gelan Yang, Huixia Jin, and Na Bai. Mathematical Problems in Engineering, 2014, vol. 2014, Article ID 632060, 13 pages, 2014. doi:10.1155/2014/632060.
[8]Yang G., Le D., Jin Y., Cao S. Q. International Journal of Distributed Sensor Networks, 2014, vol. 2014, Article ID 363584, doi:10.1155/2014/363584.
[10]Mike P, Papazoglou, Dimitrios Georgakopoulos. Service-Oriented Computing. Communications of the ACM,
2003, 46(10), 25-28.