Impact of Notch Geometry on the Pressure Bearing
Capacity of AISI 316L Austenitic Stainless Steel
under Fatigue Loading
J. Jagadesh Kumar1,*, G. Diwakar1, V. V. Satyanarayana2
1Department of Mechanical Engineering, Koneru Lakshmaiah Education Foundation (Deemed to be University), India 2Department of Mechanical Engineering, Vidya Jyothi Institute of Technology, India
Received August 28, 2019; Revised October 12, 2019; Accepted October 22, 2019
Copyright©2019 by authors, all rights reserved. Authors agree that this article remains permanently open access under the terms of the Creative Commons Attribution License 4.0 International License
Abstract
In the current research, pressure bearing capacity of AISI 316L austenitic stainless steel is evaluated under fatigue loading through finite element method (ANSYS 18.1) for a specimen with no notch on its surface. Thereafter, the pressure bearing capacity of the same specimen is evaluated with rectangular and V-notches at the center. The notch geometry is changed in terms of its width, depth and the notch central angle (perimeter length) for each of the rectangular and V-notched cases. Fifteen types of rectangular notch and V-notch geometries are undertaken for the research as required by Box-Behnken model of Response Surface Methodology (RSM) analysis. The primary objective of the research is to evaluate the impact of notch geometry on the pressure bearing capacity under fatigue loading conditions. It is observed that fatigue life degraded more with V-notched specimens when compared to rectangular notched ones. Regression equations are developed and surface plots are generated for both rectangular and V-notch cases for the pressure bearing capacity which is dependent on width, depth and notch central angle.Keywords
Fatigue Loading, Box-Behnken Model, Response Surface Methodology (RSM), Analysis of Variance (ANOVA)1. Introduction
When a material is subjected to repeated cycles of stress or strain, failure occurs by leading to fracture at some weak points and this type of a failure is termed as Fatigue. Fatigue deformation is caused by the synchronous action of cyclic stress, tensile stress, and plastic strain. The plastic strain occurring from cyclic stress initiates the crack, the
overestimation of the fracture or fatigue stress. The stress distribution exhibits a strong gradient which plays an important role [6]. Xuteng Hu et. al. studied the Effect of notch geometry on the fatigue strength of TC4 titanium alloy and concluded that notch with small radius can lead to high stress concentration and seriously reduce the HCF strength. Further it was concluded that the notch angle and notch depth can affect the HCF strength to a certain extent [7]. Yoshiaki Akiniwa et. al. studied the effect of notch on fatigue strength reduction of bearing steel in very high cycle regime and proved that for circumferentially notched specimens, fatigue fracture originated from the surface or very close to the surface. The slip deformation was root cause for crack initiation in high cycle and very high cycle regimes. The fatigue strength of specimens with notch was less than that of smooth specimens. The extent of reduction was observed to be smaller at longer lives [8].
In the current research, pressure bearing capacity of AISI 316L austenitic stainless steel is evaluated under fatigue loading through finite element method (ANSYS 18.1) for a specimen with no notch on its surface. Thereafter, the pressure bearing capacity of the same specimen is evaluated with different types of notches on the surface. The notch geometry is changed in terms of its width, depth and the notch central angle (perimeter length). Two variants of notches, viz. rectangular and V-notch are created at the center of the specimen. Fifteen types of notch
geometries are undertaken for each of the notch variants as required by Box-Behnken model of Response Surface Methodology (RSM) analysis. The primary objective of the research is to evaluate the impact of notch geometry on the pressure bearing capacity under fatigue loading conditions.
2. Experimental Methodology
2.1. Material
AISI 316L austenitic stainless steel is primarily used in naval and marine applications owing to its excellent corrosion resistance and high strength to weight ratio. The chemical and mechanical properties of the material are given in Table 1 and Table 2 respectively.
2.2. Specimen
[image:2.595.70.529.416.740.2]Fatigue testing is carried out for the chosen material employing the ASTM E606 standard specimen (Figure 1). At the center of the specimen, a notch is made varying the width, depth and length in terms of notch central angle for conducting the experimentation to evaluate the fatigue life. The cross-sectional view of the notches created on the specimens is illustrated in Figure 2.
Table 1. Chemical Composition (wt%)
Element C Mn Si Cr Ni Mo P S N Fe
% 0.03 2 0.75 17.00 12.00 2.5 0.045 0.03 0.1 Balance
Table 2. Mechanical Properties
Hardness (BHN) UTS (MPa) Yield Strength (MPa) Poisson’s Ratio Elastic Modulus (GPa)
142 485 170 0.25 193
Figure 1. Standard Fatigue specimen
Rectangular Notch V-notch Notch central angle
2.3. Solid Model
[image:3.595.306.536.111.230.2]The three-dimensional model of the specimen is prepared in CREO 3.0 and exported to Initial Graphics Exchange Specification (IGES) format. The 3-D solid model of the specimen is shown in the Figure 3.
Figure 3. 3-D solid model of the specimen
2.4. Finite Element Fatigue Analysis
The finite element fatigue analysis is carried out using ANSYS 18.1 workbench. It is employed to evaluate the applied pressure on the job in order to get the estimated fatigue life in cycles.
2.4.1. Finite Element Model
The specimen’s 3-D model in IGES format is imported into ANSYS 18.1 and then the finite element model of the specimen is prepared by using the ANSYS mesh tool with
a refinement level of 3. The finite element (FE) model is shown in Figure 4.
Figure 4. Finite Element model of the specimen 2.4.2. Boundary Conditions
[image:3.595.70.279.155.241.2]The left end of the specimen is fixed by applying a support at that end. A pressure of required magnitude is applied on the right end of the specimen. The maximum Von-Mises (Equivalent) stress induced is maintained at approximately 400MPa so that the fatigue life is always around 25800 cycles. This is achieved by the iterative approach of altering pressure so that the maximum Von-Mises stress is around 400MPa. The boundary conditions of a typical specimen without notch are shown in Figure 5.
[image:3.595.71.527.417.653.2]2.4.3. ANSYS Fatigue Tool
The strain life approach available in ANSYS 18.1 Fatigue tool out-of-box is considered for the analysis which is undertaken for the current research due to the presence of notch on the geometry of the specimen. Strain-Life approach takes into account, the local plastic strains induced at localized spots. Smith-Watson-Topper method of the strain life approach is used for the research as it gives conservative fatigue life value when compared to Morrow’s approach.
2.5. Design of Experiments
Several statistical methods exist for the analysis of any research results, however response surface methodology (RSM) technique is chosen in the current research due to its implicit strengths like ease in measuring the effects of parameters and their interactions [9, 10, 11]. Experimentation has been carried out by considering the three parameters each at the three levels as given in Table 3. The Box-Behnken model of the response surface methodology is employed with the chosen parameters and the experimental runs conducted are illustrated in Table 4. A response polynomial is fitted for pressure to be applied for the estimated fatigue life under different parameter combinations and it is in the form;
y = b0+ b1 x1+ b2x2 + b3 x3 + b4 x12+b5 x22+ b6 x32+b7 x1x2 + b8
[image:4.595.306.537.90.327.2]x2x3 + b9 x1x3. Table 3. Notch details
S.No Parameter Notation Notch Units Level
1 2 3
1 Width w mm 0.5 0.75 1
2 Depth d mm 0.5 0.75 1
3 Central angle a degrees 120 240 360
Table 4. Experimental runs undertaken
Run Notch Width Notch Depth Notch central angle
1 0.75 0.75 240º
2 0.75 0.5 360º
3 0.75 0.5 120º
4 1 0.75 120º
5 0.75 0.75 240º
6 0.5 0.75 360º
7 1 0.75 360º
8 0.5 0.75 120º
9 1 0.5 240º
10 0.75 1 360º
11 0.5 0.5 240º
12 0.75 1 120º
13 0.5 1 240º
14 0.75 0.75 240º
15 1 1 240º
The coefficients b0 to b9 are computed by least square
method and analysis of variance (ANOVA) is performed by Yate’s algorithm. The analysis is conducted at 95% confidence level and 5% level of significance.
3. Results and Discussion
[image:4.595.60.288.433.529.2]Figure 6. Von-Mises stress of specimen with no notch
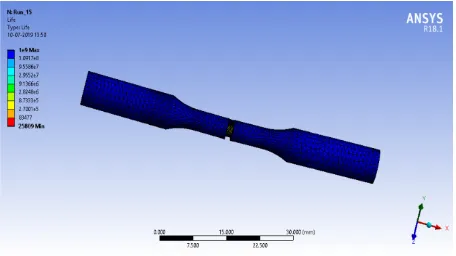
Figure 7. Fatigue Life of the specimen with no notch
[image:5.595.71.526.333.576.2](a) Rectangular notched specimen
[image:6.595.72.528.79.345.2](b) V-notched specimen
(a) Rectangular notched specimen
[image:7.595.69.528.75.679.2]
(b) V-notched specimen
(a) Rectangular notched specimen
(b) V-notched specimen
Figure 10. Fatigue Life for specimen with notch as specified in Run 15 In the case of rectangular notch, the pressure applied on
the specimen is lowest when the depth of the notch is at highest level and the notch central angle is 240º, while the pressure is highest when the notch central angle and depth of notch are at their low levels. It is also found that, when the notch is created throughout its peripheral circumference, the applied pressure was in the range of 28.24 to 46.3MPa, while the pressure is in the range of
34.93 to 52.7 MPa when the notch is restricted to a central angle of 120º.When the notch width is at lowest level, the pressure is in the range of 16.79 to 43.07 MPa and when the width is at highest level, the pressure is in the range of 19.48 to 8.59 MPa. The depth of notch caused a pressure range of 43.07 to 52.7 MPa and 16.79 to 34.93 MPa during its lowest and highest levels respectively.
[image:8.595.71.527.79.335.2]pressure bearing capacity compared to the rectangular notched specimens. The pressure to be applied is in the range of 26.1 to 37.85 MPa for the V-notched specimens while that of rectangular notched specimens exhibited a higher range of 16.79 to 52.7 MPa. It is an indication that fatigue life of rectangular notched specimens is higher than the V-notched specimens. It is also evaluated that the un-notched specimen has a pressure bearing capacity of 141.1 MPa to serve the desired fatigue life. It shows that the fatigue notch factor plays a vital role in the range of 2.5 to 3.5 in the specimens undertaken and higher the notch factor, lower is the fatigue life. The V-notched specimens are more susceptible to form micro-cracks at the root and a steep stresses gradient is formed compared to rectangular notched specimens and hence resulted in lower life or
lower pressure bearing range for the given fatigue life. However, a lower pressure bearing capacity is observed in rectangular notched specimens when the width is varying while the other two parameters are at their higher levels compared to V-notched specimens. This can be attributed to the local plastic deformation and notch blunting effect due to yielding at the notch root in case of V-notched specimens, which consequently reduce the notch root stress amplitude compared to rectangular notched specimens.
[image:9.595.73.524.280.532.2]The results of the fifteen runs (Table 5) are subjected to Response Surface Methodology analysis using the Box-Behnken model. The ANOVA results are computed using Yate’s algorithm and presented in Table 6 and Table 7 for rectangular and V-notched specimens respectively;
Table 5. Finite Element Results for rectangular and V-notched specimens
Run Width (mm) Depth (mm) Notch central angle (degrees)
Fatigue Life (cycles)
Applied Pressure (MPa)
Rectangular Notch V-Notch
1 0.75 0.75 240º 25826 25.80 26.45
2 0.75 0.5 360º 25849 46.30 40.40
3 0.75 0.5 120º 25855 52.70 36.15
4 1 0.75 120º 25801 46.38 34.35
5 0.75 0.75 240º 25826 25.80 26.45
6 0.5 0.75 360º 25803 37.58 35.83
7 1 0.75 360º 25835 34.59 28.53
8 0.5 0.75 120º 25808 35.78 36.19
9 1 0.5 240º 25844 48.59 34.25
10 0.75 1 360º 25810 28.24 29.39
11 0.5 0.5 240º 25818 43.07 35.50
12 0.75 1 120º 25866 34.93 23.96
13 0.5 1 240º 25832 16.79 37.85
14 0.75 0.75 240º 25826 25.80 26.45
15 1 1 240º 25809 19.48 26.10
Table 6. ANOVA of results from specimens with rectangular notch
Source Sum of Squares df Mean Square F-value
w 31.28 1 31.28 3.19
d 1040.14 1 1040.14 105.98
a 66.59 1 66.59 6.78
wd 2.00 1 2.00 0.2040
wa 46.17 1 46.17 4.70
da 0.0210 1 0.0210 0.0021
w2 16.46 1 16.46 1.68
d2 61.20 1 61.20 6.24
a2 420.46 1 420.46 42.84
SSE 49.07 5 9.81
[image:9.595.73.528.552.729.2]Table 7. ANOVA of results from specimens with V-notch
Source Sum of Squares df Mean Square F-value
w 61.272 1 61.272 4.31
d 105.125 1 105.125 7.39
a 1.531 1 1.531 0.11
wd 27.563 1 27.563 1.94
wa 7.453 1 7.453 0.52
da 0.348 1 0.348 0.02
w2 62.447 1 62.447 4.39
d2 30.254 1 30.254 2.13
a2 36.928 1 36.928 2.60
SSE 71.150 5 14.230
[image:10.595.60.525.149.673.2]SST 387.469 14
Table 8. Regression Equations
Notch Type Regression Equation Coefficient of Correlation
Rectangular notch
P = 25.80 + 1.98w - 11.40d -2.89a + 2.11w2 +4.07d2
+10.67a2 -0.71wd - 3.40wa
-0.07da
0.985
V-notch
P = 26.45 - 2.77w - 3.62d +0.44a +4.11w2 +2.86d2
+3.16a2 -2.63wd
-1.36wa+0.29da
0.9
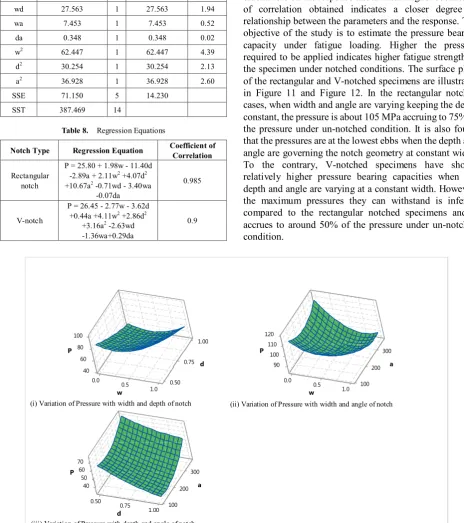
From the ANOVA and regression equations it can be concluded that depth and notch central angle are dominantly influencing the pressure bearing capacity under fatigue loading in rectangular notched specimens, while in the V-notched specimens, the depth and width are playing crucial role on the response undertaken. Higher coefficient of correlation obtained indicates a closer degree of relationship between the parameters and the response. The objective of the study is to estimate the pressure bearing capacity under fatigue loading. Higher the pressure required to be applied indicates higher fatigue strength of the specimen under notched conditions. The surface plots of the rectangular and V-notched specimens are illustrated in Figure 11 and Figure 12. In the rectangular notched cases, when width and angle are varying keeping the depth constant, the pressure is about 105 MPa accruing to 75% of the pressure under un-notched condition. It is also found that the pressures are at the lowest ebbs when the depth and angle are governing the notch geometry at constant width. To the contrary, V-notched specimens have shown relatively higher pressure bearing capacities when the depth and angle are varying at a constant width. However, the maximum pressures they can withstand is inferior compared to the rectangular notched specimens and it accrues to around 50% of the pressure under un-notched condition.
Figure 11. Surface plots for rectangular notch
0 4
0 . 0 0.5 60 80 0 1 0 . 0 50 1.0 . 0 7 0 0 . 1 75 0 1 0 P d w 0 9 0 0. 0.5 0 9 0 10 1 1 0 0 200 0 0 1 0 . 1 200 0 3 0 20 1 P a w 0 4
0.50 0.75 0 4 0 5 0 6 0 7 0 0 2 100 0 0 . 1 0 0 2 00 3 P a d
(iii) Variation of Pressure with depth and angle of notch i) Variation of Pressure with width and depth
Figure 12. Surface plots for V-notch
4. Conclusions
1. There is profound impact of notch geometry on the degradation of fatigue strength of any engineering structure.
2. Fatigue life is low with V-notched specimens compared to rectangular notched ones. This is concluded from the lower pressure bearing capacity of V-notched specimens when compared to their rectangular counterparts.
3. The V-notched specimens have 50% fatigue life while rectangular notched ones have 75% of fatigue life compared to un-notched specimen.
4. Higher coefficient of correlation yields a close relationship between parameters and the response.
Abbreviations
AISI: American Iron and Steel Institute RSM: Response Surface Methodology
ASTM: American Society for Testing and Materials FE: Finite Element
HCF: High Cycle Fatigue ANOVA: Analysis of Variance
Acknowledgements
The authors express their deep sense of gratitude to the Chair, Department of Mechanical Engineering, Koneru
Lakshmaiah Education Foundation (Deemed to be University) and Director, Vidya Jyothi Institute of Technology for their continuous support during the execution of the current research.
REFERENCES
Ralph I. Stephens, Ali Fatemi, Robert R. Stephens, Henry O. [1]
Fuchs, Metal Fatigue in Engineering, John Wiley & Sons, 2001.
M. Makkonen, Notch size effects in the fatigue limit of steel, [2]
International Journal of Fatigue, Vol. 25, Issue 1, pp. 17–26, 2002.
G.H. Majzoobi and N. Daemi, The effects of notch geometry [3]
on fatigue life using notch sensitivity factor, Transactions of The Indian Institute of Metals, Vol. 63, Issues 2-3, pp. 547-552, April-June 2010.
Y. T. Li, B. Chen, and C. F. Yan, “Effect of Parameters of [4]
Notch on Fatigue Life of Shaft Based on Product Lifecycle Management,” Mater. Sci. Forum, vol. 638–642, pp. 3864– 3869, 2010.
M. T. Yu, D. L. DuQuesnay, T. H. Topper, International [5]
Journal of Fatigue, Vol. 10, Issue 2, pp. 109-116, 1988. G. Pluvinage, Fatigue and fracture emanating from notch; [6]
the use of the notch stress intensity factor, Nuclear Engineering and Design, Vol. 185, pp. 173–184, 1998. Xuteng Hu, Xu Jia, Zhenqiang Bao, Yingdong Song, Effect [7]
35 . 0 05 0.75 35 0 4 5 4 50 5 0.50 0 0 . 1 0.75 .00 1 5 50 P d w 60
0 5. 0 0.75 60 5 6 0 7 5 7 0 2 0 00 1 0 1. 0 30 0 2 0 3000 5 7 P a w 0.50 0 75. 0
7 75 80 85
2 00 0 10 0 0 . 1 30 2 00
3000 85
P
a
d
i) Variation of Pressure with width and depth of notch (ii) Variation of Pressure wih width an
( d angle of notch
(iii) Variation of Pressure with depth and angle of notch
[image:11.595.77.510.72.357.2]of notch geometry on the fatigue strength and critical distance of TC4 titanium alloy, Journal of Mechanical Science and Technology, Vol. 31, Issue 10, pp. 4727 – 4737, 2017.
Yoshiaki Akiniwa, Nobuyuki Miyamoto, Hirotaka Tsuru, [8]
Keisuke Tanaka, Notch effect on fatigue strength reduction of bearing steel in the very high cycle regime, International Journal of Fatigue, Vol. 28, 1555–1565, 2006.
G. Sreeram Reddy, V.V.Satyanarayana, M.Manzoor [9]
Hussian, J. Jagadesh Kumar, Response prediction of reverse engineered freeform surface by design of experiments, Journal of Mechanical Engineering and Sciences, Vol. 12, Issue 4, pp. 4231-4242, 2018.
V.V. Satyanarayana, A. Chennakesava Reddy, and S. [10]
Sundararajan, Reduction of Casting Porosity in the Lost Wax Process Choosing Right Coating Materials by Response Surface Criteria, CEMILAC Conference, Ministry of Defence, India, 20-21 August, pp. 110-114, 1999.
Douglas C. Montgomery, Design and Analysis of [11]