Features Detection and Matching for Visual
Simultaneous Localization and Mapping (VSLAM)
Herdawatie Abdul Kadir
Department of Robotic & Mechatronic Engineering Faculty of Electrical and Electronic Engineering
Universiti Tun Hussein Onn Malaysia (UTHM) 86400, Batu Pahat, Johor, Malaysia
Mohd Rizal Arshad
Underwater Robotics Research Group (URRG) School of Electrical and Electronic Engineering Engineering Campus, Universiti Sains Malaysia (USM)
14300 Nibong Tebal, Pulau Pinang, Malaysia [email protected]
Abstract—This paper presents the feature detection method for aerial image. The image captured from the navigation was used to select the best landmarks for localization and mapping in SLAM. A robust visual detection method has contributed to better landmark and data association selection. Therefore, different feature detection algorithms were compared to evaluate the best landmark detector and descriptor for the VSLAM. The performances of the feature detectors were evaluated using dataset provided by the Robotics Research Group at University of Oxford. The local images of matching effect on the detector and descriptor have proved the correctness of key point matching. The selected method has been validated and proven efficient for the VSLAM.
Index Terms— VSLAM, Feature detection, SIFT, matching, detector.
I.INTRODUCTION
In order to perform long distance aerial observation, the blimp is considered as an attractive economic vehicle which enables efficient solution to better aerial visibility with lower vibration effect [1]. By introducing the cameras and sensors to this aerial platform, it will provide more potential information and eventually facilitate monitoring an area behavior over time effectively thus responds to the needs of many activities such as marine planning, climate research and accessing risk areas. This observation strategy was inspired by the migratory bird navigation; energy consuming in flight; perception of direction and navigating by landmark. In order to achieve the aim, SLAM wasimplemented to allow the vehicles to operate in an unknown environment, build the map of the environment and use the map to localize itself [2]. In addition, vision offers a large bandwidth of information, compared to laser or sonar, which enables landmark detection in cluttered environments. Therefore, the right detection method contributes to better localization and mapping. To achieve a quality detection of landmarks, feature detection method offers the best solution. There are several methods often used such as SUSAN [3], MSER [4], Harris-Laplace [5], SIFT [6], SURF [7] and FAST [8]. The study presented in this paper has analyzed the amount of key point detected and matching performance for several image conditions. The processing times also were discussed for each method. Several popular methods have been considered
such as Harris, LoG, Harris Laplace, Gilles, Susan, MSER, SURF and SIFT. The implementation of the methods helped the VSLAM to produce accurate navigation scheme. This paper is organized as follows. Section 2 introduces the feature detector method. Section 3 provides results for key point detection. While, Section 4 evaluates the matching performance, and Section 7 concludes the paper.
II.FEATURE DETECTION
This section introduces feature detection method that was used in the testing.
A.Maximally Stable Extrema Regions (MSER)
MSER is used as a method for blob detection in images. This affine-covariant detector is based on joined components of an appropriate threshold image. In MSER, every extremal region is a connected component of a threshold image. The threshold value needs to be tested, and the stability of the connected components was evaluated by choosing the most appropriate region value. This method produced a non binarized image [9].
B.Speeded Up Robust Features (SURF)
In this paper, the SURF included both detector and a descriptor. This SURF is one of the fastest methods which is similarly to SIFT. It uses the Determinant-of-Hessian (DoH) blob detector, and it is scale and rotation invariant. This method used the box filters to allow efficient computation (4 by 4 sub regions), with standard descriptor length of 64. It calculated a set of features of a rectangular neighborhood around an interest point [7].
C.Scale Invariant Feature Transform (SIFT))
III.EVALUATION AND DISCUSSION
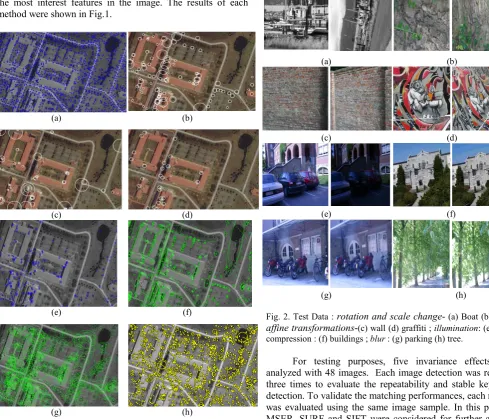
In this section, a series of testing was done to the features algorithms. Firstly, a number of types of visual features algorithm were considered as mentioned previously. Then, the appropriate method was selected to evaluate the method performance with several image conditions. Finally, the matching was done to select the best visual features method for aerial image for VSLAM. In this experimental setup, the features algorithms were executed on an Intel core 2 Duo by running the MATLAB with Window XP as the operating system. In the first part, the image used was an aerial image capture from 30 meter height. In the testing, nine feature detection methods were implemented on the image to analyze each method performance. To validate the method effectiveness, the key points detected were observed based on the most interest features in the image. The results of each method were shown in Fig.1.
(a) (b)
(c) (d)
(e) (f)
(g) (h)
Fig. 1. Visual Image detection, (a) Harris (b) LoG (c) Harris Laplace (d) Gilles (e) SUSAN (f) MSER (g)SURF (h) SIFT.
As can be observed, low frequency of key point detection and coverage were noticeable at Fig.1 (b)-(e). It is believed that the methods were unable to produce good result due to the
image invariance and noise. However, the reminder method displayed high key point detection. Therefore, three methods were chosen to test the matching performances. It has been decided to exclude the Harris detector because the point detector method was not invariant to scale and affine transformations. It is important to know which method can support good aerial image invariance against several conditions such as rotation, scale change, affine transformations, image compression, illumination conditions and blurring effect of the outdoor image. In order to validate the performance, the image dataset was provided by Mikolajczyk [10] with approximately 800 x 640 pixels resolution. Fig.2 shows samples of images for each category.
(a) (b)
(c) (d)
(e) (f)
[image:2.595.40.530.234.653.2](g) (h)
Fig. 2. Test Data : rotation and scale change- (a) Boat (b) Bark ; affine transformations-(c) wall (d) graffiti ; illumination: (e) light ; compression : (f) buildings ; blur : (g) parking (h) tree.
A.Scale / rotation
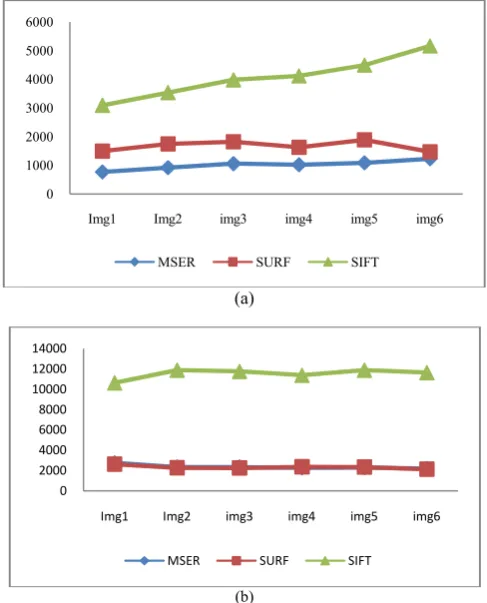
In this section, the image as illustrated in Fig. 2(a) was rotated 300 counter clockwise and scaling was done on the image. Denser images were also tested as shown in Fig. 2(b). Fig. 3(b) shows the performances of key point detection for the methods. Note that, Y axis represent the number of key point detected
(a)
[image:3.595.41.285.148.440.2](b)
Fig. 3. Test Data : (a) Boat (b) Bark
[image:3.595.310.554.247.549.2]Fig.3 (a)-(b) shows the performances of keypoint detection for the three methods. From comparison of results for the methods, the SIFT gave the highest keypoint detection. For rotation and scale invariance, SIFT produced the best result with 92.5% more detection compared to MSER and 72% more keypoint detection as compared to the SURF. However, as more keypoint detected, image complexity increased the processing time for each algorithm. The results of processing time were shown in Table I.
TABLE I. COMPARISON OF PROCESSING TIME: SCALE/ROTATION
Boat Bark
MSER Keypoint 3094 3436
Total time,s 8.77 8.874
SURF Keypoint 11276 4502
Total time,s 23.192 10.53
SIFT Keypoint 41634 27329
Total time,s 30.326 22.16
It is proven that SIFT also gave the best total time per key point detected for this inference as shown in Table I. As can be seen in Fig. 3(a), the image detection before the image was rotated has displayed higher value and decreased as the rotation became higher. However, the key point detection performance depends on the image complexity and scaling effect on the image capture
B.Affine transformations
In this section, the images as illustrated in Fig. 2(c) were taken from different viewpoints to represent the comparison of affine transformations. The graffiti and wall image which represent a dense image were tested to ensure the method stability. Fig. 4 shows the performances of key point detection for the methods.
(a)
(b)
Fig. 4. Test Data : (a) Graffiti (b) Wall
As shown in Fig. 4(a)-(b), the results showed a stable detection for the three methods. It can be observed that SIFT gave the highest key point detection. This method produced the best detection number for the test data (artwork) with 75% more detection compared to MSER and 58.8% more key point compared to SURF. For the second image representing the wall, MSER and SURF showed lower detection compared to SIFT with only 20% of key point detection. The results of processing time results were shown in Table II. The processing time also proved that SIFT key point detection gave the best
0 2000 4000 6000 8000 10000 12000
Img1 Img2 img3 img4 img5 img6
MSER SURF SIFT
0 1000 2000 3000 4000 5000 6000
Img1 Img2 img3 img4 img5 img6
MSER SURF SIFT
0 1000 2000 3000 4000 5000 6000
Img1 Img2 img3 img4 img5 img6
MSER SURF SIFT
0 2000 4000 6000 8000 10000 12000 14000
Img1 Img2 img3 img4 img5 img6
[image:3.595.55.271.609.714.2]total time per key point detected even in a high texture and distorted image.
TABLE II. COMPARISON OF PROCESSING TIME : AFFINE TRANSFORMATIONS
Graf Wall
MSER Keypoint 6087 14086
Total time,s 21.288 31.213
SURF Keypoint 10042 13931
Total time,s 20.592 27.624
SIFT Keypoint 24387 69073
Total time,s 22.215 44.54
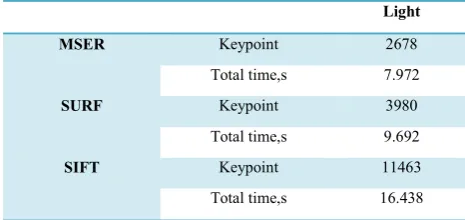
C. Illumination
[image:4.595.320.570.161.301.2]The outdoor image of different light condition was tested in this case. Fig.5 shows the performances of key point detection for the methods.
Fig. 5. Test Data : (a) Parking
The results showed that as the light condition became darker, the detection method has lower frequency of image detectablility. It can be observed from the result that MSER and SURF have lower results compared to SURF. This revealed that SIFT produced better detection in this condition and performed more than 75.6% compared to MSER and 65.3% better than SURF. The results of processing time were shown in Table III.
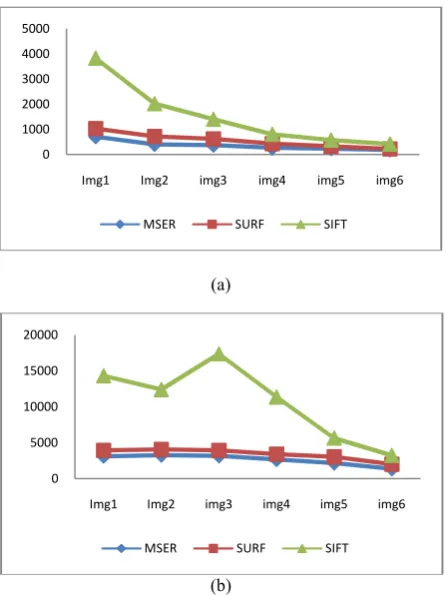
TABLE III. COMPARISON OF PROCESSING TIME : ILLUMINATION
Light
MSER Keypoint 2678
Total time,s 7.972
SURF Keypoint 3980
Total time,s 9.692
SIFT Keypoint 11463
Total time,s 16.438
It is proven that SIFT also gave the best total time per key point detected for this invariance.
D.Compression
[image:4.595.41.287.301.434.2]In this section, the image as illustrated in Fig. 2(f) was compressed to lower image quality. Fig. 6 shows the performances of key point detection for three methods.
Fig. 6. Test Data : (a) Building
As shown in Fig. 6, the performances showed a stable detection for three methods. As the images of compression were higher, the results for the three methods showed a key point reduction. The results showed that SIFT gave the highest key point detection. The SIFT method produced more detectable key point with 85.7% more than MSER and 75.1% more key point compared to SURF. However, the performance of SIFT showed low detection at image 5 and 6 compared to SURF that has maintained almost the same detection rate. The results of processing time were shown in Table IV.
TABLE IV. COMPARISON OF PROCESSING TIME : COMPRESSION
Compress
MSER Keypoint 5409
Total time,s 13.102
SURF Keypoint 9406
Total time,s 19.902
SIFT Keypoint 37849
Total time,s 27.885
It is proven that SIFT also gave the best total time per keypoint detected for this invariance. The processing time showed that the SIFT method was able to process 1361 key points in one second compared to surf with 473 per second. E.Blurring
In this section, the image as illustrated in Fig. 2(g) used the gaussian blur on the image. Denser images were also tested as shown in Fig 2(h). Fig. 7 shows the performances of key point detection for the methods.
0 500 1000 1500 2000 2500 3000
Img1 Img2 img3 img4 img5 img6
MSER SURF SIFT
0 1000 2000 3000 4000 5000 6000 7000 8000 9000
Img1 Img2 img3 img4 img5 img6
[image:4.595.321.543.486.592.2] [image:4.595.45.278.598.708.2](a)
[image:5.595.52.276.61.359.2](b)
Fig. 7. Test Data : (a) Parking (b) Tree
[image:5.595.348.517.156.292.2]The results showed that as the Gaussian value became bigger, the detection method produced lower frequency of image detection. As can be observed, the result for MSER and SURF have lower results compared to SURF. In Fig. 7 (a), SIFT produced 76% more compared to MSER and 63.3% better than SURF. For the second image in Fig. 7(b) , SIFT produced 75.4% more compared to MSER and 68.4% better than SURF. The results of processing time were shown in Table 5.
TABLE V. COMPARISON OF PROCESSING TIME : BLUR
Parking Tree
MSER Keypoint 2158 15795
Total time,s 6.743 35.458
SURF Keypoint 3306 20303
Total time,s 9.232 39.265
SIFT Keypoint 9015 64248
Total time,s 17.931 45.08
It is proven that SIFT also gave the best total time per keypoint detected for this invariance as shown in Table V.
F.Matching
The results of the testing showed that each method was able to produce stable detection. The number of matching was lower for MSER and SURF compared to SIFT.
TABLE VI. COMPARISON OF PROCESSING TIME :MATCHING PERFORMANCES WITH SIFT
SIFT performances Percentages (%)
SIFT vs. MSER
SIFT vs. SURF
Boat 95 56
Bark 96 93
Wall 78 67
Graffiti 38 -19
Light 79 68
Buildings 79 22
Blur 83 39
In Table VI, the results showed that for each category, SIFT was able to perform better matching compared to MSER and SURF. For example, for scale and rotation categories, SIFT has outperformed 95% more detection than MSER and 56 % more than SURF. These results showed that the SIFT method performed better except at the affine transformation where SURF outperformed 19% more detection than SIFT. One of the advantages of SIFT is that the capability to detect lots of keypoint features thus produce more matching possibilities. However, it will affect the processing time off due to a large number of data samples in a frame. In this work, the blimp was considered as a slow moving platform, which was required to detect interest landmark for VSLAM. Therefore, the use of SIFT will not be a problem and will help to select the best landmark with the appropriate number chosen to be matched at frames.
IV.CONCLUSION
In this paper, the visual features methods for landmark selection in VSLAM were analyzed. Due to payload limitation, monocular VSLAM method was chosen for the aerial image. In order to evaluate the features detection performance, several methods have been tested. Three best methods were further analyzed for the matching purposes to make sure the correct landmarks were detected. The results proved that the SIFT gave the highest key point number and matching pairs compared to MSER and SUFT. However, the total time required was higher due to a large number of detectable key points. The total time per key point detected showed that SIFT gave the fastest time. Therefore, for a slow-moving platform such as blimp that are used for monitoring application, it would be appropriate to choose SIFT as the feature detection method.
0 1000 2000 3000 4000 5000
Img1 Img2 img3 img4 img5 img6
MSER SURF SIFT
0 5000 10000 15000 20000
Img1 Img2 img3 img4 img5 img6
[image:5.595.48.277.522.636.2]ACKNOWLEDGMENT
The authors would like to thank the Malaysia Ministry of Science, Technology and Innovation (MOSTI), e-Science 305/PELECT/6013410, Ministry of Higher Education (MOHE), Universiti Sains Malaysia and Universiti Tun Hussein Onn Malaysia for supporting the research. They would also like to thank the anonymous reviewers for their comments and suggestion
REFERENCES
[1] H.A. Kadir and M. R. Arshad, "Modeling and Control Analysis of URRG Monohull Blimp" Procedia Engineering , vol. 41, pp. 216-223, Sep. 2012.
[2] Z. Danping and T. Ping, "CoSLAM: Collaborative Visual SLAM in Dynamic Environments," IEEE Transactions on Pattern Analysis and Machine Intelligence, vol. 35, no. 2, pp. 354-366, Feb. 2013, doi:10.1109/TPAMI.2012.104
[3] Weng Muyun and He Mingyi, "Image Feature Detection and Matching Based on SUSAN Method," First International Conference on Innovative Computing, Information and Control, 2006. ICICIC '06. , vol.1, pp.322,325, Aug. 2006.
[4] R. Kimmel, Cuiping Zhang, A.M. Bronstein, M.M Bronstein,"Are MSER Features Really Interesting?," IEEE
Transactions on Pattern Analysis and Machine Intelligence, vol.33, no.11, pp.2316,2320, Nov. 2011.
[5] I. Laptev, I. and T. Lindeberg , "Space-time interest points," Ninth IEEE International Conference on Computer Vision, pp.432,439 vol.1, 13-16 Oct. 2003.
[6] D.G. Lowe, “Distinctive image features from scale-invariant keypoints”, International Journal of Computer Vision, vol. 60,no. 2 ,pp. 91–110,2004.
[7] H. Bay, E. Andreas, T. Tuytelaars, and L. Van Gool."Speeded-Up Robust Features (SURF). Computer Vision and Image Understanding", vol.110, no.3, pp. 346–359,2008.
[8] T. Lindeberg, “Feature detection with automatic scale selection”, International Journal of Computer Vision,vol. 30, pp. 79–116, 1998.
[9] J. Matas, O. Chum, U. Martin, and T. Pajdla,” Robust wide baseline stereo from maximally stable extremal regions”. In Proceedings of British machine vision conference, vol. 1, pp. 384–393, 2002.
[10]K. Mikolajczyk, Oxford data set [Online]. Available: http://www.robots.ox.ac.uk/~vgg/research/affine/