Can Software Faults be Analyzed using Bad Code
Smells? : An Empirical Study
Preet Kamal Dhillon, Gurleen Sidhu
B.B.S.B.E.C,Fatehgarh Sahib
Abstract- The design of software systems can exhibit several problems which can be either due to inefficient analysis and design during the initial construction of the software or more often, due to software ageing, where software quality degenerates over time. The design problems appear as "bad smells" at code or design level and the process of removing them is termed as Refactoring.. This paper presents the results from an empirical study that investigated the relationship between the bad smells and class error probability in three error-severity levels in an industrial-strength open source system. Our research, which was conducted in the context of the post-release system evolution process, showed that some Bad code smells were positively associated with the class error probability in the three error-severity levels. This finding supports the use of bad smells as a systematic method to identify and refactor problematic classes in this specific context.
Index Terms- Bad code smell, software maintainability, software metrics, refactoring.
I. INTRODUCTION
hen we develop an Object Oriented Software system, its design change is continuous. In the process of maintaining an OO system after its release, the information on what classes have higher probabilities of containing errors than other classes can help the maintenance team allocate resources in various software engineering tasks such as testing and redesign. Understanding how the design structures of large systems evolve (after its release) and where the errors are likely to occur can enhance our knowledge about the relationship between relatively stable design structures and errors. (We assume that the design structures of a system is more stable after the system released than during the development.). According to Fowler [1], design problems appear as "bad smells" at code or design level and the process of removing them -Refactoring, i.e. an improvement in software structure without any modification of its behavior. Each bad smell, which can be identified by using a set of metrics and their threshold values, provides a more practical way of applying software metrics in the daily work of an engineer. It is held that to improve maintainability, code smells should be eliminated by refactoring. The maintainability of software is important, because it is one of the factors affecting the cost of the future development activities. It is claimed that classes that are involved in certain code smells are liable to be changed more frequently and have more defects than other classes in the code. In other words, it reflects code that is decaying and, unless eradicated, is likely to be the cause of frequent future maintenance, potential
faults, and associated testing overheads. Left unchecked and free to fester over time, smells can soon become ―stenches‖ with the potential for relatively high fault-proneness, added maintenance demands, and extra testing as outcomes industrial resonance— decaying systems consume vast developer resources. The Bad code smells can be understood as a new measure of software maintainability, because removing those bad smells from the code is claimed to make software more maintainable.
So, in our study, we are going to find the relationship between Bad Smells and Class Error Proneness in the three error severity levels that occur in post-release evolution of software for fault prediction using the regression analysis.
II. LITERATURE SURVEY
Message Chains and Middle Man) and software faults. In this paper they discuss how our results can be used by software developers to prioritize refactoring.They suggested that source code containing Duplicated code and Message Chain Bad Smell should be prioritizing for refactoring. Li and Shatnawi [12]
investigated the relationship between the class error probability and bad smells based on three versions of the Eclipse1 project. Their result showed that classes which are infected with the code smells- Shotgun Surgery, God Class or God Methods, have a higher class error probability than non-infected classes. Lozano et al. [8] assessed the impact of bad smells, i.e., the extent to which different bad smells influence software maintainability. They argued that it is possible to analyze the impact of bad smells by analyzing historical information. They concluded that, it is possible to assess code quality by detecting and visualizing bad smells. Khomh et al [9] in his paper, reported an exploratory study, performed on 9 releases of Azureus and 13 releases of Eclipse, which provided empirical evidence of the negative impact of code smells on classes change-proneness. He showed that classes with smells are significantly more likely to be the subject of changes, than other classes. He also showed that some specific code smells, are more likely to be of concern during evolution. Olbrich et al. [15] provided empirical evidence on the issue of how the code smells God Class and Brain Class affect the quality of software systems. They investigated the effects of both smells in three well-known, large-scale open source systems-without normalization with respect to size. The analysis shows that God and Brain Classes have a negative effect measured in terms of change frequency, change size and number of weighted defects. However, when the God and Brain Classes were normalized with respect to size, the results were opposite; these classes were less subject to change and had fewer defects than had other classes. DhillonPreetKamalet al.[17]
investigated whether the Bad code smells could predict the class error probability in the post-release evolution of Rhino and found that some Bad code smells could still predict class error probability.
III. EXPERIMENT DESIGN
This study has the objective to test the association between the occurrence of bad smells and class error proneness in each error- severity level.
We marked each class as erroneous if there was at least one error found in the class, or not erroneous if no error was found in the class; we also categorized each class according to the three severity categories (high, medium and low). If a class had two errors from two severity categories, we listed the class twice in the data set (one for each error severity).The categorization of the errors in the three categories (high, medium and low) were done on the basis of occurrences/frequency of the errors.
1. High: If the number of errors occurring were above 7, then it was marked as high severity level.
2. Medium: If the number of errors occurring were between 4 and 6(both inclusive), then it was marked as medium severity level.
3. Low: If the number of errors occurring were between 1and 3(both inclusive), then it was marked as low severity level.
A. The Bad Smells
The following bad code smells were used in the study as detected by the together tool[7].
1) GC(God Class): A class has the God Class bad smell if the class takes too many responsibilities relative to the classes with which it is coupled. The God Class centralizes the system functionality in one class, which contradicts the decomposition design principles. It is difficult to reuse or maintain a God Class. If there are errors in the God Class, the error propagation tends to affect a big part of the system.
In our study, we treat the God Class as a categorical variable, which has the value of either zero or one: zero means that the class is not a God Class and one means otherwise.
2) GM(God Method): A class has the God Method bad smell if at least one of its methods is very large compared to the other methods in the same class. In analogy to God Class, the God Method centralizes the class functionality in one method. It is very difficult for us to understand and maintain large methods and we should split a large method into two or more methods. ― In our study, we treat the God Method as an integer variable whose value indicates the number of God Methods in the class. 3) RB (Refused Bequest): A class has the Refused Bequest bad smell if the class inherits methods that it does not use at all. These unused methods are indicators of bad abstraction and impair to the inheritance hierarchy. This problem can be solved by extracting these methods to a new class at the same level in the inheritance hierarchy.
In our study, we treat the Refused Bequest as an integer variable whose value indicates the number of methods that the class inherits but do not use at all.
4) SS(Shotgun Surgery): A class has the Shotgun Surgery bad smell if a small change in the class causes many different changes to many classes. Shotgun Surgery is an indicator of complicated low-level couplings, which propagate changes and errors to the coupled classes; this phenomenon decreases the maintainability of the class.
In our study, we treat the Shotgun Surgery as a categorical variable, which is assigned either zero—if there is no Shotgun Surgery in the class—or one otherwise.
5) FE(Feature Envy): A class has the Feature Envy bad smell if one of its methods calls many get-methods from other objects to calculate data values. The Feature Envy indicates problems in the class abstraction.
In our study, we treat the Feature envy as an integer variable whose value indicates the number of Feature Envy methods in the class.
6) LMC (Long Message Chain): This smell means a case, where a class asks an object from another object, which then asks another and so on. The problem here is that the first class will be coupled to the whole class structure. To reduce this coupling, a middle man can be used.
In our study, we treat the Long Message Chain as a categorical variable, which is assigned either zero—if there is no Long Message Chain in the class—or one otherwise.
one class to another one should depend on the smallest possible interface. Even if there are objects that require non-cohesive interfaces, clients should see abstract base classes that are cohesive. Clients should not be forced to depend on methods they do not use, since this creates coupling.
In our study, we treat the ISP Violation as a categorical variable, which is assigned either zero—if there is no ISP Violation in the class—or one otherwise.
B. The hypotheses
The objective of this study is to investigate empirically the relationship between the bad smells and class error probability in the three error severity levels.
• Hypothesis1: The Bad code smells cannot be associated with errors of the high-level severity in a class.
• Hypothesis 2: The Bad code smells cannot be associated with errors of the medium-level severity in a class.
• Hypothesis 3: The Bad code smells cannot be associated with errors of the low-level severity in a class.
We tested the association between bad smells and each error-severity level in Hypotheses 1–3. We assumed that each error severity level could be associated with different set of bad smells. We reject Hypothesis 1–3 if at least one of the seven bad smells is associated significantly with error-severity level.
IV. THE STATISTICAL MODEL
In our model we use a categorical variable indicating the error-severity level (we used it to test hypotheses 1–3). We used the Multinomial Multivariate Logistic Regression (MMLR) to study the association between bad smells and the various error-severity levels (the categorical dependent variable). The model is used for purpose of validating the association between bad smells and error proneness or error-severity levels of classes.
The MMLR model is built using only the significant bad smells; however, some bad smells may not contribute significantly at the multivariate level, so we do not include them in the multivariate model.
Univariate Multinomial Regression (UMR) test was done to examine whether there was any significant association between a Bad code smell and various error severity levels. Significant Bad code smells were used for next step of analysis. Multinomial Multivariate Logistic Regression (MMLR) was used to predict class error probability in each error category.
We reject Hypothesis 1–3, if one or more bad smells enter the MMLR model at 95% significance level, i.e. the P-value < 0.05. The general MMLR model (the UMR model is a special case of MMLR when n is one) is as follows:
where
vector ,and
is the logit function for category j;
m: the number of categories; ∏the probability of error in category j;
Y: the dependent variable—it is a categorical variable;
Xi (1 <= i<= n): are the independent variables, which are the Bad code smells investigated in this study;
Bji (0<= i<= n) are the estimated coefficients from maximizing the log-likelihood.
V. DATA COLLECTION
We collected errors for three releases of Rhino project version 1.5, 1.6 and 1.7 using the FindBugs[10] tool. FindBugs is a program which uses static analysis to look for bugs in Java code. FindBugs gives list of probable bugs or errors along with their package name, class name and method name. After that we collected the Bad code smells for all the three versions of Rhino using the Together[7] tool. Together tool is a plugin in eclipse for finding the Bad code smells. Bad code smells used in study are SS, FE, RB, GC, GM, ISP Violations and LMC. Next we associated errors with each class in Bad code smell list. Each class was marked erroneous if at least one error was found and not erroneous if no error was found. After this we further categorized the classes under the error category namely- high, Medium or Low.
VI. ANALYSIS AND RESULT
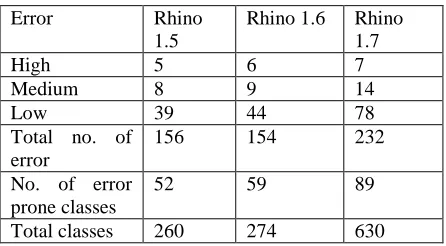
In analyzing the relationship between bad smells and class error proneness, under each severity level it is important to know the distribution of errors and bad smells in the three releases. Therefore, we report these distributions in Tables I and II. Table II shows the number of classes that had bad smells. We also provided the total number of classes that had Bad code smells in each release in the last row of the table.
Table I:Distribution of Errors
Error Rhino
1.5
Rhino 1.6 Rhino 1.7
High 5 6 7
Medium 8 9 14
Low 39 44 78
Total no. of error
156 154 232
No. of error prone classes
52 59 89
[image:3.612.334.557.432.555.2]Total classes 260 274 630
Table II: Distribution of Bad code Smells
Bad Smell Rhino 1.5 Rhino 1.6 Rhino 1.7
SS 20 27 44
FE 36 42 45
RB 5 20 41
GC 17 18 22
GM 57 74 80
LMC 5 10 35
ISP 16 22 18
A. The selection of the significant Bad code smells
We use the UMR (Univariate Multinomial Regression) analysis to investigate whether the seven bad code smells(SS, FE, RB, GC, GM, LMC,ISP)are associated with the three error-severity categories. A bad code smell is significantly associated with an error-severity category if its P-value in the UMR analysis is less than 0.05 in all the three severity levels i.e. High, Low and Medium.
Table III shows the results of the MMLR test after the insignificant bad smells were eliminated. We used 0.05 as the cutoff P-value. In the table below the insignificant Bad code smells have been highlighted as these are the smells with significance value more than 0.005, so they have been left out of the MMLR Analysis. The FE (Feature Envy) and RB(Refused Bequest) have been identified as insignificant.
Table III: Univariate Multinomial Regression Analysis
Bad Smell
Cat eg-ory
Rhino 1.5 Rhino 1.6 Rhino 1.7
B Sig. B Sig. B Sig.
SS H
L M 3.169 1.272 2.904 0.000 0.031 0.000 2.055 1.390 2.055 0.024 0.003 0.007 2.592 1.566 2.592 0.000 0.000 0.000
FE H
L M 0.783 0.347 0.602 0.002 0.160 0.024 0.706 0.398 0.638 0.010 0.110 0.019 0.502 0.250 0.531 0.035 0.263 0.011
RB H
L M -16.157 1.316 -16.157 - 0.157 0.999 2.876 1.218 -16.506 0.0022 0.189 - -16.601 0.817 0.920 - 0.227 0.176
GC H
L M 23.973 3.290 3.546 - 0.000 0.001 4.499 2.383 4.190 0.000 0.001 0.000 3.983 3.255 4.312 0.000 0.000 0.000
GM H
L M 4.185 2.833 3.301 0.000 0.000 0.000 2.126 1.067 1.916 0.000 0.000 0.000 1.375 1.073 1.375 0.000 0.000 0.000 LMC H
L M 3.258 -17.447 3.546 0.0014 - 0.001 1.351 -19.552 0.805 0.045 - 0.339 1.142 0.816 1.380 0.020 0.016 0.000 ISP H
L M 3.121 1.357 3.526 0.002 0.043 0.000 1.138 0.736 2.237 0.280 0.176 0.001 3.574 2.342 3.191 0.000 0.000 0.000
To select an optimal set of independent variables, we perform MMLR (Multivariate Logistic Regression) on the set of bad code smells that have been selected from the above table to generate the models. The final MMLR Analysis are shown in Table IV to VI. Each table shows the coefficient (B) and P-value (Significance) of bad code smells included in the study. In the table, we have highlighted the bad code smells that have significance more than 0.05, signifying they are being not the good predictors for error proneness.
Error Category
B Significance
[image:4.612.331.559.56.152.2]High Intercept SS GC GM -29-611 4.704 22.947 4.762 .000 .019 . 0.000 Low Intercept SS GC GM -2.295 1.206 1.706 2.539 .000 .078 .074 .000 Medium Intercept SS GC GM -4.829 3.275 1.416 3.097 .000 .000 .249 .000
Table V: Mmlr Analysis for Rhino 1.6
Error Category
B Significance
[image:4.612.39.302.261.523.2]High Intercept SS GM -6.722 3.677 2.340 .000 .006 .000 Low Intercept SS GM -1.952 1.343 0.988 .000 .005 .000 Medium Intercept SS GM -5.140 2.819 2.009 .000 .003 .000
Table VI: Mmlr Analysis for Rhino 1.7
Error Category
B Significance
High Intercept SS GC -5.058 2.165 3.372 .000 .000 .001 Low Intercept SS GC -2.345 1.144 2.970 .000 .002 .000 Medium Intercept SS GC -4.455 2.134 3.706 .000 .000 .000
In Rhino 1.5, SS and GM Bad code smells are significant predictors of class error probabilities in the two error categories-High and Medium and GM Bad Code smell was a significant predictor in the Low error Category. In Rhino 1.6, SS and GM are significant predictors of class error probabilities for all the three error categories. In Rhino 1.7, two Bad code smells namely SS and GC were significant predictors of class error probabilities for all error categories.
B. Models’ Accuracy Evaluation
We learned through the MMLR analysis that we could use some Bad code smells to predict class error-proneness in the post-release evolution of Rhino. This strong association suggests some errors in the source code are indeed related to the design structure of the system (at the class level) in the development as well as the post-release evolution phase of a system.
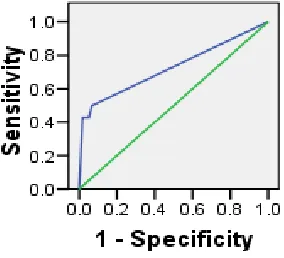
[image:4.612.58.280.647.720.2]correctly predicted classes in theerror category; it is the complement of the Type II error rate.) and false-positives (1 – specificity), the specificity is the percentage of the correctly predicted classes in the no-error category; it is the complement of the Type I error rate, for an entire range of cutoff points. The area under ROC curve ranges between 0 and 1; it measures the discrimination power of the models.
The general rule to evaluate the discrimination is: If 0.5 <= ROC < 0.6: no discrimination
[image:5.612.366.504.58.202.2]If 0.6 <= ROC < 0.7: poor discrimination If 0.7 <= ROC < 0.8: good discrimination If 0.8 <= ROC < 0.9: excellent discrimination If 0.9 <= ROC < 1.0: outstanding discrimination
Table VII: Area under Roc curve for Mmlr models.
Rhino Version High Low Medium
Rhino 1.5 0.998 0.319 0.828
Rhino 1.6 0.976 0.347 0.845
1Rhino.7 0.75 0.404 0.725
Figure 1 Rhino 1.5 High Category.
Figure 2 Rhino 1.5 Low Category.
Figure 3 Rhino 1.5 Medium Category.
[image:5.612.38.301.244.589.2]Figure 4 Rhino 1.6 High Category.
[image:5.612.369.506.430.559.2]Figure 5 Rhino 1.6 Low Category.
[image:5.612.371.513.594.713.2]Figure 7 Rhino 1.7 High Category.
Figure 8 Rhino 1.7 Low Category.
Figure 9 Rhino 1.7 Medium Category.
C. Evaluating models on successive releases
Because our goal was to predict the error-prone classes, we experimented with the use of the prediction model in one release to predict the error-prone classes in the future releases. We applied the Rhino 1.5 prediction model to the Rhino 1.6 and Rhino 1.7 data, Rhino 1.6 prediction model to the Rhino 1.5 and Rhino 1.7 data and Rhino 1.7 prediction model to the Rhino 1.5 and Rhino 1.6 data. Table VIII shows the results.
Table VIII: Application of Mmlr models on other releases
Data/Model Category Rhino 1.5
Rhino 1.6
Rhino 1.7
Rhino 1.5
High Low Medium
0.998 0.319 0.828
0.993 0.306 0.822
0.949 0.405 0.713
Rhino 1.6
High Low Medium
0.974 0.356 0.702
0.976 0.347 0.845
0.841 0.406 0.684
Rhino 1.7
High Low Medium
0.816 0.387 0.412
0.820 0.379 0.723
0.75 0.404 0.725
Table VIII shows application of MMLR model on other two releases of Rhino data. From the results, we can analyze that model for all the three versions of Rhino 1.5, 1.6 and 1.7 gave very good results in the high category, the values were mostly above 0.9. For the versions under the medium category, the ROC curve gave good discrimination as the values ranged between 0.70 and 0.85.But for low category model, for all the three versions the result is far below satisfaction level i.e. between 0.3 and 0.4.
VII. CONCLUSION
In this paper we have discussed software maintainability and how it can be achieved using refactoring techniques. The Bad code smells discussed help the developers in deciding whether to refactor a certain part of the software. We investigated whether the Bad code smells could predict the class error probability in the three error-severity levels in the post-release evolution of Rhino and found that some Bad code smells could still predict class error probability. Table IV-VI gave the Analysis model for error prediction. For checking the error prediction accuracy we have formed the ROC curves. ROC curves for MMLR model gave very good results in the high and medium error categories but unsatisfactory results for the low category.. And when one model is applied on other version’s data, results were satisfactory (Table VIII) as it closely matched with the values of predicted model value (Table VII). So, we can conclude that predicted models can work satisfactorily for predicting the errors in general. The finding also suggests that refactoring a class, besides improving the architectural quality, reduces the probability of the class having errors in the future.
VIII. THREATS
We have collected errors with the help of open source software FindBugs. We make no claims about errors discovered using software. The Bad code smell data were collected with the help of Together tool. We make no claims about the accuracy of these tools but we believe that the Bad code smell data collected were consistent.
REFERENCES
[1] Fowler, Martin, 2000. Refactoring: Improving the Design of Existing Code. Addison-Wisely.
[image:6.612.92.233.252.389.2] [image:6.612.94.236.431.560.2][3] A. Deursen, L. Moonen, A. Bergh, and G. Kok, ―Refactoring test code,‖ in Proceedings of the 2nd International Conference on Extreme Programming and Flexible Processes in Software Engineering (XP2001), M. Marchesi and G. Succi, Eds., May 2001
[4] E. van Emden and L. Moonen, ―Java quality assurance by detecting code smells,‖ in Reverse Engineering, 2002. Proceedings. Ninth Working Conference on, 2002, pp. 97–106.
[5] M. V. M¨antyl¨a, J. Vanhanen, and C. Lassenius, ―Bad smells— humans as code critics,‖ in Proceedings of the 20th IEEE International Conference on Software Maintenance (ICSM’04), pp. 399–408, Chicago, Ill, USA, September 2004
[6] M. V. M¨antyl¨a and C. Lassenius, ―Subjective evaluation of software evolvability using code smells: an empirical study,‖ Empirical Software Engineering, vol. 11, no. 3, pp. 395–431, 2006.
[7] Software Architecture Design, Visual UML & Business Process Modeling
from Borland 2010,
http://www.borland.com/us/products/together/index.html.
[8] A. Lozano, M. Wermelinger, and B. Nuseibeh, ―Assessing the impact of bad smells using historical information,‖ in Proceedings of Ninth international workshop on Principles of software evolution: in conjunction with the 6th ESEC/FSE joint meeting. Dubrovnik, Croatia: ACM New York, NY, USA, 2007, pp. 31–34.
[9] Foutse Khomh, Massimiliano Di Penta, and Yann-Ga¨el Gu´eh´eneuc, ―An Exploratory Study of the Impact of Code Smells on Software Change-proneness‖, in Proceeding of WCRE,2009, pp. 75-84
[10] FindbugsTM -Find bugs in java programs, http://findbugs.sourceforge.net (2010)
[11] Hosmer, D., Lemeshow, S.: Applied Logistic Regression, Wiley Series in Probability and Statistics, second edition (2000)
[12] Li, Wei .and Shatnawi, Raed, 2007. ―An empirical study of the bad smells and class error probability in the post-release object-oriented system evolution‖ Journal of Systems and Software, Vol. 80, No. 7, pp. 1120-1128.
[13] Montgomery, D., Peck, E., Vining, G., 2001. In: Introduction to Linear Regression Analysis, third ed.Wiley Series in Probability and Statistics Wiley-Interscience.
[14] Bryton, S., Abreu, F.B., and Monteiro, M.,2010. ―Reducing Subjectivity in Code Smells Detection: Experimenting with the Long Method‖,Seventh International Conference on the Quality of Information and Communications Technology, Vol., pp. 337-343.
[15] Olbrich, S. M., Cruzes, D. S., and Sjøberg, D. I.K.,2008. ―Are all Code Smells Harmful? A Study of God Classes and Brain Classes in the Evolution of three Open Source Systems‖ Software Maintenance, ICSM, 2010 IEEE International Conference , pp. 1-10.
[16] Zhang M., Baddoo, N. , Wernick, P., and Hall, T.,2011 ―Software Testing, Verification and Validation Workshops‖, ICSTW, IEEE Fourth International Conference ,pp 458 – 464.
[17] Dhillon PreetKamal, Sidhu Gurleen, ―Bad Code Smells:Software Maintainability Indicators‖ , Journal of Current Engineering & Research (ISSN : 2250-2637), Vol 2 No2, March-April 2012
AUTHORS
First Author – PreetKamalDhillon, B.Tech(CSE),M.Tech(Pursuing), B.B.S.B.E.C, Fatehgarh Sahib Email id - [email protected]
Second Author – GurleenSidhuB.Tech(CSE), M.Tech,