Identification and Classification of Rice varieties using
Mahalanobis Distance by Computer Vision
Neelam*, Jyoti Gupta**
*
Department of Electronics and communication, MMEC Ambala
**
Department of Electronics and communication, MMEC Ambala
Abstract- In this paper, an algorithm for identification and classification of four different varieties of rice, using the color and morphological features is presented. The proposed algorithm consists of several steps:- Image acquisition, Image Segmentation, Feature selection and Extraction, identification and classification. The identification and classification is done by the Mahalanobis distance. The color features i.e.,( Red Green Blue) and morphological features i.e.,( Area, perimeter, MajorAxislength, MinorAxislength, eccentricity) are used for identification and classification purpose. RGB color modal is used. Mahalanobis distance is used as a identifier and also classifier.
Index Terms- color features, computer vision, feature extraction, feature selection, image segmentation, Mahalanobis distance, morphological features.
IINTRODUCTION
Rice is one of the most important cereal grain crops. The quality of rice seeds has distinct effect on the yield of rice, so the proper inspection of rice seed quality is very important. Quality of rice grains is required for protecting the consumers from sub standards products because the samples of food material are subjected to adulteration. For the identification and classification purpose, four varieties of rice i.e., Basmati, Tural, 6622, 1509 are used.
Manual Identification of object is based upon traditional visual quality inspection performed by human beings, which may be tedious, time-consuming, slow, less efficient and non-consistent. The research of human-computer interaction is no longer the design of devices and psycho-logical experiments of windows layouts, but evaluates to a new stage: intelligent interaction. One aspect is that computers should be able to accept audio and visual sensory inputs, and then make some kind of analysis and interpretation, and then provide intuitive feedbacks by synthesizing speech, video or actions. Fundamentally, besides speech recognition, computers should be able to recognize, interpret and understand human actions and behaviors from visual inputs. Technological advancement is gradually finding applications in identification and classification of objects in industry for quality purpose. It is one of great challenge to meet this requirement. Identification and classification of objects is accomplished based on attributes like appearance, color, shape and sizes.
Rice quality inspection by humans (relying upon the naked eye) is neither objective nor efficient. Error creep in sometimes due to inexperience or the inspection may be deliberately shifted out of sympathy for the producers. In view of this, automated rice quality inspection using computer vision is desirable to perform fast and objective quality measurement.
The color of rice is one of the main factors of the evaluating the quality. While detecting the rice varieties by the color features, people adopt more RGB color space and HSV color space; in addition, L* a* b* color space is also commonly used to extract the color feature value [2,3].
During the last decades several studies have been carried out related to the application of machine vision for quality evolution, Zhao-yan et al., 2005 proposed a method of identification based on neural network to classify rice variety using color and shape features with accuracy of 88.3% [7]. Verma (2010) extracted six morphological features (area, perimeter, maximum length, maximum width, compactness and elongation) to classify three varieties of Indian rice. A neural network was used with an accuracy ranging from 90 to 95% [8]. In another research, Van Dalan (2004) developed a method for determination of the rice size and the amount of broken rice kernels using image analysis [9]. Regarding the quality evaluation of rice, a new method has been developed to estimate the breakage and fissures ratio [10].
In a primary study Zayas et al., 1989 used machine vision to identify different varieties of wheat and to discriminate wheat from non-wheat components [11]. In later research Zayas et al., 1996 found that non-wheat classification methods could be improved by combining morphometry (computer vision analysis) and hardness analysis. Hard and soft recognition rates of 94% were achieved for the examined seventeen varieties [12]. In 978-1-4577-1535-8/11/$26.00 ©2011 IEEE another report, the discrimination power of size, shape, color and texture for the identification of seeds of fifty seven weed species was assessed. Size and shape characteristics had larger discriminating power than color and texture ones. However, all of these features are required to reach an acceptable identification performance for practical applications [13].
rice varieties with high accuracy using comparing the performance of the some feature selection algorithms during the classification process.
II METHODOLOGY
The block diagram shown in Fig. 1 illustrates the procedure for recognition and classification of rice grains.
Block diagram 1. Image recognition and classification of rice grains
A. Image Acquisition
In this work, RGB is used. RGB color model is used because red, green and blue are three primary colors. These are pure colors, no white light mixed to them Many image segmentation approaches take advantage of this. Segmentation is usually performed in one color feature (hue) instead of three, allowing the use of much faster algorithm. A new approach for classification of rice variety using Mahalanobis distance will be presented.
A CCD (charge coupled device) color camera (Model Canon EOS 5 D Mark III) with resolution of 1670 pixels×1259 pixels will used to record images. For image acquisition, a lens (Model Canon EF 75-300 f4-5.6 Mk III USM) with 102 mm focal length is fitted to the camera using an extension tube of 35 mm length. The camera is mounted on a stand which provided easy vertical movement and stable support for the camera. The exposure time is 1/125 sec. When the camera is fixed at the place 130 mm between the lens and the sample table, clear images of rice varieties is obtained.
(a) (b) (c) (d)
Figure 2. (a)Basmati (b) Tural (c) 6622 (d) 1509
Image Acquisition Image segmentation Feature Extraction
[image:2.612.50.572.521.688.2]Every object could be situated in any random orientation and at any position inside the field of view. The background is a black paper. The color representation of objects of interest is relatively R (red), G (green), and B (blue) values at every pixel. The distant Gray level separation between background and objects made the image segmentation easier.
B. Image Segmentation
The goal of segmentation is to simplify and/or change the representation of an image into something that is more meaningful and easier to analyse. Image segmentation is typically used to locate objects and boundaries (lines, curves, etc.) in images. More precisely, image segmentation is the process of assigning a label to every pixel in an image such that pixels with the same label share certain visual characteristics.[1]
In this work, morphological features and color features (RGB features) are required to be extracted. So the image must retain the color information of the rice varieties when segmentation is processed.
C. Features Extraction and Feature Selection
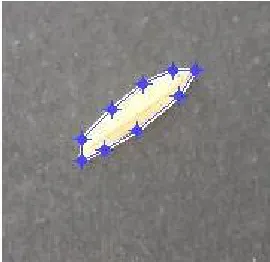
There are two features extracted by the given flow chart i.e., Morphological feature and color feature. Initially, RGB image is taken as input sample. The input image is form of pixels. First feature was Morphological feature. For extracting the morphological feature, process was stared from reading the image. After reading the sample image, there was a need of conversion of RGB to GRAY image. Gray image is just retaining the luminance of the image (figure 3). Next step of conversion was Binarisation by thresholding( figure 4). In the binary image, it reduced the image into only two values (0, 1). Morphological Parameters were extracted by edge detection from binary image(figure 5). The selected parameters were Area, MinorAxislength, MajorAxislength, Eccentricity, Perimeter.
Figure 3 Figure 4 Figure 5
Second feature to be extracted was the color feature. There were different color values of RGB pixels within the specified range according to pure image. It includes selection of region of interest from RGB input image ( figure 6) and RGB components were extracted ( figure 7) and mean and covariance matrix was calculated .
[image:3.612.228.363.578.709.2]
Figure 7
D. Object identification and classification
In this work, Mahalanobis distance was used for object identification and classification.
Mean Vector and covariance matrix computation:
From the coordinates of the points of RGB, the variance can be computed as:
where Ri, Gi,, Bi , are the values of the ith match (i=1, 2, 3,…, n) and Ro, Go, Bo are the values of the mean color given by
where T = ( R, G, B )
Mahalanobis Distance
The Mahalanobis distance provides a relative measure of a data point's distance from a common point. The Mahalanobis distance is used to identify similarity of an unknown sample set to a known one. Theoretically, the Mahalanobis distance is simply the distance of the test point from the center of mass divided by the width of the ellipsoid in the direction of the test point.
Features of Mahalanobis distance: - Mahalanobis distance produces simple and efficient way for object identification. It takes distribution of the points (correlations) into account to classify observations into different groups. It takes into account not only the average value but also its variance and the covariance of the variables measured. It compensates for interactions (covariance) between variables and it is dimensionless.
(
)
2 1,
1
/
1
)
var(
i On
i R
R
n
R
R
R
=
=
−
Σ
−
=
σ
2
1
,
1
/
1
(
)
)
var(
i on
i G
G
n
G
G
G
=
=
−
Σ
−
=
σ
2 0 1
,
1
/
1
(
)
)
var(
B
n
B
iB
n
i B
B
=
−
Σ
−
=
=σ
i n iO
n
T
Advantages of Mahalanobis distance: -
This algorithm produces good result for 2D as well as 3D images. The identification can also be achieved for occluded/hidden images. Mahalanobis distance is widely used in cluster analysis.
III Results and Discussion
The computer vision system was designed for identification and classification purpose. With four rice seed of different quality,40 images are taken ,10 for each rice seed from different position of rice at different angle from same distance using computer vision system and Mahalanobis distance is implemented for identification and classification of rice grains.
With reference to one reference image as shown in figure:
Reference Image
Mahalanobis distance is implemented to all rice seeds (test images) for identification .The Mahalanobis distance is found to be approximate similar for all basmati rice, i.e. 3.8213 , 12.7619 , 5.7460, 13.5522, 8.2823.
After calculating Mahalanobis distance, rice seed can be classified on basis of their color, size and shape attributes as shown below:
Type
Image
Mahalanobis Distance
BASMATI 3.0998-16.1702
TURAL 120.5513-662.5371
6622 8.5223-25.5441
References