Abstract
Although osteoporosis reduces overall bone mass causing bone fragility, recent studies report that the remaining bone tissue is signifi cantly stiffer. Preliminary studies indicate that alterations in bone tissue mineral content might explain these changes, albeit that other studies report conflicting observations. The objective of this study is to quantify whether the distribution of bone tissue mineral is altered during oestrogen defi ciency. Individual trabeculae were harvested from the proximal femur of 7 ovariectomised sheep (OVX), sacrifi ced 12 months post-surgery, and 5 age-matched controls. Mineral content (wt% Ca) was determined using a quantitative backscattered scanning electron microscopy imaging approach. Mineral heterogeneity within individual trabeculae was compared by calculating the full width at half maximum (FWHM) of mineral density distributions. Mean calcium content, the spatial distribution of mineral within trabeculae and the inter-trabecular variation between regions of proximal femora were also compared. Oestrogen defi ciency increased mineral heterogeneity within individual trabeculae compared to healthy controls, as measured by FWHM (3.57 ± 0.68 vs. 3.17 ± 0.36 wt% Ca, p = 0.04). I n particular mineral variability increased between superficial and deep regions of trabeculae of OVX animals (p = 0.04). Interestingly, mineralisation variability between greater and lesser trochanters (i.e. intertrochanteric fracture line) was increased in OVX compared to CON, as indicated by a greater % difference in the standard deviation of trabecular mineral content (77.11 ± 11.70 vs. 45.64 ± 23.70 %, p = 0.03). Such changes are undetectable by evaluating the mean mineral content of bone tissue, but may contribute to changes in bone mechanical strength following osteoporotic bone loss.
Keywords: Bone, mineral, heterogeneity, osteoporosis, oestrogen defi ciency, backscattered electron imaging.
*Address for correspondence: Laoise M. McNamara
Department of Mechanical and Biomedical Engineering National University of Ireland Galway
Galway, Ireland
Telephone Number: (353) 91-492251 FAX Number: (353) 91-563991 E-mail: Laoise.McNamara@nuigalway.ie
Introduction
Osteoporosis is a metabolic bone disease characterised by low bone mass, bone fragility and increased fracture risk (Cummings and Melton, 2002). The overall mechanical strength and fracture resistance of bone is determined by both the bone mass and the quality of the bone tissue (Judex et al., 2003). Bone quality encompasses many features of the bone tissue, in particular (1) tissue micro-architecture, (2) the degree of micro-damage and (3) tissue composition. It is now well established that, during oestrogen defi ciency, bone mass and trabecular micro-architecture are signifi cantly degraded by way of trabecular thinning, micro-fracture and loss of trabecular connectivity (Parfi tt, 1987; Compston et al., 1989; Lane et al., 1998). There is also evidence that the extent of micro-damage within bone tissue is increased during oestrogen defi ciency (Dai et al., 2004). It is less clear however how tissue composition is affected by oestrogen deficiency. Bone is a composite material, composed of an inorganic phase (predominantly the mineral calcium phosphate) and an organic phase (collagen, non-collagenous proteins and cells). The mechanical behaviour of bone tissue is determined by the quantity and mechanical integrity of each of these phases. In particular, the mineral concentration is a key determinant of the mechanical strength of bone (Currey, 1984; Follet et al., 2004). Previous research to discern differences in mineral concentration between oestrogen defi cient and normal bone tissue has produced many confl icting observations; some studies report a decrease (Gadeleta et al., 2000; Loveridge et al., 2004), whilst others reveal an increase (Dickenson, 1981; Boyde, 1998; McNamara, 2006), or no change in mineral concentration (Bohic et al., 2000; Rohanizadeh et al., 2000; Ciarelli et al., 2003). Variations in experimental methods or animal model may explain such discrepancies. Alternatively, the distribution of bone tissue mineral in oestrogen defi cient bone might vary depending on the structural level or the anatomical location from which bone was chosen for analysis.
Trabecular bone is a hierarchically organised structure, formed by an interconnecting network of trabeculae, which are comprised of collagen fi brils organised into parallel tissue lamellae. While most studies have assessed the mechanical integrity of volumes of trabecular bone, changes at all levels of organisation likely contribute to fracture risk. In our previous studies, we performed micro tensile testing on individual trabeculae from the tibia of an animal model of osteoporosis (ovariectomised rats) in which overall bone mass and bone strength
SITE SPECIFIC INCREASE IN HETEROGENEITY OF TRABECULAR BONE TISSUE
MINERAL DURING OESTROGEN DEFICIENCY
M.A. Brennan1, J.P.Gleeson2, M. Browne1, F.J. O’Brien2,3, P.J. Thurner1, L.M. McNamara4,*
1 Bioengineering Sciences Research Group, School of Engineering Sciences, University of Southampton, Highfi eld, Southampton, SO17 1BJ, United Kingdom
2 Department of Anatomy, Royal College of Surgeons in Ireland, 123 St. Stephens Green, Dublin 2, Ireland
3 Trinity Centre for Bioengineering, Trinity College, Dublin 2, Ireland
www.ecmjournal.org was reduced. Using these methods, we showed that the
remaining individual trabeculae were approximately 40-90 % stronger and stiffer than trabeculae from sham operated controls (McNamara et al., 2005; McNamara et al., 2006). Preliminary studies suggested that these changes in tissue properties were related to micro structural changes in tissue mineralisation (McNamara et al., 2006; McNamara et al., 2005). A recent study corroborated this by reporting increased calcium content within individual trabeculae during oestrogen defi ciency (Busse et al., 2009). Studies have shown that mineral is more heterogeneously distributed in oestrogen defi cient trabeculae (Roschger et al., 2008; Busse et al., 2009). However these studies have not yet distinguished precisely where mineralisation differences arise within trabeculae, e.g. whether tissue mineral content is altered at superfi cial surfaces, or whether such changes are ubiquitous throughout trabeculae. It is known that bone mineral is heterogeneously distributed across different anatomical regions of the healthy skeleton (Nazarian et al., 2007), due to normal variations in functional remodelling (Tsubota et al., 2009) and tissue mineralisation kinetics (Akkus et al., 2003; Ruffoni et al., 2007). Furthermore remodelling activity is variable across anatomical locations of the proximal femur (Tsubota et al., 2009). Although it has recently been shown that increased remodelling activity during oestrogen defi ciency (Bell, 1996; Caverzasio et al., 2008) is not uniform across sites of the distal femur (Baldock et al., 1998), it is not yet known whether such variations alter the normal distribution of bone tissue mineral between anatomical locations.
In this study we use quantitative backscattered electron imaging (qBEI) with scanning electron microscopy (SEM) to test the hypothesis that the distribution of bone tissue mineral is altered during osteoporosis. Specifi cally the objective of the study is to discern the difference in mean calcium content and the density distribution of calcium at a tissue level between healthy and osteoporotic sheep trabecular bone. Furthermore, we seek to quantify
whether changes are ubiquitous across all trabecular bone tissue from the proximal femur, or are limited to discrete anatomical locations within the proximal femur.
Materials and Methods
Animal groups and trabecular bone origins
The bones analysed in this study originated from an ovine osteoporosis model which has previously been described (Kennedy et al., 2008a; Kennedy et al., 2008b; Brennan et al., 2009; Kennedy et al., 2009a; Kennedy et al., 2009b). Briefl y, skeletally mature mixed breed ewes were randomly assigned into one of two groups; (1) sheep that underwent ovariectomy to induce oestrogen defi ciency (OVX, n = 7) and (2) a control group (CON, n = 5). All surgery was performed following ethical approval and under an animal licence, granted by the Irish Department of Health. Animals were maintained at pasture where feeding and activity levels were the same for both groups. Animals were sacrifi ced at 12 months post-ovariectomy and bones were harvested and frozen at -20 ºC. Five individual trabeculae were excised from three regions of the proximal femora (greater trochanter, lesser trochanter and femoral head) of animals from each of the CON and OVX cohorts, see Fig. 1a. The sample sizes are presented in Table 1.
Specimen Preparation
[image:2.595.87.505.557.722.2]I n d i v i d u a l t r a b e c u l a e w e r e e m b e d d e d i n t o polymethylmethacrylate (PMMA) blocks. A precision diamond cutting machine (Minitom, Struers, Denmark) was used to expose a cross-section through the trabecula. Samples were polished using a polishing wheel (Labopol -21, Stuers, Denmark ) fi tted with silica carbide paper and then by using diamond suspension of decreasing particle size down to 0.25 μm. The samples were then coated with a thin layer of carbon (Edwards 306 Auto Unit, Crawley, UK) to provide a conductive path for electrons for scanning electron microscopy.
Table 1. Mean weight percentage calcium in control and ovariectomised bone.
Mean weight percentage calcium (wt% Ca), full width at half maximum (FWHM) and sample sizes (n) for bone trabeculae from the Greater Trochanter (GT), Femoral Head (H) and Lesser Trochanter (LT) regions of control (CON) and ovariectomised (OVX) bone. Data is presented as mean ± standard deviation. * indicates different from CON LT (p = 0.0001). + Statistically higher than OVX LT (p = 0.0016), ++ statistically higher than OVX H (p = 0.02). ** indicates signifi cant difference in FWHM between groups.
Mean p FWHM p n
Sheep Trabeculae
GT CON 24.46 ± 1.09
*
0.65 3.17 ± 0.36 0.04 ** 5 25
OVX 24.71 ± 1.06 +, ++ 3.57 ±0.68 6 30
H CON 23.67 ± 1.26 0.88 3.60 ± 0.31 0.31 4 20
OVX 23.78 ± 1.48 3.84 ± 0.72 7 35
LT CON 23.29 ± 0.95 0.76 3.86 ± 0.61 0.34 5 25
OVX 23.40 ± 1.68 3.96 ± 0.61 5 25
Pooled data CON 23.80 ± 1.20 0.65 3.54 ± 0.53 0.10 5 70
Scanning electron microscopy and qBEI
The mineral content of individual trabeculae was measured by imaging the cross section of each trabecula using a scanning electron microscope (SEM) (JSM 5910, JEOL, Welwyn Garden City, UK), fi tted with a backscattered detector, operating at an electron acceleration voltage of 15 kV and a beam current of 1.2 nA. The magnifi cation was kept the same for all images (200x), which resulted in a pixel resolution of 0.66 μm/pixel and images comprising 1280 x 901 pixels. Quantitative backscattered electron images (qBEI) were acquired with the samples at a fi xed working distance of 12 mm, see Fig. 1b. In order to calibrate the grey level scale range, pure carbon and aluminium standards (Agar Scientifi c, Stansted, UK) were included in each scan. The standards were imaged in the qBEI mode and the contrast and brightness settings were altered until carbon measured 25 on the grey level (GL) scale and aluminum measured 225. Calibrations were checked after every image capture and were recalibrated if necessary.
Bone mineral density distribution analysis
Each qBEI image was analysed to determine the GL intensities of each pixel using a custom MATLAB script. An image histogram of pixel count versus grey level was produced (with pixels due to PMMA embedding material threshold out). Pixel count was presented as a percentage of total pixel count and therefore expressed as a percentage of total bone area (% bone area). A linear relationship between the grey levels of the backscattered image and the local calcium content was established previously (Roschger et al., 1998). This relationship was employed to calculate bone mineral content (wt% Ca) from the GL measurements (GL) according to eqn. (1):
(1)
This relationship was used to determine the bone mineral content (wt% Ca) of individual trabeculae excised from three regions of the proximal femora (greater trochanter, lesser trochanter and femoral head) of animals from each cohort.
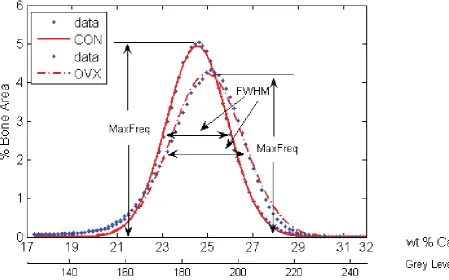
A frequency distribution of the calcium content of single trabeculae, known as the bone mineral density distribution (BMDD), was used to compare the distribution of bone tissue mineral between normal and osteoporotic bone similar to previous methods (Busse et al., 2009; Roschger et al., 1998). Histograms of wt% Ca were derived from the high-resolution qBEI images (0.66 μm), which produced histograms with a resolution of 0.17 wt% Ca. A Gaussian curve-fi t was superimposed on the BMDD histograms. The mean calcium content ofeach trabecula, μCa, was calculated according to eqn. (2):
(2)
The heterogeneity of calcium within each trabecula was quantifi ed by calculating the full width at half maximum (FWHM) from the BMDD histogram. The FWHM is the distance between points on the Gaussian curve at which the function reaches half its maximum value (Fig. 2). To assess inter-trabecular variation the standard deviation, σ, and coeffi cient of variation (cυ = σ/μCa) for three anatomical regions (greater trochanter, lesser trochanter, femoral head) of every sheep was computed. In order to evaluate inter-group comparisons, the percentage differences of μCa, σ and cυ between anatomical regions were calculated.
[image:3.595.77.531.57.277.2]www.ecmjournal.org mineralisation differences arise within trabeculae. To
attain spatial information on mineral distribution within trabeculae we quantifi ed calcium content at specifi c regions of interest (ROI) through the cross section of trabeculae. Each qBEI was analysed using a custom MATLAB script, which allowed the operator manually to select the surface of a trabecula and then automatically analyse mineral content in the superfi cial region, the intermediate region and the deep region within each trabecula, see Fig. 1b. The distinction and differentiation of superfi cial, intermediate and deep regions through the cross section of rod-like and plate-like trabeculae can be subjective. Therefore, regions of interest (ROI) were generated automatically to avoid operator bias. Two opposite ROI on the surface of a trabecula (superfi cial region), two intermediate ROI (midway between the trabecular surface and centre) and one core (deep) ROI were defi ned automatically at equidistant locations (Fig. 1b). These ROI were of the same size (38 x 38 pixels) and were defi ned proportional to the diameter of each cross section, see Fig. 1b, to allow comparison of trabeculae with one another regardless of thickness or shape and also remove any bias that might be introduced in a manual method. This method generated
fi ve ROIs through the cross section of trabeculae and this was performed four times per trabecula to generate eight superfi cial, eight intermediate, and four deep ROIs in total per trabecula. Histograms of GL were plotted for each ROI and data was thresholded to remove GL data from PMMA embedding material and the pixel count (frequency) was weighted accordingly. The mean wt% Ca for each level (superficial, intermediate, and deep) was calculated. The percentage difference of wt% Ca between the deep
and superfi cial regions of trabeculae was computed and compared between CON and OVX groups to assess the infl uence of oestrogen defi ciency on the spatial distribution of calcium within single trabeculae.
Statistical analysis
[image:4.595.74.524.57.337.2]General linear model (GLM) ANOVAs were applied to statistically analyse wt% Ca parameters between groups. A p value of ≤0.05 was considered statistically signifi cant. We compared the mean calcium content (μCa)of normal and OVX bone within regions and also compared the pooled mean calcium content between CON and OVX (i.e. combined data from all anatomical regions). Next, mineral heterogeneity (FWHM) within trabeculae was compared between normal and OVX bone tissue. The spatial distribution of mineral within trabeculae (% difference between superfi cial and deep regions) was compared between normal and OVX bone tissue. Sheep were defi ned as random factors nested within either CON or OVX groups while femora regions and trabecular regions were fi xed factors, trabeculae were nested within the sheep from which they arose. Therefore, sample size for the purpose of comparing OVX and CON statistically refers to sheep numbers. Tukey’s method for pair wise comparisons, with a family error rate of 0.05, was employed to determine statistical differences between distinct anatomical locations within femora and between trabecular regions. Finally, paired t-tests were employed to compare CON and OVX sheep by assessing the % difference of the standard deviation (σ) and coeffi cient of variation (cυ) of mineralisation between regions.
Results
The results of this study are presented in detail below. Each section addresses a specifi c question related to the global hypothesis, which is “The distribution of bone tissue mineral is altered during osteoporosis”.
Does oestrogen defi ciency alter the mean calcium content of bone tissue?
Pooled mean calcium content data from all trabeculae in all three regions of the proximal femur revealed no signifi cant difference in μCa between CON and OVX groups. Similarly, no difference in μCa was found between these two groups within any of the specifi c femoral regions, i.e. lesser trochanter, femoral head and greater trochanter. These data are presented in Table 1.
Does oestrogen defi ciency alter the mineral heterogeneity of individual trabeculae?
BMDD analysis revealed signifi cantly higher FWHM, a measure of heterogeneity, within trabeculae from the greater trochanter of the OVX group compared to CON (3.57 ± 0.68 vs. 3.17 ± 0.36, p = 0.04), see Fig. 2. However, we found that this increase in heterogeneity was site specifi c as no signifi cant differences were observed in the FWHM from trabeculae of the head and lesser trochanter regions. These data are presented in Table 1.
Does oestrogen defi ciency alter the spatial distribution of mineral within trabeculae?
For both CON and OVX groups, the highest mineral content was in the core of trabeculae with a lower calcium content measured in the outermost surface (superfi cial region), see Fig. 3. For bone tissue from the lesser trochanter of CON animals, calcium content was signifi cantly higher in the deep region of trabeculae compared to the superfi cial region (p=0.01). Similar trends were observed for bone tissue from the greater trochanter, although not signifi cant (p = 0.07), whereas no difference was found in the femoral head (p = 0.16). In the OVX group calcium content was signifi cantly higher in the deep region compared to superfi cial for all three regions; the greater trochanter (p < 0.01), head (p < 0.01) and lesser trochanter (p <
0.01). In CON tissue, no signifi cant difference in calcium content between intermediate and superfi cial regions was found, but in OVX animals calcium content was higher in intermediate compared to superfi cial region in both the greater trochanter (p = 0.06) and the head region (p = 0.02). These data are presented in Table 2.
[image:5.595.309.526.59.301.2]The % difference of calcium content between the deep and superfi cial regions was statistically higher in the OVX group compared to CON in the proximal femur when data from all regions were pooled (p = 0.04), and when regions were analysed separately these differences were detected in the head region (p = 0.05), but not in the greater or lesser trochanters, see Fig. 4.
Fig. 3. Intra-trabecular spatial distribution of calcium between superfi cial, intermediate, and deep regions, in the greater trochanter (GT), head (H) and lesser trochanter (LT) regions of proximal femora. * indicates statistical signifi cance between trabecular regions indicated the by brackets (p ≤ 0.02).
S I D
P a i r w i s e c o m p a r i s o n (S and D)
P a i r w i s e c o m p a r i s o n (S and I)
GT CON 24.56 ± 1.70 24.70 ± 1.65 25.16 ± 1.68 0.07 0.86
OVX 24.45 ± 1.47 24.94 ± 0.96 25.35 ± 1.04 < 0.01* 0.06
H CON 23.50 ± 1.36 23.81 ± 1.32 24.18 ± 1.35 0.16 0.67
OVX 23.31 ± 1.64 24.05 ± 1.60 24.51 ± 1.50 <0.01* <0.02*
LT CON 22.67 ± 1.36 23.25 ± 1.04 23.47 ±0.99 0.01* 0.09
OVX 22.52±2.17 23.32±1.77 23.86 ± 1.75 <0.01* 0.13 Table 2. Spatial distribution of mineral.
[image:5.595.78.508.599.738.2]www.ecmjournal.org Does oestrogen defi ciency alter the mineral
distribution across anatomical locations?
Signifi cant differences in μCa were found across anatomical regions of the femur in both CON and OVX groups. In the CON group μCa was signifi cantly higher in bone tissue from the greater trochanter compared to the lesser trochanter (p < 0.01). In OVX sheep μCa in the greater trochanter region was signifi cantly higher than that of the lesser trochanter (p < 0.01) and head (p = 0.02), see Fig. 5.
Inter-trabecular variation
The standard deviation (σ) of mineralisation between trabeculae of the lesser trochanter was signifi cantly higher than those of the greater trochanter in the OVX group (1.36 ± 1.13 vs. 0.36 ± 0.29, p = 0.05). Similarly the coeffi cient of variation (cυ) was higher in the lesser trochanter than the greater trochanter (0.06 ± 0.05 vs. 0.01 ± 0.01, p = 0.05). No signifi cant difference existed between the two regions in the CON group.
Inter-group variation
[image:6.595.67.290.62.274.2]The % difference in mean mineral content (μCa) between anatomical regions (i.e. greater and lesser trochanter) was not signifi cantly different when comparing CON and OVX groups (p=0.42), see Fig. 6. The % difference in the standard deviation (σ) of trabecular mean mineral content between the greater and lesser trochanters was statistically higher for OVX compared to CON (77.11 ± 11.70 vs. 45.64 ± 23.70, p = 0.03), see Fig. 6. The % difference in coeffi cient of variation (cυ) between the greater and lesser trochanters was also statistically higher for OVX compared to CON (77.77 ± 11.16 vs. 48.16 ± 24.80, p = 0.04).
Fig. 4. Comparisons between CON and OVX groups for the % difference between superfi cial and deep regions of trabeculae in the greater trochanter (GT), lesser tro-chanter (LT) and head (H) regions of proximal femora. The increased % difference by the OVX group was signifi cant in the head region (p = 0.05). * indicates
statistical signifi cance between groups. Fig. 5. Comparison of mean calcium content (wt % Ca) between anatomical regions within the proximal femur. * and ** signify statistical difference between femoral regions indicated by the brackets, (p < 0.01, and p ≤
0.02) respectively.
[image:6.595.311.527.67.335.2] [image:6.595.308.525.446.654.2]Discussion
This study provides direct evidence that oestrogen defi ciency alters the distribution of bone tissue mineral compared to healthy controls, both on the trabecular level and across anatomical locations. Although bone tissue mineral distribution is heterogeneous in healthy bone, the current study reveals that this heterogeneity is signifi cantly more pronounced in oestrogen defi cient animals. Increases in heterogeneity within trabeculae were site specific, occurring in the greater trochanter whereas the % difference in mineral content between superfi cial and deep region was signifi cantly increased in the femoral head. Finally, regional differences in the variability (σ, cυ) of mineral content between the greater and lesser trochanters were signifi cantly more pronounced during oestrogen defi ciency. It should be noted that there were some limitations associated with this study. Firstly, fi ve trabeculae from each of the three skeletal sites of each sheep were used for analysis and selection may have been biased towards larger trabeculae due to limited availability and the diffi culties associated with excising them for analysis. Furthermore, as the preparation method is destructive it was not possible to track changes in specifi c trabecular regions over the course of time. Therefore, the intermediate region of trabeculae from OVX bone might not correspond to the intermediate region that existed prior to increased surface remodelling characteristic of oestrogen deficiency. However, our analysis method enabled selection of equidistant regions relative to the diameter of each trabecula, rather than setting a predefi ned distance for intermediate and deep regions, ensuring that the chosen region was indeed the intermediate layer of the newly remodelled OVX trabeculae. Secondly, although the ovariectomised sheep is an established model of postmenopausal osteoporosis (Turner et al., 1995a; Turner et al., 1995b) ewes, unlike humans, have twenty oestrous cycles and healthy sheep experience a short period (1-2 months) of oestrogen defi ciency annually (Newton et al., 2004). Nonetheless, the calcium content values we measured in sheep bone tissue (22-26%) are comparable with ranges reported from control (18-28%) and osteoporotic human bone tissue (16-26%) (Roschger et al., 1998; Roschger et al., 2001; Gupta et al., 2005). We expect that differences in tissue heterogeneity would be more pronounced with larger sample sizes and in human osteoporotic bone compared to healthy subjects that do not experience an oestrogen defi cient period. Finally, there are important limitations associated with the method to calculate wt% Ca from grey level intensities acquired from qBEI images that should be noted. Although carbon and aluminium have been employed extensively as calibration standards for qBEI on bone samples (Roschger et al., 1998; Grabner et al., 2001; Misof et al., 2003; Sutton-Smith et al., 2008) channelling contrast can occur due to their crystalline nature. We used two approaches to reduce this effect; (i) the angle of electron beam incidence was kept constant throughout all experiments and (ii) mechanically polished carbon and aluminium standards were used to reduce contrast channelling effect (Finch, 1936; Reimer, 1998). The method to calculate wt% Ca from grey level intensities was developed by calibrating
backscattered images using quantitative energy dispersive x-ray (EDX) analysis (Roschger et al., 1998). Although this method has been employed extensively to relate grey levels to calcium content of bone tissue (Vajda, 1996; Misof et al., 2003; Gupta et al., 2005; Sutton-Smith et al., 2008; Busse et al., 2009; Seitz et al., 2010), Monte Carlo simulations of electron trajectories have shown that the 3D x-ray production volume for calcium greatly exceeds the excitation volume of backscattered electrons (Howell and Boyde, 2003). Furthermore, there is evidence that EDX-standardised BSE images tend to give a lower mineral content value of bone than when measured with traditional ash measurements (Vajda et al., 1998). However, an identical approach was used to compare both CON and OVX groups and, as such, these limitations are expected to infl uence each group equally. Therefore, the relative differences observed between groups are believed to be an accurate representation of tissue level changes as a result of oestrogen defi ciency. Alternative analysis techniques such as synchrotron μCT could be used in future to assess mineral distribution ex vivo within bone tissue in 3D, overcoming the challenges of sample size and tissue preparation (Nuzzo et al., 2002).
It is interesting that no differences were detected from the pooled mean mineralisation data of all trabeculae from all regions of normal and OVX tissue. This is consistent with previous studies, which found no difference in the mineral content of osteoporotic bone compared to control (Bohic et al., 2000; Rohanizadeh et al., 2000; Ciarelli et al., 2003; Loveridge et al., 2004). Increased mineral heterogeneity within trabeculae during oestrogen defi ciency is in agreement with other studies (Roschger et al., 2001; Busse et al., 2009). Our results reveal, for the fi rst time, that changes in mineral heterogeneity in the femur during oestrogen defi ciency are dependent on anatomical location. In addition, this study shows that oestrogen deficiency results in a higher variability of mineral distribution between regions of the proximal femora and also causes specifi c alterations in the spatial distribution of mineral between trabecular regions. These fi ndings corresponded to no changes in the mean calcium content of trabeculae, or the % difference of mean calcium content between anatomical locations during oestrogen defi ciency – highlighting that such important effects of oestrogen defi ciency on mineral distribution may be undetectable by studies focusing solely on mean mineral content of bone tissue during oestrogen defi ciency (Bohic et al. 2000; Boyde et al. 1998; Ciarelli et al. 2003; Dickenson et al. 1981; Gadeleta et al. 2000; McNamara et al. 2006; Rohanizadeh et al. 2000).
www.ecmjournal.org This might be attributed to increased surface remodelling
characteristic of osteoporosis (i.e., higher turnover rates) which results in the formation of new superfi cial tissue (Parfi tt et al., 1983). As such increased heterogeneity may be a transient characteristic, and the normal heterogeneity might be restored by complete mineralisation of new bone over time. In addition, direct modulation of osteocyte secondary mineralisation might occur through its oestrogen receptor (Batra et al., 2003) when levels of circulating oestrogen are defi cient. It is known that osteocyte apoptosis is upregulated during oestrogen withdrawal (Kousteni et al., 2001; Tomkinson et al., 1997) and as such infi lling of the remaining cavities, known as micropetrosis (Frost, 1960; Kingsmill and Boyde, 1998; Boyde, 2003), might occur. Further studies are required however to delineate if these mechanisms contribute to the differences observed in the current study.
The site specific nature of increased mineral heterogeneity may occur as a result of local changes in bone remodelling activity or mechanical loading during oestrogen deficiency. While previous studies on the same sheep cohort have reported variations in trabecular microarchitecture between anatomical regions of the vertebrae of healthy sheep (Kennedy et al., 2009c), site-specifi c changes in bone remodelling activity or tissue microarchitecture of OVX sheep were not identified (Kennedy, 2007). However, a previous study has demonstrated site specifi c variations in bone loss and remodelling activity in ovariectomised rats; while bone loss was signifi cant in the diaphysis and metaphysis the epiphysis appeared to be immune to bone loss and the time course of remodelling activity varied considerably between regions (Baldock et al., 1998). One other study reported that oestrogen defi ciency amplifi es the variability of mineralisation in alveolar bone of the jaw, and that this is likely due to alterations in active bone remodelling in response to forces generated during mastication (Ames et al., 2010). These observations suggest that the alterations in mineral heterogeneity observed in the current study may occur as a result of changes in local factors such as cellular activity and mechanical loading during oestrogen defi ciency. These fi ndings also highlight the fact that it is imperative to assess bone tissue from different regions when evaluating the effects of oestrogen defi ciency on trabecular bone.
It is well established that low bone mass and micro-architectural deterioration occur during oestrogen defi ciency and are primarily responsible for the reduced bone strength and increased fracture risk, characteristic of osteoporosis. As bone mineral content is a determinant of bone strength (Currey, 1984; Ruffoni et al., 2007), alterations in tissue mineral distribution within trabeculae and across anatomical locations might also be indicative of reduced mechanical integrity. Indeed previous computational studies have predicted that increased heterogeneity within trabeculae results in signifi cantly increased stiffness (Van der Linden et al., 2001) and adaptive modelling will likely occur leading to trabecular thinning, bone loss and trabecular perforation (Mulvihill et al., 2008; Van der Linden et al., 2004). Increased heterogeneity between skeletal sites may indicate zones
of the bone that are more affected by oestrogen defi ciency and therefore represent weak points. In fact, computational studies have predicted that regions of bone that have more heterogeneous material properties are at an increased risk of fracture (Jaasma et al., 2002; Hernandez, 2008; Renders et al., 2008). It is most interesting that signifi cant alterations in tissue mineral distribution occurred between the greater trochanter and lesser trochanter (% difference σ and cυ), which is coincident with the most common osteoporotic fracture site known as the inter-trochanteric fracture line. Taken together with our results it is proposed that alterations in tissue mineral distribution may be a contributing factor for weakened bone at increased risk of fracture at this site during osteoporosis.
Conclusion
This study provides evidence that the distribution of tissue-level mineral is altered during osteoporosis which may alter tissue-level mechanics. In particular, our fi ndings suggest that these changes are anatomically distinct and do not occur ubiquitously throughout the proximal femur. These
fi ndings highlight the fact that methods evaluating the mean mineral content of bone tissue are insuffi cient to detect oestrogen’s impact on tissue mineral distribution and also indicate that local factors might have a signifi cant impact on bone tissue during oestrogen depletion. Furthermore, in addition to the well established changes in bone mass and architecture during oestrogen defi ciency, alterations in tissue mineral distribution in ovariectomised animals may be a contributing factor for reduced mechanical strength. Heterogeneous regions may be indicative of weakened zones at both the trabecular and anatomical levels that contribute to a reduction in mechanical strength and render osteoporotic bones more susceptible to fracture. Therefore, these fi ndings are of potential importance in understanding the underlying mechanisms of altered mechanics during osteoporosis.
Acknowledgements
Funding for this study was granted by the Health Research Board under Grant number RP/2007/179. The authors would like to acknowledge Professor John Hinde of the National University of Ireland, Galway for statistical assistance.
References
Akkus O, Polyakova-Akkus A, Adar F, Schaffl er M (2003) Aging of microstructural compartments in human compact bone. J Bone Miner Res 18: 1012-1019.
Ames M, Hong S, Lee H, Fields H, Johnston W, Kim D (2010) Estrogen defi ciency increases variability of tissue mineral density of alveolar bone surrounding teeth. Arch Oral Biol 55: 599-605.
in bone cell activity in three regions of the distal femur immediately following ovariectomy. J Bone Mineral Res 13: 1451-1457.
Batra GS, Hainey L, Freemont AJ, Andrew G, Saunders PT, Hoyland JA, Braidman IP (2003) Evidence for cell-specifi c changes with age in expression of oestrogen receptor (Er) alpha and beta in bone fractures from men and women. J Pathol 200: 65-73.
Bell K, Loveridge, N, Lunt, M, Lindsay, PC, Reeve, J (1996) Oestrogen suppression increases haversian resorption depth as well as remodelling activity in women with endometriosis. Bone 19: 131S
Bohic S, Rey C, Legrand A, Sfi hi H, Rohanizadeh R, Martel C, Barbier A, Daculsi G (2000) Characterization of the trabecular rat bone mineral: Effect of ovariectomy and bisphosphonate treatment. Bone 26: 341-348.
Boyde A (2003) The real response of bone to exercise. J Anat 203: 173-189.
Boyde A, Compston JE, Reeve J, Bell KL, Noble BS, Jones SJ, Loveridge N (1998) Effect of estrogen suppression on the mineralization density of iliac crest biopsies in young women as assessed by backscattered electron imaging. Bone 22: 241-250.
Brennan O, Kennedy OD, Lee TC, Rackard SM, O’Brien FJ (2009) Biomechanical properties across trabeculae from the proximal femur of normal and ovariectomised sheep. J Biomechanics 42: 498-503. Busse B, Hahn M, Soltau M, Zustin J, Püschel K, Duda GN, Amling M (2009) Increased calcium content and inhomogeneity of mineralization render bone toughness in osteoporosis: mineralization, morphology and biomechanics of human single trabeculae. Bone 45: 1034-1043.
Caverzasio J, Higgins L, Ammann P (2008) Prevention of trabecular bone loss induced by estrogen defi ciency by a selective P38α inhibitor. J Bone Mineral Res 23: 1389-1397.
Ciarelli TE, Fyhrie DP, Parfi tt AM (2003) Effects of vertebral bone fragility and bone formation rate on the mineralization levels of cancellous bone from white females. Bone 32: 311-315.
Compston JE, Mellish RW, Croucher P, Newcombe R, Garrahan NJ (1989) Structural mechanisms of trabecular bone loss in man. Bone Miner 6: 339-350.
Cummings SR, Melton LJ (2002) Epidemiology and outcomes of osteoporotic fractures. Lancet 359: 1761-1767.
Currey JD (1984) Effects of differences in mineralization on the mechanical properties of bone. Philos Trans R Soc Lond B Biol Sci 304: 509-518.
Dai RC, Liao EY, Yang C, Wu XP, Jiang Y (2004) Microcracks: An alternative index for evaluating bone biomechanical quality. J Bone Miner Metab 22: 215-223. Dickenson RP, Hutton WC, Stott JR (1981) The mechanical properties of bone in osteoporosis. J Bone Joint Surg Br 63-B: 233-238.
Finch I (1936) The Beilby layer on non-metals. Nature 138: 1010.
Follet H, Boivin G, Rumelhart C, Meunier PJ (2004) The degree of mineralization is a determinant of bone strength: a study on human calcanei. Bone 34: 783-789.
Frost HM (1960) Micropetrosis. J Bone Joint Surg Am 42-A: 144-150.
Gadeleta SJ, Boskey AL, Paschalis E, Carlson C, Menschik F, Baldini T, Peterson M, Rimnac CM (2000) A physical, chemical, and mechanical study of lumbar vertebrae from normal, ovariectomized, and nandrolone decanoate-treated cynomolgus monkeys (Macaca fascicularis). Bone 27: 541-550.
Grabner B, Landis WJ, Roschger P, Rinnerthaler S, Peterlik H, Klaushofer K, Fratzl P (2001) Age- and genotype-dependence of bone material properties in the osteogenesis imperfecta murine model (Oim). Bone 29: 453-457.
Grynpas M (1993) Age and disease-related changes in the mineral of bone. Calcifi ed Tissue Int 53 Suppl 1: S57-64.
Gupta H, Schratter S, Tesch W, Roschger P, Berzlnovich A, Schoeberl T, Klaushofer K, Fratzl P (2005) Two different correlations between nanoindentation modulus and mineral content in bone-cartilage interface. J Struct Biol 149: 138-148.
Hernandez C (2008) How can bone turnover modify bone strength independent of bone mass? Bone 42: 1014-1020.
Howell PG, Boyde A (2003) Volumes from which calcium and phosphorus X-rays arise in electron probe emission microanalysis of bone: Monte Carlo simulation. Calcif Tissue Int 72: 745-749.
Jaasma M, Bayraktar H, Niebur G, Keaveny T (2002) Biomechanical effects of intraspecimen variations in tissue modulus for trabecular bone. J Biomech 35: 237-246.
Judex S, Boyd S, Qin YX, Miller L, Muller R, Rubin C (2003) Combining high-resolution micro-computed tomography with material composition to defi ne the quality of bone tissue. Curr Osteoporos Rep 1: 11-19.
Kennedy OD (2007) The effect of bone turnover on bone quality and material properties. Ph.D. Thesis, Trinity College, Dublin.
Kennedy O, Brennan O, Mauer P, Rackard S, O’Brien F, Taylor D, Lee T (2008a) The effects of increased intracortical remodelling on microcrack behaviour in compact bone. Bone 43: 889-893.
Kennedy OD, Brennan O, Mahony NJ, Rackard SM, O’Brien FJ, Taylor D, Lee CT (2008b) Effects of high bone turnover on the biomechanical properties of the L3 vertebra in an ovine model of early stage osteoporosis. Spine 33: 2518-2523.
Kennedy O, Brennan O, Rackard S, O’Brien F, Taylor D, Lee T (2009a) Variation of trabecular microarchitectural parameters in cranial, caudal and mid-vertebral regions of the ovine L3 vertebra. J Anat 214: 729-735.
Kennedy O, Brennan O, Rackard S, Staines A, O’Brien F, Taylor D, Lee T (2009b) Effects of ovariectomy on bone turnover, porosity, and biomechanical properties in ovine compact bone 12 months postsurgery. J Orthop Res 27: 303-309.
www.ecmjournal.org Kingsmill VJ, Boyde A (1998) Mineralisation density
of human mandibular bone: Quantitative backscattered electron image analysis. J Anat 192: 245-256.
Kousteni S, Bellido T, Plotkin LI, O’Brien CA, Bodenner DL, Han L, Han K, DiGregorio GB, Katzenellenbogen JA, Katzenellenbogen BS, Roberson PK, Weinstein RS, Jilka RL, Manolagas SC (2001) Nongenotropic, sex-nonspecifi c signaling through the estrogen or androgen receptors: Dissociation from transcriptional activity. Cell 104: 719-730.
Lane NE, Thompson JM, Haupt D, Kimmel DB, Modin G, Kinney JH (1998) Acute changes in trabecular bone connectivity and osteoclast activity in the ovariectomized rat in vivo. J Bone Miner Res 13: 229-236.
Loveridge N, Power J, Reeve J, Boyde A (2004) Bone mineralization density and femoral neck fragility. Bone 35: 929-941.
McNamara LM, Ederveen AG, Lyons CG, Price C, Schaffler MB, Weinans H, Prendergast PJ (2006) Strength of cancellous bone trabecular tissue from normal, ovariectomized and drug-treated rats over the course of ageing. Bone 39: 392-400.
McNamara LM, Prendergast PJ, Schaffler MB (2005) Bone tissue material properties are altered during osteoporosis. J Musculoskelet Neuronal Interact 5: 342-343.
Misof BM, Roschger P, Cosman F, Kurland ES, Tesch W, Messmer P, Dempster DW, Nieves J, Shane E, Fratzl P, Klaushofer K, Bilezikian J, Lindsay R (2003) Effects of intermittent parathyroid hormone administration on bone mineralization density in iliac crest biopsies from patients with osteoporosis: A paired study before and after treatment. J Clin Endocrinol Metab 88: 1150-1156.
Mulvihill BM, McNamara LM, Prendergast PJ (2008) Loss of trabeculae by mechano-bological means may explain rapid bone loss in osteoporosis. J R Soc Interface 5: 1243-1253.
Nazarian A, Muller J, Zurakowski D, Müller R, Snyder BD (2007) Densitometric, morphometric and mechanical distributions in the human proximal femur. J Biomech 40: 2573-2579.
Newton BI, Cooper RC, Gilbert JA, Johnson RB, Zardiackas LD (2004) The ovariectomized sheep as a model for human bone loss. J Comp Pathol 130: 323-326.
Nuzzo S, Lafage-Proust MH, Martin-Badosa E, Boivin G, Thomas T, Alexandre C, Peyrin F (2002) Synchrotron radiation microtomography allows the analysis of three-dimensional microarchitecture and degree of mineralization of human iliac crest biopsy specimens: Effects of etidronate treatment. J Bone Mineral Res 17: 1372-1382.
Parfi tt AM (1987) Trabecular bone architecture in the pathogenesis and prevention of fracture. Am J Med 82: 68-72.
Parfi tt AM, Mathews CH, Villanueva AR, Kleerekoper M, Frame B, Rao DS (1983) Relationships between surface, volume, and thickness of iliac trabecular bone in aging and in osteoporosis. Implications for the microanatomic and cellular mechanisms of bone loss. J Clin Invest 72: 1396-1409.
Reimer L (1998) Scanning electron microscopy: Physics of image formation and microanalysis. Springer, New York.
Renders G, Mulder L, Langenbach G, van Ruijven L, van Eijden T (2008) Biomechanical effect of mineral heterogeneity in trabecular bone. J Biomech 41: 2793-2798.
Rohanizadeh R, LeGeros RZ, Bohic S, Pilet P, Barbier A, Daculsi G (2000) Ultrastructural properties of bone mineral of control and tiludronate-treated osteoporotic rat. Calcif Tissue Int 67: 330-336.
Roschger P, Fratzl P, Eschberger J, Klaushofer K (1998) Validation of quantitative backscattered electron imaging for the measurement of mineral density distribution in human bone biopsies – Backscattered electron image grey-levels correlated to calcium Kα-line intensities. Bone 23: 319-326.
Roschger P, Rinnerthaler S, Yates J, Rodan GA, Fratzl P, Klaushofer K (2001) Alendronate increases degree and uniformity of mineralization in cancellous bone and decreases the porosity in cortical bone of osteoporotic women. Bone 29: 185-191.
Roschger P, Paschalis EP, Fratzl P, Klaushofer K (2008) Bone mineralization density distribution in health and disease. Bone 42: 456-466.
Ruffoni D, Fratzl P, Roschger P, Klaushofer K, Weinkamer R (2007) The bone mineralization density distribution as a fi ngerprint of the mineralization process. Bone 40: 1308-1319.
Seitz S, Schnabel C, Busse B, Schmidt H, Beil F, Friedrich R, Schinke T, Mautner V, Amling M (2010) High bone turnover and accumulation of osteoid in patients with neurofi bromatosis 1. Osteoporosis Int 21: 119-127. Sutton-Smith P, Beard H, Fazzalari N (2008) Quantitative backscattered electron imaging of bone in proximal femur fragility fracture and medical illness. J Microsc 229: 60-66.
Tomkinson A, Reeve J, Shaw RW, Noble BS (1997) The death of osteocytes via apoptosis accompanies estrogen withdrawal in human bone. J Clin Endocrinol Metab 82: 3128-3135.
Tsubota K, Suzuki Y, Yamada T, Hojo M, Makinouchi A, Adachi T (2009) Computer simulation of trabecular remodeling in human proximal femur using large-scale voxel Fe models: Approach to understanding Wolff’s law. J Biomech 42: 1088-1094.
Turner AS, Alvis M, Myers W, Stevens ML, Lundy MW (1995a) Changes in bone mineral density and bone-specifi c alkaline phosphatase in ovariectomized ewes. Bone 17: 395S-402S.
Turner AS, Mallinckrodt CH, Alvis MR, Bryant HU (1995b) Dose-response effects of estradiol implants on bone mineral density in ovariectomized ewes. Bone 17: 421S-427S.
Vajda EG, Skedros JG, Bloebaum RD (1998) Errors in quantitative backscattered electron analysis of bone standardized by energy-dispersive X-ray spectrometry. Scanning 20: 527-535.
Van der Linden J, Birkenhäger-Frenkel D, Verhaar J, Weinans H (2001) Trabecular bone’s mechanical properties are affected by its non-uniform mineral distribution. J Biomech 34: 1573-1580.
Van der Linden JC, Day JS, Verhaar JA, Weinans H (2004) Altered tissue properties induce changes in cancellous bone architecture in aging and diseases. J Biomech 37: 367-374.
Discussion with Reviewers
Revie wer I: Heterogeneity was measured as the width of the grey level/ done density histogram. This measure is similar to the standard deviation of the distribution. Differences in the spread of a data set are usually measures using the f-test of the variances. The manuscript uses t-test to compare standard deviations and the coeffi cient of variation.
Authors: We agree that differences in the spread of data sets are often measured using the f-test of the variances. The standard deviation is also often used to express the spread of a data set as it is the square root of the variance. If we were simply comparing the difference in the spread of two data sets of independent samples we would have indeed employed the f-test for variance. However since trabeculae are nested within sheep and we wished to compare inter-trabeculae variability in mineralisation within sheep between regions of the proximal femur we attained the standard deviation of 5 trabeculae from the greater trochanter of each sheep and compared these with the standard deviations from the lesser trochanter of each sheep using a t-test. Alternatively we could have employed a Bartlett or Levene test for equal variance which allows for nested designs with more than one level to assess for differences in mineral variability between groups. Reviewer III: In the discussion you state that ‘the method employed by Roschger et al. had been validated (Vajda, 1996, text reference) and employed extensively to relate grey levels to calcium content of bone tissue (Misof et al., 2003; Gupta et al., 2005; Sutton-Smith et al., 2008; Busse et al., 2009; Seitz et al., 2010, text references). We do not agree that this method has been validated or is valid. It is not made so because several people have used it. The objection that ‘Monte Carlo simulations of electron trajectories have shown that 3D x-ray production volume for calcium greatly exceeds the excitation volume
of backscattered electrons’ stands on solid rock, however much you and others care to ignore it.
Authors: We do not wish to ignore the limitations associated with the methods of Roschger et al., that is why in outlining the limitations of our methods we stated that ‘Monte Carlo simulations of electron trajectories have shown that 3D x-ray production volume for calcium greatly exceeds the excitation volume of backscattered electrons’. We accept this as a limitation. There are errors associated with EDX-standardised BSE images in that they tend to give a lower mineral content value of bone than when measured with traditional ash measurements (Vajda et al., 1998, text reference). However, since this error remains constant, it should affect all groups we compared equally; therefore we can still make direct comparisons between our groups.
Reviewer III: Carbon and aluminium are both unsatisfactory as standards for qBEI, since both are crystalline and show channelling contrast which can exceed the atomic number contrast and at least substantially broaden the emission peak expected for a pure element.
Authors: Aluminium and carbon have been accepted as calibration standards for qBEI on bone samples in several previous studies (Roschger et al., 1998; Grabner et al., 2001; Misof et al., 2003; Sutton-Smith et al., 2008, text references). Furthermore, aluminium has been employed alone as a calibration standard for qBEI of bone and has demonstrated consistent reliable results over multiple imaging sessions (Boyce et al., 1990; Vajda et al., 1995; Bloebaum et al., 1997, text references). While we acknowledge that bulk carbon and aluminium can be problematic when used as standards for qBEI, the types of carbon and aluminium standards used in this study were chosen to reduce the effect of channelling contrast. Most channelling contrast effects occur close to target surfaces (i.e., < 50 nm) (Lloyd, 1987). To reduce the effects of electron channelling in these crystalline calibration standards, we used two approaches; (i) the angle of electron beam incidence was kept constant throughout all experiments and (ii) mechanically polished carbon and aluminium standards were used. The contrast channelling effect can be significantly reduced by mechanically polishing a surface (Finch, 1936; Reimer, 1998, text references), resulting in a “Beilby layer”.
Additional Reference