Journal of Chemical and Pharmaceutical Research, 2012, 4(1):254-259
Research Article
CODEN(USA) : JCPRC5
ISSN : 0975-7384
Determination of Emtricitabine in Human urine by LC-MS/MS and its
application for patient adherence
Halde Supriya*
1, 2, Mungantiwar Ashish
1and Chintamaneni Meena
21
Macleods Pharmaceuticals Ltd., G-2, Mahakali Caves Road, Shanti Nagar, Andheri West,
Mumbai
2
School of Pharmacy & Technology Management, Narsee Monjee Institute of Management &
Higher Studies University, Vile Parle (West), Mumbai
______________________________________________________________________________
ABSTRACT
A selective, sensitive, rugged and high throughput high performance liquid chromatography tandem mass spectrometric method was developed for the estimation of Emtricitabine in human urine using Abacavir as an internal standard (IS). Emtricitabine and abacavir were extracted from urine by solid phase extraction using Water Oasis HLB cartridges. The samples were chromatographed on Hypurity Advance, 50 x 2.1, 5µ column using a mobile phase consisting 5mM ammonium acetate: Acetonitrile: Methanol: (30:30:40 v/v). The chromatographic separation is achieved in 2.6 min. The method was validated over a concentration range of 0.50 µg/mL to 80.00 µg/mL. Method was validated for its sensitivity, selectivity, accuracy and precision, matrix effect, recovery and various stabilities. The validated method was used for analysis of urine samples. As per literature approximately 86% of emtricitabine is recovered in the urine unchanged hence urine analysis can serve as a useful tool to monitor patient adherence in HIV treatment.
Keywords: LC-MS/MS; Emtricitabine; Solid Phase extraction; Human urine.
__________________________________________________________________________________________
INTRODUCTION
EXPERIMENTAL SECTION
Apparatus and Chromatographic conditions:
The system used was Shimadzu LC-VP HPLC System consisting of LC-10AD Prominence pump, SIL-HTc autosampler, CTO 10ASvp column oven and DGU-14A degasser was used to setting the reverse-phase LC conditions. The separation of analyte and internal standard was performed on Hypurity Advance, 50 x 2.1, 5µ column at 30°C. The mobile phase consisted 5 mM ammonium acetate: Acetonitrile: Methanol (30:30:40 v/v). Flow rate of mobile phase was kept at 1 mL/min. The total chromatographic run time was 2.6 minutes. Ionization and detection of analyte and internal standard was carried out on triple quadrupole mass spectrometer, MDS SCIEX API 3200 (Toronto Canada) equipped with ESI operating in positive ion mode. Quantitation was performed using MRM mode to monitor protonated precursor → product ion (m/z) transitions for emtricitabine 248.05→130.01and for Abacavir 287.20→191.20.. Data processing and chromatographic integration was carried out by using ‘Analyst software version 1.4.2’. The nitrogen evaporator used to evaporate the samples was procured from Takahe Analytical Instruments. Deep freezers used for storage of plasma samples were procured from SANYO (JAPAN) were used.
Chemicals and Reagents:
Emtricitabine and abacavir working standards were obtained from Macleods Pharmaceuticals Ltd, Mumbai, India. Water was deionized and further purified with Milli-Q system (Millipore USA), Acetonitrile (HPLC grade) and Methanol (HPLC grade) was supplied by J. T. Baker (U.S.A.), Ammonium acetate (AR grade) and Formic acid (AR grade) were supplied by Thomas Baker (INDIA). SPE cartridges used for sample preparation were Water Oasis HLB cartridges 1cc/30mg.
Fresh frozen plasma containing dipotassium EDTA as an anticoagulant was used during validation and study sample analysis was collected in-house in Macleods Pharmaceuticals Ltd, Mumbai India. Plasma was stored at -20°C before sample preparation and analysis.
Standards and Working Solutions:
Stock standard solutions of emtricitabine containing 1 mg/mL was prepared in methanol. Internal standard 1 mg/mL was prepared by dissolving 10 mg of working standard in 1 mL formic acid and made up the volume to 10 mL with methanol. Intermediate dilutions and IS spiking dilutions were prepared from respective stock solutions by dilution with 50% methanol in water. Calibration standards for urine were prepared in the range of 512.37 ng/mL to 80058.30 ng/mL using eight concentration levels. Quality control standards were of three different levels low (1560.82 ng/mL), medium (41074.22 ng/mL) and high (60403.27 ng/mL) were also prepared.
Sample Treatment:
50µL of IS dilution was added to 100µL of urine sample and vortexed. 500µL of water was added to these samples and vortexed. These plasma samples were extracted on Water’s OASIS HLB SPE cartridges. Conditioning of cartridges was carried out with 1 mL methanol followed by 1 mL water. Then 300µL of above prepared urine samples were loaded on the cartridges. The cartridges were washed twice with 1 mL of water. The samples were eluted with 1 mL of methanol. The samples were evaporated to dryness at 50°C under nitrogen and reconstituted with 5 mL of mobile phase.
RESULTS AND DISCUSSION
Optimization of Chromatographic conditions and sample Clean-up
sample clean-up but protein precipitation technique was showing presence of interfering peak hence the extraction procedure was finally optimized using solid phase extraction HLB cartridges 1cc / 30 mg. During sample preparation washing step was optimized using 1 mL water two times to get cleaner samples so as to remove polar impurities which are present in urine sample. Elution of the sample was carried out with 1mL of methanol. Abacavir was used as an IS in the present study as it showed similar chromatographic behavior and both the drugs were quantitatively extracted via solid phase extraction.
Method Validation:
Carryover effect
Carry over effect of the auto-sampler was evaluated by sequentially injecting solutions of mobile phase and blank after extracted high concentration sample containing emtricitabine and IS (concentration equivalent to 1.7 times of ULOQ) and its aqueous recovery comparison sample. No significant carry over was observed when rinsing cycle before and after with 500µL of rinsing solution was applied.
Specificity and Selectivity
[image:3.595.209.407.319.452.2]Six different lots of urine were analysed to ensure that there is no endogenous interference present at the retention time of emtricitabine and IS. Six LLOQ level samples from respective urine lots were prepared and analysed with urine blanks. In all urine blanks, the area response at the retention time of emtricitabine was less than 20% of LLOQ response and at the retention time of IS, the area response was less than 5% of the mean IS response in LLOQ. Representative chromatogram of blank sample is given in fig. 1.
Fig. 1: Representative chromatogram of blank sample
Fig. 2: Representative chromatogram of LLOQ sample
Lower Limit of Quantification (LLOQ)
[image:3.595.202.412.503.643.2]Linearity
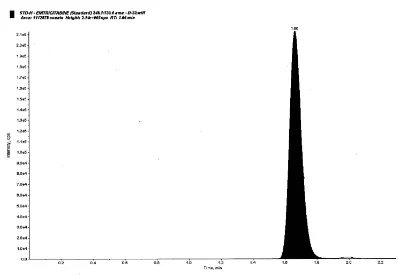
The linearity of the method was determined by analysis of eight point calibration standards. Three linearity curves were analyzed. A regression equation with a weighting factor of1/x and 1/x2 of ratio of drug to internal standard concentration were evaluated for better results in terms of accuracy. Finally 1/x2 was used to produce the best fit for the concentration-detector response relationship. Correlation coefficients (r2) were greater than 0.98 in the concentration range of 512.37 ng/mL to 80058.30 ng/mL (ULOQ fig. 3). Accuracy of all calibration standards was within 85-115% except LLOQ where it was 80-120%.
Fig. 3: Representative chromatogram of highest concentration sample
Matrix effect
Matrix effect may arise due to co-elution of some unintended components present in biological samples. These components result in ion suppression / enhancement, decrease / increase in sensitivity of analyte over a period of time, increase in baseline, imprecision of data, drift in retention time and distortion or tailing of chromatographic peak. Thus assessment of matrix effect plays important role in method validation of quantitative LC-MS/MS method. The % CV of IS normalized matrix factor at LQC, MQC and HQC was 0.95, 1.01 and 1.03 respectively.
Accuracy and Precision
[image:4.595.203.402.168.307.2]The precision of the assay was measured as the percent coefficient of variation over the concentration range of LLOQ QC, LQC, MQC and HQC samples during the course of validation. For determining the intra-day accuracy and precision, replicate analysis of plasma samples was performed on the same day. The inter-day accuracy and precision were assessed by analysis of three precision and accuracy batches on two different days. The obtained precision and accuracy (inter and intra-day) are presented in Table 1.
Table 1.Inter and intra-day accuracy and precision of emtricitabine
QC levels Mean Accuracy (%) Mean Precision (%RSD) Intra day (n=12)
LLOQ QC 97.59 7.07
LQC 97.60 4.57
MQC 103.60 2.44
HQC 99.47 5.16
Inter day (n=18)
LLOQ QC 102.00 8.91
LQC 97.26 4.99
MQC 104.36 3.32
HQC 100.24 4.47
Recovery Study
Stability Studies
The stability of emtricitabine and IS was investigated in the stock and working solutions, in urine during storage, during processing, after three freeze-thaw cycles and in the final extract. The stability samples were compared with freshly prepared calibration curve and quality control samples.
Freeze Thaw (FT) Stability
For freeze thaw stability, retrieval of samples stored at -50°C was carried out after 24 hrs for first FT cycle and then two more FT cycles were carried out after at least 12 hrs of freezing for each cycle. The samples were found to be stable after three FT cycles. Summary of stability data is presented in Table 2.
Bench Top Stability
Bench top stability, using six sets each of LQC and HQC was evaluated by placing quality control samples at room temperature for 5 hours. The plasma samples were found to be stable for 5 hours at room temperature. Summary of stability data is presented in Table 2.
Auto Sampler Stability
In assessing the auto-sampler stability, QC samples placed in the auto-sampler, were injected after 51 hours. The samples were found to be stable for 51 hours at 4°C. Summary of stability data is presented in Table 2.
Stock Solution Stability
[image:5.595.144.469.503.675.2]Bench top stock solutions stability and refrigerator stock solutions stability was evaluated by injecting six replicates of stock dilutions of both stability and comparison stock solution of emtricitabine and acyclovir. The stock solutions of emtricitabine and acyclovir were found to be stable for 23 hours and 16 hours respectively at room temperature and in refrigerator stock solutions were found to be stable for 5 days 17 hours.
Table 2. Summary of stability data
Stability QC level Precision (% CV)
Mean
Accuracy (%) Stability Duration
Bench Top LQC 1.03 89.88 5 hrs HQC 2.58 93.42
Freeze Thaw LQC 1.57 93.10 3 Cycles HQC 7.15 95.16
Autosampler LQC 6.95 106.57 51 hrs HQC 5.72 107.81
Each mean accuracy, % CV of each stability represents six observations (n=6) of corresponding QC levels.
Fig. 4: A representative graph of Urine Emtricitabine Concentration in subject
Clinical Sample analysis
72 hrs time points. Recommended dose of emtricitabine is 200 mg once in a day. Since urine concentrations of emtricitabine are observed even after 24 hours it is possible to find out that if a patient has been taken emtricitabine tablet in last 24 hrs or not, just by doing urine analysis of patient. Thus urine sample analysis help in checking patient adherence to the treatment. The procedure can also help in screening of human volunteers for bioequivalence study of emtricitabine. A representative graph of urine emtricitabine concentration obtained in defined time interval is given in fig.4
CONCLUSION
A simple sensitive, selective, precise and accurate LC-MS/MS method for the determination of emtricitabine in human urine was developed. This method can be further applied to analysis of emtricitabine from human urine. Urine analysis can serve as a useful tool to monitor patient adherence in HIV treatment. The method can also used for the screening of subjects for the study of emtricitabine.
REFERENCES
[1]LH Wang, AA Wiznia, MH Rathore, GE Chittick, SS Bakshi, PJ Emmanuel, and PM Flynn, Antimicrob Agents Chemother., 2004, 48(1): 183–191.
[2]http://www.hivandhepatitis.com/hiv_and_aids/atripla1.html [accessed on September 3, 2011]. [3]P Kemasari, S Sangeetha and P Venkatalakshmi, J. Chem. Pharm. Res., 2011, 3(5): 653-659. [4]JPK Adotey, JK Bentum, EJ Koranteng-Addo, FK Baah, J. Chem. Pharm. Res., 2011, 3(3): 148-153. [5]BK Mandal, KT Suzuki, Y Ogra and H Imai, J. Chem. Pharm. Res., 2011, 3(4): 912-936.
[6]K Agibothu, H Kumar, G Ramchandran, P Kumar, V Kumaraswami, S Swaminathan, Med Gen Med 2006, 8(4), 53.
[7]George & Lunn, HPLC methods for recently approved pharmaceuticals, Wiley Interscience, A John Wiley & Sons Inc. Publications, USA, 2005, 215.
[8]V Amudhavalli, KS Lakshmi, DV Kalidindi, RS Surapaneni, RSRK Raju and VK Pichikala, J. Chem. Pharm. Res., 2011, 3(3): 119-122.