Potential Growth Analysis of FDI in Albania
Llesh Lleshaj*, Alban Korbi
Faculty of Economy, University of Tirana, Albania
Received October 6, 2019; Revised November 8, 2019; Accepted November 16, 2019
Copyright©2019 by authors, all rights reserved. Authors agree that this article remains permanently open access under the terms of the Creative Commons Attribution License 4.0 International License
Abstract
This study analyzed 20 different countries that are the origin state of foreign investors, which have invested in Albania (this sample represents 95% of FDI (Foreign Direct Investments) stocks, 2007 - 2014). The analysis technic used is the gravity model of FDI stocks in Albania. The main independent variables in this analysis are GDP, the level of business taxes, the difference of GDP per capita, the similarity economies, etc. The result of this study: The level of FDI stocks in Albania is lower than its potential compare with FDI stock average in the States of the Balkan Region.Keywords
FDI, Gravity Model, Investment Potential1. Introduction
Globalization development in the world, nowadays continuous to arise clearly and emphasizes the importance of FDI (Foreign Direct Investments) in different economies. The major priority in government agenda, in many countries, is the applying of appropriate infrastructure for motivating foreign investors. Existing capital inflows from the host country to another origin country, create FDIs transactions. These countries must be in competitive positions, which is caused by more advantages offering from the host country. Only by the competitive and advantages in doing business, the host country is focused to motivate foreign investors, as a consequence these investors might offer efficacy productions in many economy fields of the host country. In the last two decades, FDIs are made very important in developing economy countries. Many economics theories have identified a large number of ways that FDI inflows might bring so many economy benefits at host countries. In Albania, the last years FDI stocks are 9-10% of GDP. This is the main reason, why is this study made?
FDIs have an enormous effect in: the growth of investment capital in the host country; new technologies transferring and new knowledge in their applications;
employee specializations; growth productivity in the host economy; light level and many dimensions in export competitions; developing markets in the host country; etc. On the other hand, the most important and especially economic issues, it is the fact that FDI flows have not a negative effect on public debt. FDIs are an economic instrument with high efficiency for financing the foreign trade deficit, national current account in the host country (when this deficit has a high level and it is very problematic in Albania). Base on all these arguments above, in this study we will develop one research on main factors that cause developing of FDIs. Our focus is the evaluation of potential growth of FDIs in Albania and their marginal growth. In this study are analyzed 20 economic partner countries with Albania. These origin countries have invested about 95% of FDI stocks in Albania. The data are time series from 2007 to 2014 with a quarterly frequency. Analytical and econometrical technic to analyze the data in this study is used according to the gravity model for FDIs in Albania. The main variable are: gross domestic product, the level of business taxes, the difference of GDP per capita, the similarity between Albanian economy and partner country economies, etc. The essential questions in our study are: How much are FDIs in Albania developed? How far is the fact of FDIs in Albania form potential level (compare with FDI stocks in the states of the Balkan Region)? If FDIs are under potential, how much is this gap? etc..
2. Empirical Literature Review
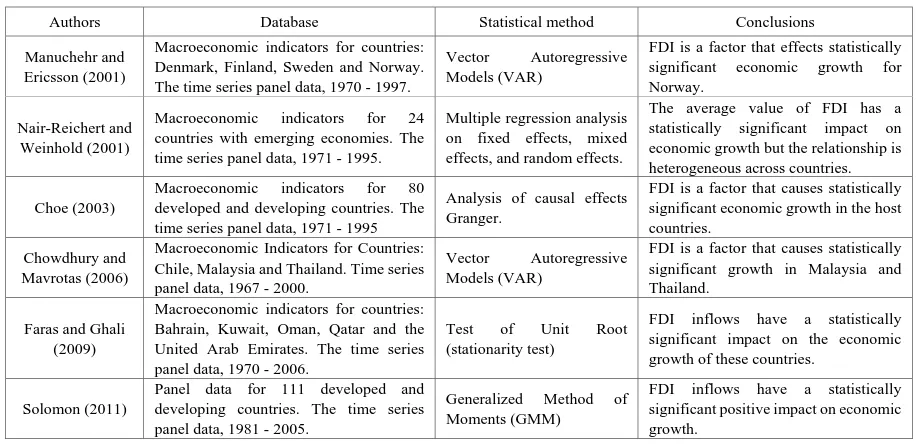
Table 1. Statistical significance between FDIs and economic growth (positive correlation) Authors Database Statistical method Conclusions Manuchehr and
Ericsson (2001)
Macroeconomic indicators for countries: Denmark, Finland, Sweden and Norway. The time series panel data, 1970 - 1997.
Vector Autoregressive Models (VAR)
FDI is a factor that effects statistically significant economic growth for Norway.
Nair-Reichert and Weinhold (2001)
Macroeconomic indicators for 24 countries with emerging economies. The time series panel data, 1971 - 1995.
Multiple regression analysis on fixed effects, mixed effects, and random effects.
The average value of FDI has a statistically significant impact on economic growth but the relationship is heterogeneous across countries. Choe (2003)
Macroeconomic indicators for 80 developed and developing countries. The time series panel data, 1971 - 1995
Analysis of causal effects Granger.
FDI is a factor that causes statistically significant economic growth in the host countries.
Chowdhury and Mavrotas (2006)
Macroeconomic Indicators for Countries: Chile, Malaysia and Thailand. Time series panel data, 1967 - 2000.
Vector Autoregressive Models (VAR)
FDI is a factor that causes statistically significant growth in Malaysia and Thailand.
Faras and Ghali (2009)
Macroeconomic indicators for countries: Bahrain, Kuwait, Oman, Qatar and the United Arab Emirates. The time series panel data, 1970 - 2006.
Test of Unit Root (stationarity test)
FDI inflows have a statistically significant impact on the economic growth of these countries.
Solomon (2011)
Panel data for 111 developed and developing countries. The time series panel data, 1981 - 2005.
Generalized Method of Moments (GMM)
FDI inflows have a statistically significant positive impact on economic growth.
Source: Literature review, summarized by the authors.
It is used several statistical methods to evaluate the connection between FDIs and economic growth. In the 90s mostly were used: Ordinary Least Squares; Granger causality test; Co-integration Tests; Analysis of Error Corrections; Generalized Method of Moments; Two-stage Least Squares; Seemingly Unrelated Regressions; etc. All these methods aim to identify many connections. According to many studies have concluded that FDIs are economic factors (input factors) which cause positively the economic growth by the endogenous effects, in the host countries. These statistical methods are used in the different macroeconomic data (panel data) for developing countries and developed countries that we mention: Europe, North America, Asia, Latin America, etc. To summarize these conclusions from studies done, and empirical literature reviews on FDIs and economic growth, in the last two decades were published many scientific and meaningful studies that are in table 1.
3. Research Methodology
The methodology of this study is based on the gravity model of FDI. The gravity model after the 1990s had widespread application in estimating FDI flows and FDI stocks between countries and regions (IMF, 2011; LSE, 2013; etc.). By analogy with the rule of physics gravity: The flow of FDI between the two countries is directly proportional to the product of the economic measure of each country (generally is estimated by GDP), and inversely proportional to the distance between the economic centers of the countries (generally is taken as geographical distance between capitals). The analytical method of the gravity model is a function which in the case of FDI in Albania has the form of the model as follows:
Log(FDIijt) = β0 + β1Log(GDPit) + β2Log(GDPjt) +
β3Log|TAXit – TAXjt| + β4Log(DISij) + β5DAFijt + β6NMEijt + β7BEj + uijt
Where the variables are:
FDIijt is the value of FDI stock between country i
(Albania) and j (partner countries), for the time t;
GDPit is Gross domestic product i (Albania), for the time
t, valued at current prices;
GDPjt is Gross domestic product j (partner countries), for
the time t, valued at current prices;
DISij is the distance between Albania and the country of
origin of the foreign investor;
BEj is the dummy variable (is 1 if the partner country
belongs to the EU, is 0 otherwise);
TAXit is the level of business taxes in Albania, for the
time t;
TAXjtis the level of business taxes in partner countries,
for the time t;
DAFijt is the difference of GDP per capita between
Albania with partner country, for the time t;
NMEijt is similarity of economic size between Albania
with partner country, for the time t;
The β1, β2, …, β7 parameters express the FDI elasticity
with the variables, respectively;
uijt is the stochastic error term of the model.
Due to the economic analysis of fiscal policy, in this study is analyzed the tax difference between the host country and the partner country. In economic analysis the tax rate difference is more important than the indicator values for each country. The variables DFA and NME are aggregate economic indicators. The DFA variable is calculated by the formula:
[image:2.595.68.526.89.311.2]Where POPit is the population in Albania and POPjt is the population of partner country, for the time t. This variable is expected to have a negative correlation with horizontal FDIs and a positive correlation with vertical FDIs. Whereas, NME is calculated by the formula: NMEijt = log{1 – [GDPit/(GDPit+GDPjt)]2 – [GDPjt/(GDPit+GDPjt)]2}
This variable is expected to have a positive correlation with horizontal FDIs.
The econometric analysis of the model will be based on the following tests: pool data; random effect and fixed effect. Gravity model estimations with fixed effects as well as random effects apply the estimation method by Hausman-Taylor (1981), which has probability hi-square distribution. This method estimates the correlations of the dependent variable on each independent variable (i.e. whether or not the variable changes over time), and some of these variables may be "endogenous" in the sense of correlation with particular effects, but the residuals of the model are "exogenous" related to the error term u.
Two different methods can be used to calculate the level of potential FDI (Egger, 2002). These two methods are:
In-sample estimation, by this method, the residuals of
the gravity model from the OLS (Ordinary Least Squares) estimation are interpreted as the difference between the actual and potential flows. Where the potential flow is called the level of value from the regression equation.
Out-of-sample evaluation is a method that is not
criticized on the conceptual basis, but is often difficult to apply in reality. This method identifies some countries with
similar economic indicators or closely similar to the host country economy and higher FDIs than host country, and in these data is applied the gravity model. After constructing the equation of gravity model for a specific year (depending on the analysis of year we want to analyze), we calculate the value of FDIs. We compare this value with the actual value of FDI in Albania. This is the way to estimate the potential of FDI.
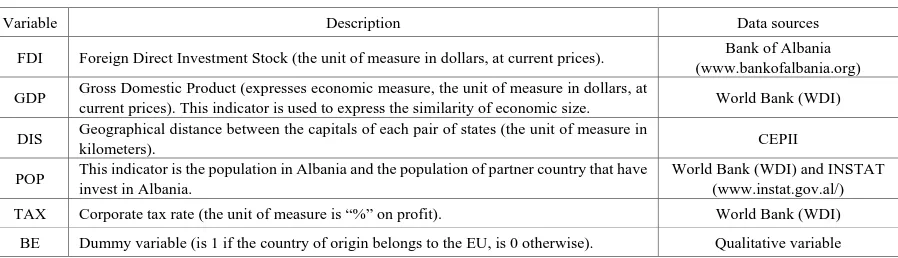
[image:3.595.75.524.471.600.2]In our study we will use the second method "out-of-sample estimation". Albania, as a country of the Balkans, has similar economic structures to these countries. We will use the parameters of the gravity model for FDI flows from the LSE study (2013), with the time series 1990 - 2011 for the Balkan countries (Albania, North Macedonia, Serbia, Montenegro, Bosnia and Herzegovina, Croatia, Romania and Bulgaria). These parameters show the average FDI development potential in the Balkans. We will compare this average value with the actual situation of FDI inflows in Albania for several years, to have a complete evidence of the performance of FDI growth potential. The time length of the values of Albania's macroeconomic variables for the gravity model is equal to the time length of the equation parameters for Balkan Region (studied by LSE). This way of estimating is to eliminate the artificial mistake of comparing fact with FDI potential. In support of this fact we will assess the potential of FDI growth for the last several years. The time series of the panel data in the gravity model of FDI in Albania is 2007 – 2014 (with quarterly frequency). Table 2 summarizes the variable, meaning, and source of information. All data are secondary according to national and international official statistics.
Table 2. Description of variables and data sources
Variable Description Data sources FDI Foreign Direct Investment Stock (the unit of measure in dollars, at current prices). Bank of Albania
(www.bankofalbania.org) GDP Gross Domestic Product (expresses economic measure, the unit of measure in dollars, at
current prices). This indicator is used to express the similarity of economic size. World Bank (WDI) DIS Geographical distance between the capitals of each pair of states (the unit of measure in
kilometers). CEPII
POP This indicator is the population in Albania and the population of partner country that have invest in Albania.
4. Econometric Analysis and Findings
The following analysis includes 20 countries of origin of foreign investor countries that have invested in Albania, which constitute 95% of the average FDI stocks in Albania for 2007-2014. Partner countries (or countries of origin of foreign investors) analyzed: Greece, Canada, Austria, The Netherlands, Italy, Turkey, Switzerland, Germany, France, Kuwait, Cyprus, Lebanon, USA, North Macedonia, Bulgaria, Slovenia, Croatia, Norway, United Kingdom and Egypt. First of all, in the study we found the links and effects of FDI with the countries of origin, i.e. it was identified towards the link and then the potential gap. The general form of the gravity model is as the equation follows:
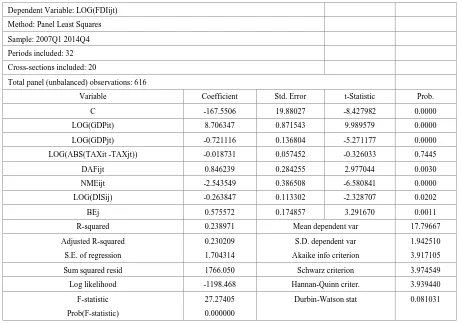
Log(FDIijt) = – 167.55 + 8.71*Log(GDPit) – 0.72*Log(GDPjt) - 0.02*Log|TAXit – TAXjt| + 0.85*DAFijt – 2.54*NMEijt – 0.26*Log(DISij) + 0.58*BEj + uijt
The gravity model of FDIs in Albania according to Fisher's test (Table 3) is statistically significant with p < 5% significance level. This model explains the correlations of the variables individually related to the student distribution t-statistics, with p < 5% statistical significance, as follows:
Gross domestic product i (in Albania) (GDPit). If GDP
will increase by 1% (under constant conditions of other variables), it will increase FDI with 8.71%. GDP growth indicates the general effect of the growing and the potential economy for investment in the host country or the development of markets.
Gross domestic product in the country of origin j (GDPjt). If GDP will increase by 1% this will reduce FDI in
Albania with 0.72%, because of the country of origin is more competitive and has a growth aggregate business climate higher than Albania and this business climate stimulates investment in the country of origin.
The difference from capita income (DAFijt). If the per
capita income gap (used as a measure of economic well-being) between Albania with partner countries is increased with 1% to Albania's disadvantage, this increases
by 0.85% FDI in Albania. Increase in DAF indicator to Albania's disadvantage shows that the countries of origin of foreign investors have reached a level of market development that always require new ways of horizontal expansion, is new markets. On the other hand, this variable indicates that labor costs are more competitive in the host country and promotes FDI.
The similarity of economic size (NMEijt). If the similarity
of economic size between Albania with partner country, for
the time t is increased with 1 unit this will reduce FDI in Albania with 2.54%, because of the countries become more similar and economic potentials are comparable. Albania should invite foreign investors from economies far larger than its economy. The fact that the NME variable is negatively correlated with FDI this mean that Albania has vertical FDI. In these conditions, government policies should promote the vertical integration of foreign investment rather than expanding it into the market.
The distance between Albania with the country of origin
of the foreign investor (DISij). The model shows the
relationship of distance to FDI on the negative side. The average geographical distance of the 20 countries of origin of foreign investors who have invested in Albania is 2010 km. If this distance is increased with 1% (or 20 km), the FDI level is expected to decrease with 0.26%. Government policies should aim to promote business potential for investors more opportunities for geographically closer than far away investors. This conclusion is also realized by the dummy indicator, EU, if Albania aims to increase foreign investment from EU countries, for every other place FDI is expected to increase with 0.58%.
Table 3. Statistical estimation of gravity model parameters (pool data) Dependent Variable: LOG(FDIijt)
Method: Panel Least Squares Sample: 2007Q1 2014Q4 Periods included: 32 Cross-sections included: 20
Total panel (unbalanced) observations: 616
Variable Coefficient Std. Error t-Statistic Prob. C -167.5506 19.88027 -8.427982 0.0000 LOG(GDPit) 8.706347 0.871543 9.989579 0.0000 LOG(GDPjt) -0.721116 0.136804 -5.271177 0.0000 LOG(ABS(TAXit -TAXjt)) -0.018731 0.057452 -0.326033 0.7445 DAFijt 0.846239 0.284255 2.977044 0.0030 NMEijt -2.543549 0.386508 -6.580841 0.0000 LOG(DISij) -0.263847 0.113302 -2.328707 0.0202 BEj 0.575572 0.174857 3.291670 0.0011 R-squared 0.238971 Mean dependent var 17.79667 Adjusted R-squared 0.230209 S.D. dependent var 1.942510 S.E. of regression 1.704314 Akaike info criterion 3.917105 Sum squared resid 1766.050 Schwarz criterion 3.974549 Log likelihood -1198.468 Hannan-Quinn criter. 3.939440 F-statistic 27.27405 Durbin-Watson stat 0.081031 Prob(F-statistic) 0.000000
Source: authors' calculations in Eviews 9.
Table 4. Statistical estimation of gravity model parameters (fixed effects and random effects) Dependent variable:
Log(FDIijt)
Model I fixed effects test
Model II random effects test Independent variables: Coefficient Probability Coefficient Probability
Constant (β0) -146.4892 0.0000 -149.6793 0.0000
Log(GDPit) 6.038231 0.0000 6.749570 0.0000
Log(GDPjt) 1.029003 0.0721 0.519747 0.2158
Log|TAXit – TAXjt| 0.076046 0.0600 0.068435 0.0862
DAFijt -2.731467 0.0053 -1.746669 0.0236
NMEijt 0.606154 0.7233 0.207513 0.8677
Log(DISij) --- --- -0.204687 0.6800
BEj --- --- 0.332763 0.5921
R2 adjusted 79% 32%
F-test 99.58520 0.000000 42.35939 0.000000 Source: authors' calculations in Eviews 9.
The gravity estimation model above is a panel pooled data analysis. Some variables have fixed effects and some may have random effects. The identification of these effects will be tested by the fixed effects and random effects models (Table 4). The statistical results from Table 4 above show that the variables log (GDP), DAFijt and NMEijt have a sustainable impact on FDI in Albania, independent of the time. Meanwhile, the log (GDP) also shows random effects, making it difficult to estimate this
[image:5.595.68.530.90.414.2] [image:5.595.66.528.444.629.2]appropriate than the random-effects model. The assessment of FDI potential and comparison with the actual situation was analyzed by the out-of-sample estimation method. According to a study done by LSE (2013), with the time series 1990 - 2011 on FDI in the Balkan countries (Albania, Macedonia, Serbia, Montenegro, Bosnia and Herzegovina, Croatia, Romania and Bulgaria), the model equation of gravity for FDI in this study, is:
Log(FDIijt) = 2.01 + 0.8*Log(GDPi,t-1) + 1.29*Log(GDPj,t-1) – 2.82*Log(DISij)
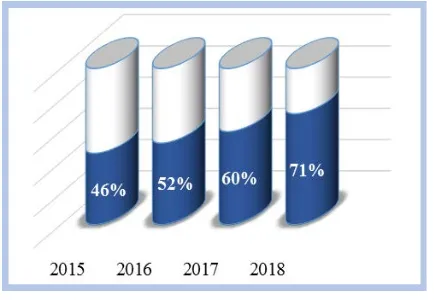
Where i is the Balkan country and j partner countries (countries of origin of foreign investors). All three of these independent variables are statistically significant in the model (with p < 5%). This equation is used for the case of Albania to find the average potential value of FDI for 2015, 2016, 2017 and 2018, then the generated result is compared with the actual FDI situation in Albania. About 95% of FDI stock in Albania for years 2015 - 2018 consists of 15 countries: Switzerland, Greece, Netherlands, Canada, Italy, Turkey, Austria, France, Cyprus, Germany, USA, Lebanon, Kosovo, UK, North Macedonia. The unused FDI potentials from Albania (compared to the average potential level of the Balkan countries except Greece) are shown in Figure 1,
[image:6.595.67.284.381.531.2]follow:
Figure 1. Using level (in %) of FDI potential in Albania
We see that the level of FDI potential in Albania is on average much higher than the real level. Government programs in Albania should promote business advantages to foreign investors.
Albania has still a lot of unused potential for attracting FDI. This analytical conclusion confirms the main hypothesis of this study:
The level of foreign direct investment in Albania is increasing but under potential, compared to the average of FDI in the economies of the Balkan countries [FDI, (factual) < FDI, (regression)].
When we analyze the actual and potential level for 2015 - 2018, we see that there is a tendency to increase FDI stock (because there are FDI inflows during these years) but the actual level is far from the potential level. Since the potential is defined as the average level of FDI in the
Balkan countries, this indicates that there is no use of potentials and advantages for attracting FDI from Albania, and these investors are investing more in other Balkan countries. That difference between the potential with the fact can be reduced if the policies of the government of Albania become more attractive by creating a climate conducive to business and market competition, reducing the level of political-legal risk, reduction of lengthy procedures and corruption in justice, property problem regulation, administration policies and fiscal control, etc.
5. Conclusions
This study analyzes 20 countries of origin of foreign investors in Albania, which account 95% of the average stock of FDI for 2007 - 2014 (with quarterly frequency). The main variables of the study are: gross domestic product, the level of business taxes, the difference of GDP per capita, the similarity between Albanian economy and partner country economies, etc. Using the analytical technique of gravity model for FDI in Albania for different origin countries, FDI has a statistically significant and positive relationship with:
GDP of Albania (the change 1% in economic growth causes the change with about 9% of FDI);
The difference of Albania's economic well-being with the country of origin of the investor (the change 1% in well-being causes the change with about 0.9% of FDI);
While FDI in Albania has a statistically significant and negative relationship with:
GDP of the origin country (the change 1% in economic growth causes the change with 0.7% of FDI);
Geographical distance between Albania with the origin country (when the distance change with 1% or 20 km, FDI is expected to change with 0.26%). Also, if Albania aims to attract foreign investors from the European Union countries, each country is expected to have an additional FDI growth with 0.58%. The difference of business tax between Albania with the countries of origin of foreign investors is statistically insignificant. Comparing the development of FDI in the Balkan countries with FDI in Albania (with the exception of Greece), it results that the average level of FDI potential in Albania is consistently higher than the actual level. In 2018, it is estimated that only 71% of potential FDI is realized by Albania's governance policies. Albania is currently very under the potential of attracting foreign direct investors, compared to the Balkan countries.
Taking everything into account the recommendations of our study addressing the governance of Albania are:
need for FDI. The attraction of FDI should be realized through mechanisms for foreign investors to stay in Albania as long as possible. FDI attraction policies should be designed to serve the purpose of the economic sector according to national development priorities.
Increase economic co-operation with the countries of the Western Balkans, by signing joint strategies for developing trade and attracting the big foreign investors. In order to increase the use of FDI potentials that Albania has not used for years. One open discussion for further analysis and studies is the FDI potential in Albania by sector of economy and country of origin.
REFERENCES
Choe, J. Il. (2003). Do Foreign Direct Investment and Gross [1]
Domestic Investment Promote Economic Growth?” Review of Development Economics, 7(1), 44-57.
Chowdhury, A., & Mavrotas, G. (2006). FDI and Growth: [2]
What Causes What? World Economy, 29(1), 9-19. Cieślik, A., & Hien Tran, G. (2019). Determinants of [3]
outward FDI from emerging Economies. Equilibrium. Quarterly Journal of Economics and Economic Policy, 14(2), 209–231. doi: 10.24136/eq.2019.010
Demirhan, E. & Mahmut, M. (2008). “Determinants of [4]
Foreign Direct Investment Flows to Developing Countries: A Cross-Sectional Analysis”. Prague Economic Papers, Vol. 4, pp. 356-369.
Egger, P. (2002). An Econometric View on the Estimation of [5]
Gravity Models and the Calculation of Trade Potentials. World Economy, 25, 297-312
Estrin, S. & Uvalic, M. (2013). Foreign direct investment [6]
into transition economies: Are the Balkans different? LSE ‘Europe in Question’ Discussion Paper.
Fama, E., & French. K. (2012). “Capital Structure Choices”. [7]
Critical Finance Review. Vol. 1, pp. 59 – 101.
Faras, R.Y., & Ghali, K.H. (2009). Foreign direct investment [8]
and economic growth: the case of the GCC countries. International Research Journal of finance and economics, (29), 134-145.
Folfas, P. (2011). FDI between EU member states: gravity [9]
model and taxes. European Trade Study Group Conference, IMF.
Grosse, R. & Trevino, L. J. (2005). New Institutional [10]
Economics and FDI Location in Central and Eastern Europe. Management International Review, Vol. 45 (2), pp.123-145.
Gujarati, D. (2004). Basic Econometrics (4th ed.). The [11]
McGraw−Hill Companies, New York.
Housman, J., & Taylor, W. (1981). Panel data and [12]
unobservable individual effects. Econometrica, 1377-1398.
Manuchehr, I., & Ericsson, J. (2001). On the causality [13]
between foreign direct investment and output: a comparative study. The International Trade Journal, 15(1), 1-26.
Nair- Reichert, U., & Weinhold, D. (2001). Causality Tests [14]
for Cross- Country Panels: a New Look at FDI and Economic Growth in Developing Countries. Oxford bulletin of economics and statistics, 63(2), 153-171.
OECD (2008). Benchmark Definition of Foreign Direct [15]
Investment. Fourth edition
Pekarskiene, I., & Susniene, R. (2015). Features of foreign [16]
direct investment in the context of globalization. 20th International Scientific Conference Economics and Management - 2015 (ICEM-2015), 204-210.
Ranjan, V., & Agrawal, G. (2011). “FDI inflow [17]
Determinants in BRIC countries: A Panel Data Analysis”. International Business Research, Canadian Center of Science and Education, Vol. 4 (No. 4).
Solomon, E.M. (2011). Foreign Direct Investment, Host [18]
Country Factors and Economic Growth. Ensayos Revista de Economia, 30(1), 41-70.
UNCTAD (2018). “World Investment Report 2018, [19]
Investment and New Industrial Policies”.
Vesaite, R. (2014). FDI from European Union to Western [20]