Forecasting Techniques, External Operating Environment
and Accuracy of Performance Forecasting
E. W. Chindia
Department of Management Science, School of Business, College of Humanities & Social Sciences, University of Nairobi, Kenya
Copyright©2016 by authors, all rights reserved. Authors agree that this article remains permanently open access under the terms of the Creative Commons Attribution License 4.0 International License
Abstract
This article explores the influence of the external operating environment (EOE) on the accuracy of performance forecasting (APF) in large manufacturing firms (LMFs) in Kenya. The objective was to assess if any aspects of the EOE influenced measures of APF. APF, in manufacturing operations, is seldom derived accurately. However, since LMFs tend to hire skilled personnel, this survey presumes that these qualified forecasters ensure APF when preparing future budgets. EOE has been known to influence the behavior of operations resulting in either adverse or favorable organizational performance. The study identified EOE factors that impact organizational performance and tested these against measures of APF. Regression analysis was applied using data collected through a structured questionnaire administered among randomly selected LMFs. Results indicated that there was evidence that EOE had an influence on some measures of APF and the established forecasting techniques (FTs), objective, judgmental and combined forecasting.Keywords
External Operating Environment, Accuracy of Performance Forecasting, Large Manufacturing Firms, Forecasting Techniques1. Introduction
In business, change is inevitable and organizations that don’t accept change and that make adjustments to their business model based on changes have a high degree of underperformance or even failure. There are events or situations that affect the way a business operates. These events or situations, called environmental factors, can have either a positive or negative impact on a business. There are two types of environmental factors, internal and external environmental factors. Internal environmental factors are events that occur within an organization. On the other hand, external environmental factors are events that take place outside of the organization and are harder to control. External environmental factors can be more dangerous for an
organization given the fact that they are unpredictable, hard to prepare for, and often bewildering. Some examples of external environmental factors include, changes to the economy, threats from competition, political factors, government regulation, and the industry itself. Since a business does not operate in a vacuum, it has to act and react to what happens outside the factory and office walls. These external factors or influences that happen outside the business will tend to affect the main internal functions of the business and possibly the objectives of the business and its strategies. As enterprises always operate under conditions of uncertainty, management wishes to limit this uncertainty by predicting changes in factors that influence operational performance and assigning, with some level of accuracy, expected sales volume, price, cost and interest rates.
Forecasting therefore, remains a key fundamental in predicting the future for any industry. In essence, managers would like to know about the future before it happens, hence, accurate forecasting can help in developing strategies to promote profitable trends and to avoid unprofitable ones. Over time, a number of factors have been identified that cause an increase in the importance of forecasting; these include competitive challenges, rapid and unpredictable changes in economic and market conditions, increased complexity of organizations - submarkets served, products offered and their environments, technology changes and demand structures - which have made organizations move towards more systematic decision making that involves explicit justifications for individual actions. This study proposes to test where the influence of the external operating environment is strongest as relates to accuracy of performance forecasting in large manufacturing companies, in Kenya.
2. Literature Review
characteristics of the markets, levels of income in the identified markets, competitive activity in those markets, availability of labor and desired skill levels at the site, availability and form of infrastructure in place, environmental constraints, bargaining power of suppliers and customers, technology and the less talked about accessibility to education and training. While national politics may be of importance, this aspect tends to have a relatively uniform impact on forecasting of production and sales in any manufacturing industry; conversely, politics at the local level could be an impediment or support pillar and could therefore, introduce differences in forecasting for sales and forecasting techniques within the manufacturing sector.
Several scholars have observed that APF can be affected by both the external and internal operating environments. According to Kibera [1] business operating environment comprises internal factors, task environment (customers, new entrants, competitors, suppliers and substitutes), remote environment (political, economic, socio-cultural, technological, geo-ethnical factors) and ultra-remote environments (earthquakes, natural calamities, and wars). Kibera proposes that business context consists of various dimensions and that the environment can be classified as stable, changing or turbulent.
On the other hand Wilson [2]) posits that generational marketing enables the narrowing of target markets to manageable sizes through a detailed understanding of demographics. Wilson asserts that many businesses make the mistake of trying to appeal to too many target markets which could lead to underperformance or even failure. Other researchers (Brown [3]; Frey [4]; Kaylene & Robert [5]; Levy [6]; and Valkeneers & Vanhoomissen [7]) hold the same view and emphasize a closer scrutiny of demographics in defining market demand. In this article, it is suggested that in assessing demographics, it is important to identify their distinguishing characteristics, that is, critical needs of potential customers and if these are being met; understand the demographics of the group and their location; evaluate any seasonal or cyclical purchasing trends that may impact a business; determine the size of the primary target market; include data about annual purchases each market makes in its specific industry; understand the forecasted growth for this group; anticipate how much market share one can gain; and evaluate the market share percentage and number of customers one expects to obtain in a defined area. In this endeavor, it is important for one to explain the logic behind all calculations, and check pricing and gross margin targets by defining pricing structure, gross margin levels and any discount that one plans to use in order to guide APF.
In addition to the above, it is important to interrogate one’s competitive analysis by identifying competition by product line and market segment and assess characteristics of the competitive landscape in order to eliminate missteps in APF. While an analysis of several factors is deemed appropriate, a focus on the market share, strengths and weaknesses, how important one’s target market is to one’s competitors, entry barriers; available window(s) of opportunity to enter the
market, any indirect or secondary competitors who may impact one’s success or otherwise, and barriers to market, including technology would stimulate the impetus for deriving accurate performance forecasts. Any good business will have a system of sales forecasting as part of its critical management strategy. For LMFs, forecasting assumptions could mean plotting all activity across departments to see how the firm’s products are matching up to industry standards. Since the world we are in today is very unpredictable, people’s tastes and preferences are constantly shifting and must be managed against the backdrop of perceptions about product quality in relation to global industry standards.
In his article, Porter [8]) contends that “the economic value of an industry may be drained away through rivalry among existing competitors, but it could also be bargained away through the power of suppliers or the power of customers or be constrained by the threat of new entrants or the threat of substitutes”. In essence, APF of a business can be impacted by any of the above five factors. In his survey study, Supatn [9] noted that sourcing performance plays a significant role in high competitive industries since it enhances a firm’s competitive advantages by reducing production cost and lead time. He posits that developing a procurement plan as well as selecting the right suppliers from the right supply markets affects sourcing performance. Supatn concludes that the quality of supplier relationships significantly influences sourcing performance. Other researchers have suggested that negotiation power of the buyer (Vickery [10]) coupled with accuracy of demand forecasting (Mattila et al. [11]; Fisher & Rajaram [12]; Jackson & Shaw [13]) could substantially affect sourcing performance. On their part, Jin [14] and Kannan et al. [15] found that supplier relationships form another influencing factor of effective sourcing performance in firms within the fashion industry. The study in Kenya tested the influence of supplier power on APF in large manufacturing firms in that country.
Daft [17]). These variables can be introduced from within or without national boundaries and include demographic characteristics, competition (subsidized imports, substitute products, counterfeit and substandard goods), customers and supplier power, since performance forecasting can take either a top-down or bottom-up process. The top-down forecasting entails examining international and national events – imports, supplier power, shipping, wages, strikes, environmental regulations - that affect the future behaviour of local variables and bottom-up forecasting involves assessing local events – wages, employee treatment, strikes, environmental regulations - that affect the future behaviour of local variables.
In Kenya, the manufacturing industry continues to grapple with competitive challenges posed by subsidized imports, substitute products, counterfeit and sub-standard goods. This means locally manufactured goods are more costly than imported products, which negatively affects their customer base and profitable pricing. In addition, Kenya’s average import tariff is perceived not to be sufficiently protective, although in an open market economy – Kenya boasts a market-based economy and the most liberal economic system in East Africa - one would argue that this is not a factor to be considered. Underperformance in LMFs, in Kenya, could possibly point to rampant inefficiencies in their manufacturing processes. Also, supplier power that results from raw material imports and instability in the monetary exchange rate have been observed as posing a setback as pricing levels of final products become prohibitive. This paper focuses on the influence of the variables of the EOE that are perceived not to be static among different manufacturing sectors, in Kenya.
Forecasting research relies on statistical measures of performance to evaluate forecasting techniques using a competition format (Mentzer and Cox [18]; Mentzer and Kahn[19]; Makridakis and Hibon [20]), and within surveys to assess the reported level of performance achieved in practice (Hughes [21]; McCarthy et al. [22]). Results of these research streams offer a mixed picture of the extent to which forecasting accuracy has improved over time. While studies on competing forecasting methods have helped to identify techniques that can improve accuracy under different demand scenarios, it has been found that practice studies have not found evidence that industry is achieving the same level of improvement. Forecast accuracy has therefore, been considered to be a contemporary issue in which more
research is needed (Makridakis et al. [23]; Armstrong [24]; DeRoeck [25]; Mahmoud et al. [26]; Schultz [27]; Winklhofer et al. [28]; Armstrong [29]; Fildes [30]; Davis & Mentzer [31]; Foslund & Jonsson [32]). Researchers have also observed that forecasting application issues are still under-explored and yet greatest gains in forecasting research are in the areas of implementation and practice in firms (Makridakis et al. [23]; Schultz [27]). The purpose of this study is to test the influence the EOE has on APF and FTs in LMFs, in Kenya.
3. Conceptual Framework
According to Fahy & Smithee [33] forecasting models are conceptualized on the premise that organizations’ desired outcome is to achieve a sustainable competitive advantage that allows them to earn above-average returns. Barney [34] and Foley & Fahy [35]) posit that the key to earning this reward is the possession of critical resources that are firm specific, valuable to customers, non-substitutable, and difficult to imitate, leading, if deployed effectively, to a sustainable competitive advantage. This perspective emphasizes firm-specific capabilities and assets and the existence of isolating mechanisms as the fundamental determinants of firm performance. Day [36] defines capabilities, which include APF, as complex bundles of skills and collective learning, exercised through organizational processes that ensure superior and effective coordination of functional activities...
Figure 1. Conceptual Framework
3.1. Indicators of Accuracy of Performance Forecasting The following were identified as appropriate dependent variables of accuracy of performance forecasting
3.1.1. Expected Value (EV)
Otherwise known as profit growth, EV is a measure of a firm’s growth in profit year-on-year in real terms. The EV gives an indication of how a firm is managing costs while increasing prices at the same time even in a market with intense rivalry. If forecasts are prepared accurately the EV yield will approximate expectations as per forecasts. 3.1.2. Return on Sales (ROS)
Is a ratio used to evaluate a company’s operational efficiency; it is also known as a firm’s operating profit margin.
3.1.3. Return on Assets (ROA)
This is an indication of how profitable a company is relative to its total assets. ROA gives an idea as to how efficient management is at using its assets to generate earnings. It is calculated by dividing a company’s annual earnings by its assets. ROA is generally displayed as a percentage.
3.1.4. Growth in Market Share (GMS)
Market share is the percentage of an industry or market’s total sales that is earned by a particular company over a specified time period. Market share is calculated by taking the company’s sales over the period and dividing it by the total sales of the industry over the same period. Growth in market share year-on-year indicates growth in sales year-on-year.
4. Hypothesis
H1: External operating environment (EOE) has an
influence on the accuracy of performance forecasting (APF) in large manufacturing firms (LMFs), in Kenya.
H2: External operating environment has a moderating
effect on the relationship between the objective forecasting method and APF in LMFs, in Kenya
H3: External Operating Environment has a moderating
effect on the relationship between the subjective forecasting method and APF in LMFs, in Kenya.
H4: External Operating Environment has a moderating
effect on the relationship between the combination forecasting method and APF in LMFs, in Kenya.
5. Research Problem
In forecasting, various research streams offer a mixed picture of the extent that APF has improved over time; on the other hand empirical findings indicate that practice studies have not found evidence that industry is achieving improvement in APF. The research question which this paper examines is: What is the influence of the EOE on APF and FTs in LMFs, in Kenya? The research focus included identifying APF predictors that are influenced by the EOE and also examining the impact of the EOE on the relationship between a FT and APF.
6. Methodology of Research
This was a descriptive cross-sectional survey that used the positivist research philosophy.
6.1. Sample of Research
their survey on small-scale manufacturers in Kenya, Gray et al. [37] classified large manufacturers as employers with of at least 100 workers. Sample size was calculated using a table for sample size determination of a “known” population by Krejcie et al. [35], which resulted in 217 firms that were surveyed having been selected using proportionate stratified random sampling (PRS) technique. Each target firm in each industry sector and geographical location was selected using simple random sampling (SRS) technique. According to Sekaran [36] this sampling design (SRS) has the least bias and offers the most generalizability.
6.2. Instrument and Procedures
The study employed secondary data that was obtained from the target sample through a structured questionnaire that was hand-delivered to the selected teams of managers within the 217 respondent LMFs. Responses were received from 176 firms, which meant an 81 per cent response rate was achieved. Prior to administering the research instrument, the instrument had been piloted on ten LMFs to assist in identifying any ambiguous and unclear questions. Respondents were assured of a high degree of confidentiality and anonymity of their responses.
Data collection included respondents either completing the questionnaire on their own or in the presence of the researcher/research assistant, in their respective locations. Secondary data involved collecting existing performance data from published and unpublished reports over a period of one year in the different LMFs. These metrics addressed the objective of the study.
6.3. Data Analysis
The data was subjected to regression analyses to estimate the relationships among variables. Regression analysis is widely used for prediction and forecasting to understand which among the independent variables are related to the dependent variable, and to explore the forms of these relationships. Regression analysis can also be used to infer causal relationships between the independent and dependent variables, where APF is the dependent variable in this study.
7. Results
7.1. EOE had a partial influence on APF under GMS through Competitors as follows:
GMS = 38.374 – 5.212 Competitors (0.004) (0.013)
This implied that a unit marginal change in competitors resulted in a decline of 5.212 units in growth in market share.
Table 1. Growth in Market Share – Coefficients
Model
Un-standardized
Coefficients Standardized Coefficients t-value P-Value Beta Standard Error Beta
1
(Constant) 38.374 13.138 2.921 0.004 Customers 3.108 2.594 0.096 1.198 0.233 Suppliers 2.697 1.897 0.118 1.421 0.157 Competitors -5.212 2.073 -0.216 -2.514 0.013 Others -1.317 1.173 -0.085 -1.123 0.263
Dependent variable: Growth in market share
7.2. The EOE had a significant influence on APF under GMS through external customers as follows:
GMS = 32.866 + 4.467 External Customers (0.004) (0.000)
This implied that a unit marginal change in external customers resulted in an increase of 4.467 units in growth in market share.
Table 2. Origin of Customers and Market Share - Coefficients
Model
Un-standardized
Coefficients Standardized Coefficients t-Value P-Value Beta Standard Error Beta
1
(Constant) 32.866 11.209 2.932 0.004 Local -1.113 2.227 -0.036 -0.500 0.618 External 4.467 0.904 0.383 4.942 0.000 Mixed 0.756 1.202 0.059 0.629 0.530 Unique -1.229 1.117 -0.098 -1.100 0.273 Others -.341 1.499 -0.016 -0.227 0.820
Dependent variable: Market share
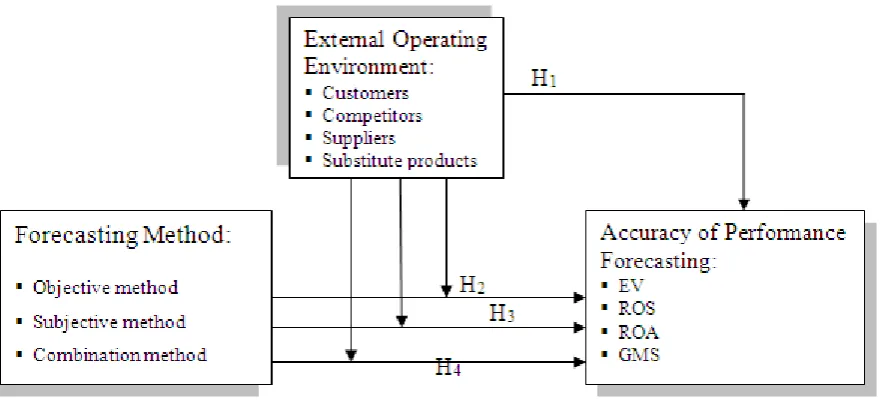
7.3. EOE had a partial influence on APF under ROA through Demographics as follows:
ROA = - 0.425 Demographic Characteristics
(0.015)
[image:5.595.309.552.622.750.2]This implied that a unit marginal change in demographic characteristics resulted in a decline of 0.425 units in return on assets.
Table 3. External Operating Environment – Coefficients
Model
Un-standardized
Coefficients Standardized Coefficients t-Value P-Value Beta Std. Error Beta
1
(Constant) 1.832 1.773 1.033 .303 competitors 0.190 .324 .048 .586 .558 Customers 0.231 .317 .060 .729 .467 Substitutes 0.043 .128 .026 .335 .738 Suppliers 0.001 .046 .002 .028 .978 Demographics -0.425 .172 -.191 -2.469 .015
7.4. EOE had a partial moderating effect on the relationship between Objective Forecasting Technique through ROS as follows:
[image:6.595.310.554.137.297.2]ROS = 11.986 – 1.070 Objective Forecasting Technique (0.001) (0.002) This implied that a unit marginal change in the use of the objective forecasting method resulted in a decline of 1.070 units in return on sales.
Table 4. External Operating Environment – Coefficients
Model
Un-standardized
Coefficients Standardized Coefficients t-Value P-Value Beta Std. Error Beta
1
(Constant) 11.986 3.422 3.502 0.001 Competitors 0.622 0.583 0.087 1.067 0.288 Customers -0.233 0.573 -0.033 -.407 0.684 Substitutes 0.059 0.231 0.019 0.256 0.798 Suppliers -0.086 0.084 -0.079 -1.021 0.309 Demographics 0.150 0.321 0.037 0.468 0.640
Objective
method -1.070 0.337 -0.250 -3.176 0.002 Dependent Variable: ROS
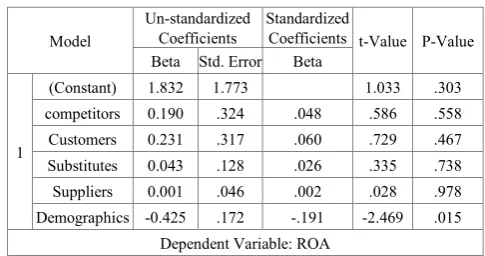
7.5. EOE had a partial moderating effect on the relationship between Objective Forecasting Technique through ROA as follows:
ROA = -0.434 Demographic Characteristics
(0.016)
This implied that a unit marginal change in demographic characteristics resulted in a decline of 0.434 units in return on assets.
Table 5. External Operating Environment – Coefficients
Model
Un-standardized
Coefficients Standardized Coefficients t-Value P-Value Beta Error Std. Beta
1
(Constant) 1.702 1.905 0.894 0.373 Competitors 0.189 0.325 0.048 0.583 0.561 Customers 0.235 0.319 0.061 0.738 0.462 Substitutes 0.043 0.129 0.026 0.334 0.739 Suppliers 0.003 0.047 0.005 0.059 0.953 Demographics -0.434 0.178 -0.195 -2.430 0.016
Objective
method 0.036 0.188 0.015 0.190 0.850 Dependent Variable: ROA
7.6. EOE had a partial moderating effect on the relationship between Judgmental Forecasting Technique through ROA as follows:
ROA = - 0.429 Demographic Characteristics
(0.014)
[image:6.595.56.298.209.368.2]This implied that a unit marginal change in demographic characteristics resulted in a decline of 0.429 units in return on assets.
Table 6. External Operating Environment – Coefficients
Model
Un-standardized
Coefficients Standardized Coefficients t-Value P-Value Beta Std. Error Beta
1
(Constant) 2.379 1.888 1.261 0.209 Competitors 0.184 0.324 0.047 0.568 0.571 Customers 0.221 0.318 0.058 0.696 0.487 Substitutes 0.060 0.130 0.036 0.460 0.646 Suppliers 0.005 0.046 0.009 0.112 0.911 Demographics -0.429 0.172 -0.193 -2.489 0.014
Judgmental
method -0.147 0.172 -0.066 -0.852 0.396 Dependent Variable: ROA
7.7. EOE had a partial moderating effect on the relationship between Combined Forecasting Technique and APF through ROA under Demographics as follows:
ROA = - 0.426 Demographic characteristics.
(0.015)
This implied that a unit marginal change in demographic characteristics resulted in a decline of 0.426 units in return on assets.
Table 7. External Operating Environment – Coefficients
Model
Un-standardized
Coefficients Standardized Coefficients t-Value P-Value Beta Std. Error Beta
1
(Constant) 1.270 1.965 0.646 0.519 Competitors 0.187 0.324 0.048 0.578 0.564 Customers 0.248 0.319 0.065 0.778 0.438 Substitutes 0.041 0.129 0.025 0.319 0.750 Suppliers 0.000 0.046 0.001 0.008 0.994 Demographics -0.426 0.172 -0.191 -2.469 0.015
Combined
method 0.133 0.198 0.051 0.669 0.504 Dependent Variable: ROA
8. Conclusions
Using the selected predictors of APF – EV, ROS, ROA and GMS - as the dependent variables and the various identified independent variables of the EOE, study results indicated that competitors and external customers had a significant influence on GMS, consequently affecting APF. Further, the study revealed that competitors, customers and demographic characteristics had an influence on APF.
[image:6.595.310.553.449.612.2] [image:6.595.59.297.510.676.2]various researchers that EOE has an influence on APF. EOE also impacts a forecasting strategy (FT) a LMF adopts, where EOE was found to have a moderating effect on the relationship between a FT and APF.
Abbreviations and Acronyms
APF = Accuracy of Performance Forecasting GMS = Growth in Market ShareEOE = External Operating Environment LMF = Large Manufacturing Firm EV = Expected Value
ROA = Return on Assets FT = Forecasting Technique ROS = Return on Sales
REFERENCES
[1] Kibera, F. N. (1996). “Introduction to Business: A Kenyan Perspective”. Nairobi, Kenya Literature Bureau.
[2] Wilson, E. (2009): “Know your market”.
[3] Brown, S. (2003): “Marketing to Generation (R), “Harvard Business Review”, (June 2003): 16
[4] Frey, W. H. (2008): “Generational Pull”, American Demographics 24. No. 4 (May 2008): 18
[5] Kaylene, C. W., and Robert, A. P. (2011). “Marketing to the generations.” Journal of Behavioral Studies in Business, 3 (2011): 1 – 17
[6] Levy, P. (2011): “Segmentation by generation.” Marketing News, 45. No. 6 (May 15, 2011): 20 – 23.
[7] Valkeneers, G., and Vanhoomissen, T. (2012): “Generations living their own life. The differences in lifestyle and consumer behavior between busters and baby boomers.” Journal of Customer Behavior, 11 no. 1 (2012): 53 – 68 [8] Porter, M. (1979): How competitive forces shape strategy. [9] Supatn, N. (2010): The Effects of Supplier Relationship and
Negotiation Power on Sourcing Performance: A Case of Fashion Accessories Products.
[10]Vickery, S. K. (2008). The effects of an integrative supply chain strategy on customer service and financial performance: An analysis of direct versus indirect relationships. Journal of Operations Management 21, 523 – 539.
[11]Mattila, H., King, R. and Ojala, N. (2002): Retail Performance Measures for Seasonal Fashion. J Fash, Mark Mag 6(4). 340 – 351.
[12]Fisher, M. and Rajaram, K. (2000), “Accurate Retail Testing of Fashion Merchandise. Methodology and Application,”
Marketing Science, Vol. 19, No. 3, pp. 266-278.
[13]Jackson, T. and Shaw, D. (2001), Fashion Buying and Merchandising Management. Basingstoke: Palgrave.
[14]Jin, B. (2004), “Apparel Industry in East Asian Newly
Industrialized Countries,” Journal of Fashion Marketing Management, Vol. 8, No. 2, pp. 230-244.
[15]Kannan, V. R., and Tan, K. C. (2006): “Buyer-Supplier Relationship – The Impact of Supplier Selection and Buyer-Supplier Engagement on Relationship Performance.” International Journal of Distribution & Logistics Management, Vol. 36, No. 10, pp. 755-775.
[16]Mintzberg, H. (1989). Mintzberg on Management: Inside our Strange World of Organizations. New York: Free Press. [17]Daft, R. L. (2001). Organizational theory and design (7th ed.).
Cincinnati, OH: South-Western.
[18]Mentzer, J. T. and Cox J. E. (1984). Familiarity, applications, and performance of sales forecasting techniques. Journal of Forecasting 3, 27 – 36.
[19]Mentzer, J. T., and Kahn, K. B. (1995). Forecasting Technique Familiarity, Satisfaction, Usage, and Application. Journal of Forecasting, Vol. 14, 465 – 476 (1995).
[20]Makridakis, S., and Hibon, M. (2000): “Time Series Forecasting Competition; and Artificial Neural Network and Computational Intelligence Forecasting Competition”. [21]Hughes, M. C. (2001). Forecasting practice: Organizational
Issues. Journal of the Operational Research Society (2001) Vol. 52, No. 2, pp. 143 – 149.
[22]McCarthy, T. M., et al. (2006): “The Evolution of Forecast Management: A Survey of Forecasting Executives”.
[23]Makridakis, S., and Winkler, R. L. (1983) 146, Part 2, pp. 150 - 157: “The Combination of Forecasts”. Indiana University, USA; Insead, Fontainebleau, France.
[24]Armstrong, J. S., (1988). Bridging the gap between theory and practice in forecasting. International Journal of Forecasting 8(2): 251 – 267. September 1992
[25]DeRoeck, R. (1991). Is there a gap between forecasting theory and practice? A personal view. International Journal of Forecasting, 1991, Vol. 7, Issue 1, pages 1 – 2. January 1991. [26]Mahmoud, E., DeRoeck, R., Brown, R. G., and Rice, G.
(1992). Bridging the gap Between theory and practice in forecasting. Internationla Journal of Forecasting, 8, 251 – 267.
[27]Shultz, R. L. (1992) Editorial: Fundamental aspects of forecasting in organizations, International Journal of Forecasting, 7, 409 – 411.
[28]Winklhofer, H., Diamantopoulos, and Witt, S. F. (1996). “Forecasting Practice: A Review of the Empirical Literature and an Agenda for Future Research”. International Journal of Forecasting 12 (1996), pp. 193-221
[29]Armstrong, J. S. (2001). “Evaluating Forecasting Methods”. Principles of Forecasting: A Handbook for Researchers and Practitioners.
[30]Fildes, R. (2006): “An Evaluation of Bayesian Forecasting”. [31]Davis, D. F., and Mentzer, J. T. (2007): “Organizational
Factors in Sales Forecasting Management”: International Journal of Forecasting (2007) pp. 475-495.
[33]Fahy, J. and Smithee, A. (1999), “Strategic Marketing and the Resource Based View of the Firm”. Academy of Marketing Science Review, Volume 1999, no. 10.
[34]Barney, J. B. (1991), “Firm Resources and Sustained Competitive Advantage”. Journal of Management 17(1): 99 – 120.
[35]Foley, A. and Fahy, J. (2004): “Towards a further understanding of the development of market orientation in the firm: a conceptual framework based on the market-sensing capability”. Journal of Strategic Marketing 12, 219 – 230 (December 2004).
[36]Day, G. S. (1994): “The Capabilities of Market-Driven Organizations”. Journal of Marketing Vol. 58 No. 4 (Oct., 1994), pp. 37 – 52.
[37]Gray, K. R., Cooley, W., Lutabingwa, J. (1997): Small-scale Manufacturing in Kenya: Journal of Small Business Management, Vol. 35, Issue 1, January 1997.
[38]Krejcie, R. V., and Morgan D. W. (1970): Sample Size Determination for “Known” Population Using Krejcie and Morgan Table.