State Expenditure
on Science &
Technology, 2000
THE NATIONAL POLICY AND ADVISORY BOARD FOR ENTERPRISE, TRADE, SCIENCE, TECHNOLOGY AND INNOVATION
Functions of Forfás
Is é Forfás an bord náisiúnta um polasaí agus comhairle le haghaidh fiontraíochta, trádála, eolaíochta, teicneolaíochta agus nuála. Is é an comhlacht é a bhfuil comhactaí dlíthiúla an stáit maidir le cur-chun-cinn tionscail agus forbairt teicneolaíochta dílsithe ann. Is é an comhlacht é freisin trína dciomnaítear cumhachtaí ar Fhiontraíocht Éireann le tionscail dúchais a chur chus cinn agus ar ghníomhaireacht Forbartha Tionscail na hÉireann (GFT Éireann) le
hinfheistíocht isteach sa tir a chur chun tosaight. Is iad feighmeanna Fhorfáis:
comhairle a chur ar an Aire ó thaobh cúrsaí a bhaineann le forbairt tionscail sa Stát
comhairle maidir le forbairt agus comhordú polasaithe a chur ar fáil d’Fhiontraíocht Éireann, d’GFT Éireann agus d’aon fhoras eile dá leithéid (a bunaíodh go reachtúil) a d’fhéadfadh an tAire a ainmniú trí ordú
forbairt na tionsclaíochta, na teicneolaíochta, na
margaíochta agus acmhainní daonna a spreagadh sa Stát bunú agus forbairt gnóthas tionsclaíoch ón iasacht a spreagadh sa Stát, agus
Fiontraíocht Éireann agus GFT Éireann a chomhairliú agus a chomhordú ó thaobh a gcuid feidhmeanna.
Forfás is the national policy and advisory board for enterprise, trade, science, technology and innovation. It is the body in which the State’s legal powers for industrial promotion and technology development have been vested. It is also the body through which powers are delegated to Enterprise Ireland for the promotion of indigenous industry and to IDA Ireland for the promotion of inward investment. The broad functions of Forfás are to:
advise the Minister on matters relating to the development of industry in the State
to advise on the development and co-ordination of policy for Enterprise Ireland, IDA Ireland and such other bodies (established by or under statute) as the Minister may by order designate
encourage the development of industry, technology, marketing and human resources in the State
encourage the establishment and development in the State of industrial undertakings from outside the State, and
advise and co-ordinate Enterprise Ireland and IDA Ireland in relation to their functions.
Board Members
Peter Cassells Chairman
Sean Dorgan Chief Executive,
IDA Ireland
Dan Flinter Chief Executive,
Enterprise Ireland
Paul Haran Secretary General,
Department of Enterprise, Trade & Employment
Professor Michael Hillery Chair of Manufacturing Engineering,
University of Limerick
Rody Molloy Director General, FÁS
William Murphy Partner, Tynan Dillon and Company
Feargal O’Rourke Partner, Taxation, PricewaterhouseCoopers
Professor Yvonne Scannell Faculty of Law, Trinity College
John Travers Chief Executive, Forfás
Toni Wall Managing Director,
Wall-2-Wall Ltd
Jane Williams Managing Director,
3
State Expenditure
on Science &
Technology, 2000
Science and
Technology Budget
Review of State Expenditure on Science and Technology 1990-2000
Incorporating financial expenditures in 1999 and allocations for 2000 by Government to Institutions engaged in any activity related to science and technology.
Evaluation and Indicators Unit
5
Table of Contents
1 EXECUTIVE SUMMARY 4
2 INTRODUCTION 5
2.1 Research proposals in the National Development Plan (2000 -2006) 5
2.2 Technology Foresight Initiative 5
2.3 Infrastructure - The Programme for Research in the Third-level Institutes 5
2.4 Science and Technology Budget 2000 5
3 TOTAL GOVERNMENT FUNDING OF SCIENCE AND TECHNOLOGY 7
3.1 Total Funding and Trends 7
3.2 Funding by Type of Cost 9
3.3 Comparison with GDP and Total Government Budgets 10
3.4 Government Departments/Agencies funding science and technology 11
3.5 Funding by activity 17
3.6 Public Funding Trends by objective 17
3.7 Matrix of Science & Technology funding sources 20
3.8 Transfer payments between Departments/Agencies 20
4 SCIENCE AND TECHNOLOGY FOR THE PRODUCTIVE SECTORS 24
4.1 Industry 24
4.2 Agriculture 27
4.3 Environment 28
4.4 Marine and Forestry 29
4.5 Energy 31
4.6 Transportation 32
5 EDUCATION AND HEALTH ACTIVITIES 32 6 GENERAL PUBLIC SERVICE ACTIVITIES 35 7 ECONOMIC AND SOCIAL ACTIVITIES 38
1
Executive Summary
Volume 1: Total Science and Technology Budget
The ‘Science and Technology Budget’ – the annual Forfás publication on State expenditure on science and technology – provides details of the allocations made by Government to scientific and technological (S&T) activities. In all, 42 government departments/agencies are included in the 2000 S&T Budget.
The total value of the Science and Technology Budget in 2000 amounts to £1,100m (€1,396.7m), an increase of £187.4m (€237.9m) or 20.5% over the 1999 level. All of the increase is accounted for by public funds, which rose from £749m (€951m) outturn in 1999 to an allocation of £934m (€1185.9m) in 2000; the balance of £166m (€210.8m) arises from income earned from the activities of the departments and agencies.
While the total figure is large, the coverage of the Science and Technology Budget is very wide and includes S&T-based activities such as those of Met Éireann, Geological Survey and some elements of the Office of Public Works.
Volume 2: Research and Development in the Public Sector
For the first time this year’s ‘State Expenditure on Science and Technology’ includes a separate volume on research and development. Altogether Research and Development represents about a quarter of public science and technology expenditure.
The level of R&D performed in the various Government Departments and their agencies is not the same as the total amounts they fund. An individual Department or its agencies might perform little or no R&D themselves while providing funding to other performers in either the public or private sectors.
In terms of public funding, the Departments and their agencies are allocating £232.9m (€295.7m) to R&D in 2000. This represents a very significant increase over the actual expenditure in 1999 of £147.7m (€187.5m). The major increases relate to additional allocations by the Department of Education and Science via the Higher Education Authority (£31m (€39.4m)) for research in the third level institutions, to the new Technology Foresight Fund (£25m, €31.7m) introduced by the Department of Enterprise, Trade and Employment (DETE) to establish Ireland as a leading research player in biotechnology and information and communications technologies, and to extra funding by DETE via Enterprise Ireland (£14m (€17.8m)) for R&D grants to industry.
7
2
Introduction
The last few years have seen an unprecedented reappraisal of Irish science, technology and
education policies. The Irish Government accepts that there is a direct link between the expenditure on research and economic return. The Government has responded with ambitious plans in the third-level system and the industrial sector over the period 2000 – 2006. These are outlined below:
2.1
Research proposals in the National Development Plan (2000 -2006)
The National Development Plan was published in November 1999. It sets out a course of initiatives and programmes aimed at ensuring continued economic prosperity for Ireland. A cornerstone of the plan is to establish Ireland as a knowledge-based economy. The Government has allocated £1.9 billion (€2.41 billion) to Research, Technological Development and Innovation (RTDI) over the course of the plan.
2.2
Technology Foresight Initiative
A key element of the National Development Plan in terms of support for R&D is the Technology Foresight Fund. This Fund was born of a Technology Foresight exercise that identified a gap in Ireland’s research base. The Technology Foresight Report, prepared by the Irish Council for Science, Technology and Innovation (ICSTI), recommended that a fund be established totalling £500 million (€634.9m) over five years to support research projects in key technologies strategic to long-term sectoral and national development. The Department of Enterprise, Trade and Employment subsequently allocated over £500m (€634.9m) to this Fund over the lifetime of the National Development Plan and established Science Foundation Ireland to implement the Fund.
2.3
Infrastructure - The Programme for Research in the Third-level Institutes
The Department of Education and Science launched its Programme for Research in Third Level Institutions in late 1998 and about £550m (€698.4m) is included in the National Development Plan for further investments to strengthen the research capabilities of the third level colleges.
2.4
Science and Technology Budget 2000
Changes have been made to the ‘Science & Technology Budget’ – the annual Forfás publication on State Expenditure on Science and Technology – to reflect the new situation. The changes are not radical ones but they have been made in response to some of the work of ICSTI on public expenditure priorities. For the most part the changes are to the way in which the data are presented, giving greater prominence and emphasis than in the past to research and development. Arising from the greater visibility of, and interest in, the S&T Budget a number of Government Departments have requested changes in the coverage of the data relating to their activities. As far as possible, without too great an impact on the long-established time series of S&T Budget data, those requests have been complied with.
This document provides details of the allocations made by Government to scientific and
technological (S&T) activities. In all, 43 government departments/agencies are included in the 2000 S&T Budget. The information on which the analysis is based was supplied by government
departments, offices, agencies and other recipient institutions following finalisation of the overall government estimates for the public services for 2000, and after the operating institutions had decided on the distribution of their allocations over their programmes.
Figure 1 Government Departments/Agencies Funding S&T, 2000
DEPARTMENTS AGENCY DEPARTMENTS AGENCY
Agriculture & Food Teagasc Education & Science HEA
DIAS
Enterprise, Trade & Employment Forfás Environment & EPA
Enterprise Ireland Local Government NRA
IDA Ireland
NMRC Social, Community
Patents Office and Family Affairs
NMAC
FÁS
Innovation Centre Arts, Heritage, Údarás na
NSAI Gaeltacht and the Gaeltachta
Islands Natural History
Museum
Public Enterprise GSI Health & Children HRB
RPII Postgraduate
Met Éireann Medical & Dental
Board
Marine & Natural Resources Marine Institute Taoiseach NESC
BIM
Central Fisheries
Board
COFORD
OFFICES CSO OPW Central Bank State Laboratory Ordnance Survey
INCORPORATED COMPANIES ESRI Shannon Development
See appendix 2 for explanation of acronyms.
Section 2 brings together the total S&T picture for the public sector, including non-exchequer monies – mainly fees and other earned income – of institutions which operate science and technology programmes.
9
3
Total Government Funding of
Science and Technology
3.1
Total Funding and Trends
The total public expenditure on science and technology occurs under five broad headings: Research and Development activities (as detailed in Volume Two of this report)
Other S&T activities in support of industry, agriculture and food, the environment, marine and forestry, energy and transportation
Education and health Other public service activities Economic and social activities
The total of these five components constitutes the State Investment in Science and Technology for 2000 (the ’Science and Technology Budget’). Funding for these activities come from three sources – the exchequer, the Community Support Framework (CSF) of the EU, and income earned by the agencies/departments implementing science and technology programmes.
The total value of the science and technology budget in 2000 amounts to £1,100m (€1,396.7m) and Table 1 identifies the sources of funding for 1990, 1995, 1999 and 2000.
Table 1:
Government funding of Science and Technology by source of funds,
current prices
1990 Outturn 1995 Outturn 1999 Outturn 2000 Allocation
£m % £m % £m % £m %
Exchequer funds 226.13 65% 377.85 63% 637.44 70% 827.34 75%
CSF Contribution 28.05 8% 72.76 12% 111.53 12% 106.73 10%
Total public funds 254.18 73% 450.61 75% 748.97 82% 934.07 85%
Earned income 94.10 27% 151.25 25% 164.16 18% 166.43 15%
Table 1A:
Government funding of Science and Technology by source of funds,
current prices
1990 Outturn 1995 Outturn 1999 Outturn 2000 Allocation
€m % €m % €m % €m %
Exchequer funds 287.13 65% 479.77 63% 809.38 70% 1,050.51 75%
CSF Contribution 35.62 8% 92.39 12% 141.61 12% 135.52 10%
Total public funds 322.75 73% 572.16 75% 950.99 82% 1,186.03 85%
Earned income 119.48 27% 192.05 25% 208.44 18% 211.32 15%
Total 442.23 100% 764.21 100% 1,159.43 100% 1,397.35 100%
There was an increase of £187.4m (€237.9m), or 20.5% in the Total ‘Science and Technology Budget’ over the 1999 level. Increased Exchequer funding amounted to £189.9m (€241.1m), with earned income remaining relatively constant and the EU contribution expected to decline. The major increases occurred in the following four areas:
1. Institutes of Technology/Dublin Institute of Technology grants administered by the Department of Education (£65m, €82.5m)
2. Programme for Research in Third Level Institutions administered by the Higher Education Authority (£30m, €38.1m)
3. The implementation of the Technology Foresight Fund via Science Foundation Ireland (£25m, €31.7m)
4. Support for industry administered by Enterprise Ireland for the Office of Science and Technology (£17m, €21.6m)
5. National Beef Assurance Scheme administered by the Department of Agriculture, Food and Rural Development (£8m, €10.2m)
11
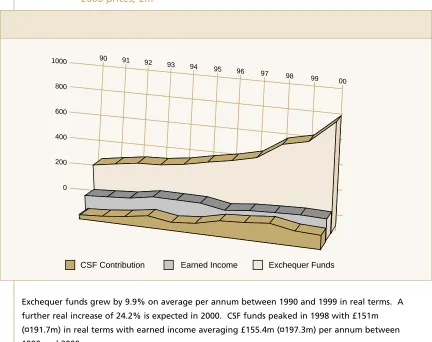
[image:11.595.93.525.121.463.2]Figure 2 illustrates the trends in funding in the recent past.
Figure 2:
Distribution of Government supported S&T by source of funds,
2000 prices, £m
Exchequer funds grew by 9.9% on average per annum between 1990 and 1999 in real terms. A further real increase of 24.2% is expected in 2000. CSF funds peaked in 1998 with £151m (¤191.7m) in real terms with earned income averaging £155.4m (¤197.3m) per annum between 1990 and 2000.
3.2
Funding by Type of Cost
Table 2:
Government funding of Science and Technology by type of costs,
current prices
1990 1995 1999 2000 Allocation
£m % £m % £m % £m %
Public current monies* 234.33 67% 424.54 71% 625.96 69% 753.49 68%
Public capital monies 19.85 6% 26.06 4% 123.01 13% 180.58 16%
Total public funds 254.18 73% 450.60 75% 748.97 82% 934.07 85%
Earned income 94.10 27% 151.25 25% 164.16 18% 166.43 15%
Total 348.28 100% 601.85 100% 913.13 100% 1,100.50 100%
* Public monies are exchequer plus CSF funds
1000
800
600
400
200
0
90 91
92 93
94 95
96 97
98 99
00
Table 2A:
Government funding of Science and Technology by type of costs,
current prices
1990 1995 1999 2000 Allocation
€m % €m % €m % €m %
Public current monies* 297.54 67% 539.05 71% 794.81 69% 956.73 68%
Public capital monies 25.20 6% 33.09 4% 156.19 13% 229.29 16%
Total public funds 322.74 73% 572.14 75% 951.00 82% 1,186.02 84%
Earned income 119.48 27% 192.05 25% 208.44 18% 211.32 16%
Total 442.22 100% 764.19 100% 1,159.44 100% 1,397.34 100%
* Public monies are exchequer plus CSF funds
Table 2 shows a significant increase in public capital monies since 1999 from £123m (¤156.2m) to £181m (¤229.8m), and more dramatically since 1995 from £26m (¤33m). These increases are due to the increased investment by the Department of Education & Science in upgrading the capital infrastructure of the third level institutes.
3.3
Comparison with GDP and Total Government Budgets
[image:12.595.86.525.498.749.2]Public funding for S&T as a percentage of total government budgets shows a steady increase since 1990 (2.5%) to reach 4.4% in 2000 (Figure 3). This positive trend reflects the government’s increasing commitment to science and technology. Public funds for S&T as a percentage of GDP has remained at 1.1% on average over the last ten years.
Figure 3
Public funding of S&T* : % Government budget, % GDP 1990-2000
*Exchequer plus CSF 5.0%
4.0%
3.0%
2.0%
1.0%
0.0%
1990 1991 1992 1993
1994 1995
1996 1997
1998 1999 2000
13
3.4
Government Departments/Agencies funding Science and Technology
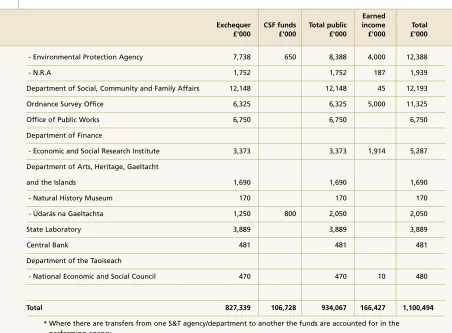
Table 3 presents each Department/Agencies allocation to S&T analysed by source of funds. Some agency programmes are extremely reliant on non-exchequer sources for their income in the form of CSF funds and earned income while others are funded entirely from exchequer sources. The agencies which receive most CSF support are the Department of Education and Science, the Higher Education Authority, Enterprise Ireland, FÁS, IDA Ireland, Shannon Development, Teagasc, the Department of Agriculture and Food and the NMRC. The NSAI and the Patents Office are more reliant on earned income to fund their S&T expenditure.
Table 3:
2000 Science and Technology Allocation to Departments/Agencies by
source of funds
Earned
Exchequer CSF funds Total public income Total
£'000 £'000 £'000 £'000 £'000
Department of Education and Science 293,555 18,745 312,300 312,300
- Higher Education Authority 266,282 10,815 277,097 82,110 359,207
- Dublin Institute for Advanced Studies 1,815 38 1,853 335 2,188
Department of Enterprise, Trade & Employment 5,933 484 6,417 6,417
- Enterprise Ireland 19,671 45,068 64,739 12,023 76,762
- FÁS 16,620 12,810 29,430 29,430
- National Microelectronics Research Centre 4,571 1,978 6,549 5,304 11,853
- N.S.A.I 2,535 2,535 8,326 10,861
- Shannon Development 3,310 4,000 7,310 7,310
- IDA Ireland 50 4,000 4,050 4,050
- Patents Office -2,434 -2,434 5,332 2,898
- Forfás (inc. NAB) 26,362 26,362 235 26,597
- Innovation Centre 495 270 765 765
- National Microelectronics Applications Centre 610 610
Department of Agriculture and Food 29,620 1,967 31,587 6,220 37,807
- Teagasc 37,826 2,815 40,641 17,741 58,382
Department of Health and Children 6,529 6,529 4,966 11,495
- Health Research Board 9,595 9,595 1,765 11,360
- Postgraduate Medical & Dental Board 2,857 2,857 2,857
Central Statistics Office 22,056 22,056 1,370 23,426
Department of Marine and Natural Resources 1,346 1,346 237 1,583
- Marine Institute 13,038 639 13,677 2,057 15,734
- Bord Iascaigh Mhara 1,334 1,095 2,429 55 2,484
- Central & Regional Fisheries Board 1,200 1,200 1,200
- COFORD 565 554 1,119 1,119
Department of Public Enterprise
- Geological Survey of Ireland 6,888 6,888 210 7,098
- Met Éireann 6,707 6,707 5,660 12,367
- Radiological Protection Institute of Ireland 1,490 1,490 715 2,205
Table 3:
2000 Science and Technology Allocation to Departments/Agencies by
source of funds
Earned
Exchequer CSF funds Total public income Total
£'000 £'000 £'000 £'000 £'000
- Environmental Protection Agency 7,738 650 8,388 4,000 12,388
- N.R.A 1,752 1,752 187 1,939
Department of Social, Community and Family Affairs 12,148 12,148 45 12,193
Ordnance Survey Office 6,325 6,325 5,000 11,325
Office of Public Works 6,750 6,750 6,750
Department of Finance
- Economic and Social Research Institute 3,373 3,373 1,914 5,287
Department of Arts, Heritage, Gaeltacht
and the Islands 1,690 1,690 1,690
- Natural History Museum 170 170 170
- Údarás na Gaeltachta 1,250 800 2,050 2,050
State Laboratory 3,889 3,889 3,889
Central Bank 481 481 481
Department of the Taoiseach
- National Economic and Social Council 470 470 10 480
Total 827,339 106,728 934,067 166,427 1,100,494
* Where there are transfers from one S&T agency/department to another the funds are accounted for in the performing agency.
Note: Earned income assigned to the Higher Education Authority refers to funds which the colleges
[image:14.595.88.540.100.433.2]under its aegis receive by way of fees for education courses and income generated from contract research activity. These funds are not allocated by the HEA to colleges.
Table 3A:
2000 Science and Technology Allocation to Departments/Agencies by
source of funds
Earned
Exchequer CSF funds Total public income Total
€'000 €'000 €'000 €'000 €'000
Department of Education and Science 372,738 23,801 396,539 396,539
- Higher Education Authority 338,108 13,732 351,840 104,258 456,098
- Dublin Institute for Advanced Studies 2,305 48 2,353 425 2,778
Department of Enterprise, Trade & Employment 7,533 614 8,147 8,147
- Enterprise Ireland 24,977 57,225 82,202 15,266 97,468
- FÁS 21,103 16,265 37,368 37,368
- National Microelectronics Research Centre 5,804 2,512 8,316 6,735 15,051
- N.S.A.I 3,219 3,219 10,572 13,791
- Shannon Development 4,203 5,079 9,282 9,282
- I.D.A Ireland 63 5,079 5,142 5,142
- Patents Office -3,091 -3,091 6,770 3,679
15
Table 3A:
2000 Science and Technology Allocation to Departments/Agencies by
source of funds
Earned
Exchequer CSF funds Total public income Total
€'000 €'000 €'000 €'000 €'000
- National Microelectronics Applications Centre 775 775
Department of Agriculture and Food 37,610 2,498 40,108 7,898 48,006
- Teagasc 48,029 3,574 51,603 22,526 74,129
Department of Health and Children 8,290 8,290 6,306 14,596
- Health Research Board 12,183 12,183 2,241 14,424
- Postgraduate Medical & Dental Board 3,628 3,628 3,628
Central Statistics Office 28,005 28,005 1,740 29,745
Department of Marine and Natural Resources 1,709 1,709 301 2,010
- Marine Institute 16,555 811 17,366 2,612 19,978
- Bord Iascaigh Mhara 1,694 1,390 3,084 70 3,154
- Central & Regional Fisheries Board 1,524 1,524 1,524
- COFORD 717 703 1,420 1,420
Department of Public Enterprise
- Geological Survey of Ireland 8,746 8,746 267 9,013
- Met Éireann 8,516 8,516 7,187 15,703
- Radiological Protection Institute of Ireland 1,892 1,892 908 2,800
Department of Environment and Local Government 1,889 1,889 1,889
- Environmental Protection Agency 9,825 825 10,650 5,079 15,729
- N.R.A 2,225 2,225 237 2,462
Department of Social, Community and Family Affairs 15,425 15,425 57 15,482
Ordnance Survey Office 8,031 8,031 6,349 14,380
Office of Public Works 8,571 8,571 8,571
Department of Finance
- Economic and Social Research Institute 4,283 4,283 2,430 6,713
Department of Arts, Heritage, Gaeltacht
and the Islands 2,146 2,146 2,146
- Natural History Museum 216 216 216
- Údaras na Gaeltachta 1,587 1,016 2,603 2,603
State Laboratory 4,938 4,938 4,938
Central Bank 611 611 611
Department of the Taoiseach
- National Economic and Social Council 597 597 13 610
Total 1,050,504 135,517 1,186,020 211,319 1,397,339
* Where there are transfers from one S&T agency/department to another the funds are accounted for in the performing agency.
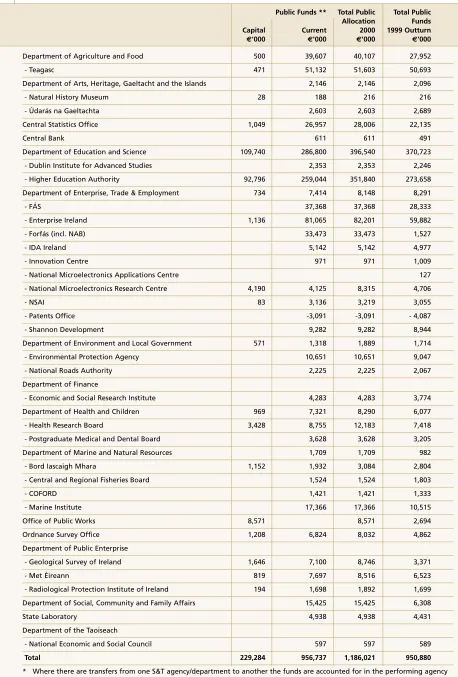
Tables 4 analyses the breakdown of the increase in 2000 over 1999. The total increase in public funds over the 1999 outturn amounts to £185.1m (€235m). An increase of over £80m (€101.6m) is noted for the Department of Education and Science over 1999 figures, the majority of this funding has been allocated via the Higher Education Authority for research in third level institutions. Another significant increase over 1999 funding is seen in the Department of Enterprise, Trade and Employment where an extra £53.7m (€68.2m) has been allocated to fund science and technology based activities in 2000. Table 5 gives a breakdown between current and capital costs.
Table 4:
2000 Total Increase on 1999 Public Funding by Department, £’000
Increase in Funding over 1999
£’000
Department of Education and Science 81,990
Department of Enterprise, Trade and Employment 53,763
Department of Agriculture and Food 10,290
Department of Social, Community and Family Affairs 7,180
Department of the Marine and Natural Resources 6,039
Department of Public Enterprise 5,955
Department of Health and Children 5,829
Office of Public Works 4,628
Central Statistics Office 4,623
Ordnance Survey Office 2,496
Department of the Environment and Local Government 1,525
Department of Finance 400
State Laboratory 399
Central Bank 94
Department of the Taoiseach 6
Department of Arts, Heritage, Gaeltacht and the Islands - 29
Total 185,188
Table 4A:
2000 Total Increase on 1999 Public Funding by Department,
€
’000
Increase in Funding over 1999
€’000 Department of Education and Science 104,106
Department of Enterprise, Trade and Employment 68,265
Department of Agriculture and Food 13,066
Department of Social, Community and Family Affairs 9,117
Department of the Marine and Natural Resources 7,668
Department of Public Enterprise 7,561
Department of Health and Children 7,401
Office of Public Works 5,876
Central Statistics Office 5,870
Ordnance Survey Office 3,169
Department of the Environment and Local Government 1,936
Department of Finance 508
State Laboratory 506
Central Bank 119
Department of the Taoiseach 8
17
Table 5:
2000 Science and Technology Allocation to Agencies/Departments (*)
by type of costs
Public Funds ** Total Public Total Public
Allocation Funds
Capital Current 2000 1999 Outturn
£'000 £'000 £'000 £'000
Department of Agriculture and Food 394 31,193 31,587 22,014
- Teagasc 371 40,270 40,641 39,924
Department of Arts, Heritage, Gaeltacht and the Islands 1,690 1,690 1,651
- Natural History Museum 22 148 170 170
- Údaras na Gaeltachta 2,050 2,050 2,118
Central Statistics Office 826 21,230 22,056 17,433
Central Bank 481 481 387
Department of Education and Science 86,427 225,873 312,300 291,968
- Dublin Institute for Advanced Studies 1,853 1,853 1,769
- Higher Education Authority 73,083 204,014 277,097 215,523
Department of Enterprise, Trade & Employment 578 5,839 6,417 6,530
- FÁS 29,430 29,430 22,314
- Enterprise Ireland 895 63,844 64,739 47,161
- Forfás (incl. NAB) 26,362 26,362 1,203
- IDA Ireland 4,050 4,050 3,920
- Innovation Centre 765 765 795
- National Microelectronics Applications Centre 100
- National Microelectronics Research Centre 3,300 3,249 6,549 3,706
- NSAI 65 2,470 2,535 2,406
- Patents Office -2,434 -2,434 - 3,219
- Shannon Development 7,310 7,310 7,044
Department of Environment and Local Government 450 1,038 1,488 1,350
- Environmental Protection Agency 8,388 8,388 7,125
- National Roads Authority 1,752 1,752 1,628
Department of Finance
- Economic and Social Research Institute 3,373 3,373 2,972
Department of Health and Children 763 5,766 6,529 4,786
- Health Research Board 2,700 6,895 9,595 5,842
- Postgraduate Medical and Dental Board 2,857 2,857 2,524
Department of Marine and Natural Resources 1,346 1,346 773
- Bord Iascaigh Mhara 907 1,522 2,429 2,208
- Central and Regional Fisheries Board 1,200 1,200 1,420
- COFORD 1,119 1,119 1,050
- Marine Institute 13,677 13,677 8,281
Office of Public Works 6,750 6,750 2,122
Ordnance Survey Office 951 5,374 6,325 3,829
Department of Public Enterprise
- Geological Survey of Ireland 1,296 5,592 6,888 2,655
- Met Éireann 645 6,062 6,707 5,137
- Radiological Protection Institute of Ireland 153 1,337 1,490 1,338
Department of Social, Community and Family Affairs 12,148 12,148 4,968
State Laboratory 3,889 3,889 3,490
Department of the Taoiseach
- National Economic and Social Council 470 470 464
Total 180,576 753,492 934,068 748,879
* Where there are transfers from one S&T agency/department to another the funds are accounted for in the performing agency
Table 5A:
2000 Science and Technology Allocation to Agencies/Departments (*) by
type of costs
Public Funds ** Total Public Total Public
Allocation Funds
Capital Current 2000 1999 Outturn
€'000 €'000 €'000 €'000
Department of Agriculture and Food 500 39,607 40,107 27,952
- Teagasc 471 51,132 51,603 50,693
Department of Arts, Heritage, Gaeltacht and the Islands 2,146 2,146 2,096
- Natural History Museum 28 188 216 216
- Údarás na Gaeltachta 2,603 2,603 2,689
Central Statistics Office 1,049 26,957 28,006 22,135
Central Bank 611 611 491
Department of Education and Science 109,740 286,800 396,540 370,723
- Dublin Institute for Advanced Studies 2,353 2,353 2,246
- Higher Education Authority 92,796 259,044 351,840 273,658
Department of Enterprise, Trade & Employment 734 7,414 8,148 8,291
- FÁS 37,368 37,368 28,333
- Enterprise Ireland 1,136 81,065 82,201 59,882
- Forfás (incl. NAB) 33,473 33,473 1,527
- IDA Ireland 5,142 5,142 4,977
- Innovation Centre 971 971 1,009
- National Microelectronics Applications Centre 127
- National Microelectronics Research Centre 4,190 4,125 8,315 4,706
- NSAI 83 3,136 3,219 3,055
- Patents Office -3,091 -3,091 - 4,087
- Shannon Development 9,282 9,282 8,944
Department of Environment and Local Government 571 1,318 1,889 1,714
- Environmental Protection Agency 10,651 10,651 9,047
- National Roads Authority 2,225 2,225 2,067
Department of Finance
- Economic and Social Research Institute 4,283 4,283 3,774
Department of Health and Children 969 7,321 8,290 6,077
- Health Research Board 3,428 8,755 12,183 7,418
- Postgraduate Medical and Dental Board 3,628 3,628 3,205
Department of Marine and Natural Resources 1,709 1,709 982
- Bord Iascaigh Mhara 1,152 1,932 3,084 2,804
- Central and Regional Fisheries Board 1,524 1,524 1,803
- COFORD 1,421 1,421 1,333
- Marine Institute 17,366 17,366 10,515
Office of Public Works 8,571 8,571 2,694
Ordnance Survey Office 1,208 6,824 8,032 4,862
Department of Public Enterprise
- Geological Survey of Ireland 1,646 7,100 8,746 3,371
- Met Éireann 819 7,697 8,516 6,523
- Radiological Protection Institute of Ireland 194 1,698 1,892 1,699
Department of Social, Community and Family Affairs 15,425 15,425 6,308
State Laboratory 4,938 4,938 4,431
Department of the Taoiseach
- National Economic and Social Council 597 597 589
Total 229,284 956,737 1,186,021 950,880
19
3.5
Funding by activity
Expenditure on the different S&T activities has been detailed in the previous sections. Figure 4 illustrates how funding of S&T is distributed across the range of activities in 2000, both public and private funds. Education and training accounts for 48% (£528.2m, €670.7m) of the total and research and development accounting for 26% (£290.4m, €368.9m), an increase in real terms of £74.8m (€95m) over 1999.
[image:19.595.333.551.94.289.2]Figure 5 illustrates the trend in activity funding over time. Education and training has shown an increase from the 1990 level of its percentage of the total expenditure (42%) and research and development has also increased from its share in 1990 (23%).
Figure 5 Funding of S&T activities (including earned income) 2000 prices, £m
3.6
Public Funding Trends by Objective
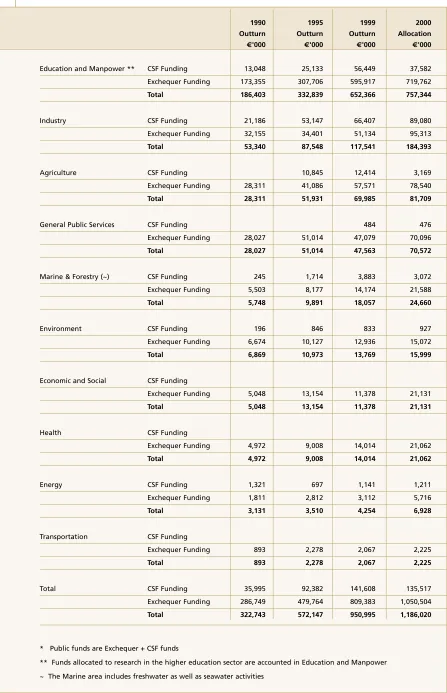
Table 6 examines how the different objectives have been funded since 1990.
It can be seen from this table that there has been a significant increase of over £670m (€850.1m) in public expenditure on science and technology since 1990. The areas of Education and Manpower, Marine and Forestry, Economic and Social, and Health have been the main beneficiaries where the increase over 1990 funding has been four-fold. Industry has had an increase of over £100m (€127m) in funding over the past decade, mainly due to considerable support from the CSF as well as increased exchequer funding.
Education and Manpower have received the majority of their increase in funds from the Exchequer, gaining over £430m (€545.9m) on 1990 funding. A significant increase from the Exchequer is also seen in Agriculture and Marine and Forestry, but perhaps more notable in these cases is the fact that the CSF have allocated funding to these areas in comparison with 1990 where almost all funding came from the Exchequer.
Figure 4: 2000 Distribution of S&T funding by S&T activity (including earned income)
Technology Transfer
0.4% Other S & T
7.1%
Education & Training
48%
R & D 26.4%
Information 5.2%
Technical Services 12.9%
Other Activities
Technology Transfer
Education and Training
Technical Services
Information and Advisory Services
[image:19.595.86.547.338.594.2]Table 6:
Public expenditure on science and technology by objective, current prices *
1990 1995 1999 2000
Outturn Outturn Outturn Allocation
£'000 £'000 £'000 £'000
Education and Manpower ** CSF Funding 10,276 19,794 44,457 29,598
Exchequer Funding 136,528 242,338 469,323 566,859
Total 146,804 262,132 513,780 596,457
Industry CSF Funding 16,685 41,857 52,300 70,156
Exchequer Funding 25,324 27,093 40,271 75,065
Total 42,009 68,950 92,571 145,221
Agriculture CSF Funding 8,541 9,777 2,496
Exchequer Funding 22,297 32,358 45,341 61,855
Total 22,297 40,899 55,118 64,351
General Public Services CSF Funding 381 375
Exchequer Funding 22,073 40,177 37,078 55,205
Total 22,073 40,177 37,459 55,580
Marine & Forestry (~) CSF Funding 193 1,350 3,058 2,419
Exchequer Funding 4,334 6,440 11,163 17,002
Total 4,527 7,790 14,221 19,421
Environment CSF Funding 154 666 656 730
Exchequer Funding 5,256 7,976 10,188 11,870
Total 5,410 8,642 10,844 12,600
Economic and Social CSF Funding
Exchequer Funding 3,976 10,360 8,961 16,642
Total 3,976 10,360 8,961 16,642
Health CSF Funding
Exchequer Funding 3,916 7,094 11,037 16,588
Total 3,916 7,094 11,037 16,588
Energy CSF Funding 1,040 549 899 954
Exchequer Funding 1,426 2,215 2,451 4,502
Total 2,466 2,764 3,350 5,456
Transportation CSF Funding
Exchequer Funding 703 1,794 1,628 1,752
Total 703 1,794 1,628 1,752
Total CSF Funding 28,348 72,757 111,528 106,728
Exchequer Funding 225,833 377,845 637,441 827,339
Total 254,181 450,602 748,969 934,067
* Public funds are Exchequer + CSF funds
** Funds allocated to research in the higher education sector are accounted in Education and Manpower
21
Table 6A: Public expenditure on science and technology by objective, current prices *
1990 1995 1999 2000
Outturn Outturn Outturn Allocation
€'000 €'000 €'000 €'000
Education and Manpower ** CSF Funding 13,048 25,133 56,449 37,582
Exchequer Funding 173,355 307,706 595,917 719,762
Total 186,403 332,839 652,366 757,344
Industry CSF Funding 21,186 53,147 66,407 89,080
Exchequer Funding 32,155 34,401 51,134 95,313
Total 53,340 87,548 117,541 184,393
Agriculture CSF Funding 10,845 12,414 3,169
Exchequer Funding 28,311 41,086 57,571 78,540
Total 28,311 51,931 69,985 81,709
General Public Services CSF Funding 484 476
Exchequer Funding 28,027 51,014 47,079 70,096
Total 28,027 51,014 47,563 70,572
Marine & Forestry (~) CSF Funding 245 1,714 3,883 3,072
Exchequer Funding 5,503 8,177 14,174 21,588
Total 5,748 9,891 18,057 24,660
Environment CSF Funding 196 846 833 927
Exchequer Funding 6,674 10,127 12,936 15,072
Total 6,869 10,973 13,769 15,999
Economic and Social CSF Funding
Exchequer Funding 5,048 13,154 11,378 21,131
Total 5,048 13,154 11,378 21,131
Health CSF Funding
Exchequer Funding 4,972 9,008 14,014 21,062
Total 4,972 9,008 14,014 21,062
Energy CSF Funding 1,321 697 1,141 1,211
Exchequer Funding 1,811 2,812 3,112 5,716
Total 3,131 3,510 4,254 6,928
Transportation CSF Funding
Exchequer Funding 893 2,278 2,067 2,225
Total 893 2,278 2,067 2,225
Total CSF Funding 35,995 92,382 141,608 135,517
Exchequer Funding 286,749 479,764 809,383 1,050,504
Total 322,743 572,147 950,995 1,186,020
* Public funds are Exchequer + CSF funds
** Funds allocated to research in the higher education sector are accounted in Education and Manpower
[image:21.595.92.539.84.777.2]3.7
Matrix of Science & Technology funding sources
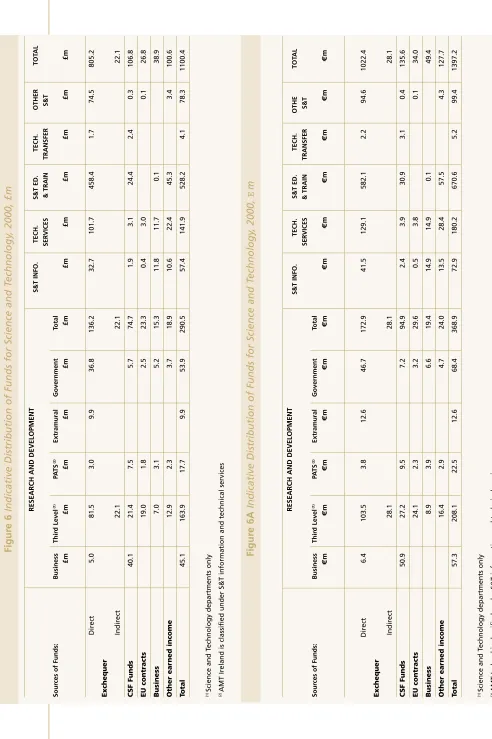
Figure 6 illustrates the funding sources for all S&T activities comprising the science and technology budget.
This Figure identifies the sectors in receipt of Government funds for research and development. Indirect government funds for research in the third level sector is derived from the HEA’s grant-in-aid to academic departments in the universities. In 2000 it is an estimated £22.1m (€28.1m) compared to the direct public (exchequer and CSF funds) funding of research in all third level colleges which amounts to £102.9m (€130.7m). The business sector also provides funds for research in the third level sector and the figures quoted here refer to business funds, which match public funds for joint third level-industry research.
CSF funds are allocated to support R&D in the business sector to the value of £40.1m (€50.9m) compared to direct exchequer support of £5.0m (€6.4m). Income from other sources for research is indicated. Receipts from EU contracts and business account for 18% of the direct funds for research in third level colleges.
3.8
Transfer payments between Departments/Agencies
23 S&T INFO. TECH. S&T ED. TECH. OTHER TOT AL SER
VICES & TRAIN
TRANSFER
S&T
Sour
ces of Funds:
Business Thir d Level (1) PA T S (2) Extramural Gover nment Total £m £m £m £m £m £m £m £m £m £m £m £m Direct 5.0 81.5 3.0 9.9 36.8 136.2 32.7 101.7 458.4 1.7 74.5 805.2 Exchequer Indirect 22.1 22.1 22.1 CSF Funds 40.1 2 1.4 7.5 5.7 74.7 1.9 3.1 24.4 2.4 0.3 106.8 EU contracts 19.0 1.8 2.5 23.3 0.4 3.0 0.1 26.8 Business 7.0 3.1 5.2 15.3 11.8 1 1.7 0.1 38.9 Other ear ned income 12.9 2.3 3.7 18.9 10.6 2 2.4 45.3 3.4 100.6 Total 45.1 163.9 17.7 9.9 53.9 290.5 57.4 141.9 528.2 4.1 78.3 1100.4 (1)
Science and T
echnology departments only
(2)
AMT Ireland is classified under S&T information and technical services
S&T INFO.
TECH. S&T ED. TECH. OTHE TOT
AL
SER
VICES
& TRAIN
TRANSFER S&T
Sour
ces of Funds:
Business Thir d Level (1) PA T S (2) Extramural Gover nment Total € m € m € m € m € m € m € m € m € m € m € m € m Direct 6.4 103.5 3.8 12.6 46.7 172.9 41.5 129.1 582.1 2.2 94.6 1022.4 Exchequer Indirect 28.1 28.1 28.1 CSF Funds 50.9 2 7.2 9.5 7.2 94.9 2.4 3.9 30.9 3.1 0.4 135.6 EU contracts 24.1 2.3 3.2 29.6 0.5 3.8 0.1 34.0 Business 8.9 3.9 6.6 19.4 14.9 1 4.9 0.1 49.4 Other ear ned income 16.4 2.9 4.7 24.0 13.5 2 8.4 57.5 4.3 127.7 Total 57.3 208.1 22.5 1 2.6 68.4 368.9 72.9 180.2 670.6 5.2 99.4 1397.2 (1)
Science and T
echnology departments only
(2)
AMT Ireland is classified under S&T information and technical services
Figur
e 6
Indicative Distribution of Funds for Science and T
echnology
, 2000, £m
Figur
e 6A
Indicative Distribution of Funds for Science and T
echnology
, 2000,
E
m
[image:23.595.58.550.36.775.2]To : C&RFB 7 110 117
D. I. A. S.
40 15 55 EP A 650 650 ESRI 81 135 43 13 554 261 18 72 1,177 Dept. Education 100 100 Enterprise Ireland 119 49,557 4,480 175 40 54,371 GSI 88 HEA 4,593 366 7,600 1,200 260 14,019 HRB 103 103 IDA Ireland 4,000 4,000 Innov Centre 295 295 Marine Institute 191 191 Met É ireann 25 200 225 NMRC 2,637 965 3,912 7,514 NSAI 3,086 3,086 SF ADCo 7,310 7,310 T eagasc 4,514 63 50 4,627 Ú dar á
s na G
800 800 Grand T otal 9,107 191 548 75,111 135 4,480 1,008 2,013 657 3,912 200 330 200 295 261 110 18 72 98,648
Dept Agri- culture
From:
Grand Total
F Á S T eagasc OPW
Dept Soc We
l SF ADCo NRA Marine Institute Dept. Marine HEA Dept. Health Dept. Environ Enterprise Ireland
Dept. Pub Ent
Dept. Education Dept. Ent, T & E
COFORD
[image:24.595.109.496.86.762.2]C&RFB
Table 7:
Planned T
25 To : C&RFB 9 140 149
D. I. A. S.
51 19 70 EP A 825 825 ESRI 103 171 55 17 703 331 23 91 1,494 Dept. Education 127 127 Enterprise Ireland 151 62,924 5,688 222 51 69,037 GSI 10 10 HEA 5,832 465 9,650 1,524 330 17,800 HRB 131 131 IDA Ireland 5,079 5,079 Innov Centre 375 375 Marine Institute 243 243 Met É ireann 32 254 286 NMRC 3,348 1,225 4,967 9,541 NSAI 3,918 3,918 SF ADCo 9,282 9,282 T eagasc 5,732 80 63 5,875 Ú dar á
s na G
1,016 1,016 Grand T otal 11,564 243 696 95,371 171 5,688 1,280 2,556 834 4,967 254 419 254 375 331 140 23 91 125,257
Table 7A:
Planned T
ransfer payments between S&T organisation for S&T activities, 2000,
£
'000
Dept Agri- culture
From:
Grand Total
F Á S T eagasc OPW
Dept Soc We
l SF ADCo NRA Marine Institute Dept. Marine HEA Dept. Health Dept. Environ Enterprise Ireland
Dept. Pub Ent
Dept. Education Dept. Ent, T & E
COFORD
4
Science and Technology for the
Productive Sectors
Volume 2 of this year’s Science and Technology Budget presents data on R&D across the whole public sector. In this section we look at other science and technology (S&T) activities, apart from R&D, which are performed in support of the productive sectors of the economy. The sectors considered are industry, agriculture, environment, energy, transport and the marine & forestry areas.
4.1 Industry
Table 8 shows the S&T allocations (including earned income) to various government departments and agencies to support industrial activity. FÁS accounts for over 40% of the total (£28.3m, €35.9m) providing industrial training programmes. The substantial increase in S&T training expenditure by FÁS is highlighted when one looks at FÁS’s 1997 figure of £9.5m (€12.1m) (current prices).
The necessity for such investment is emphasised in the National Competitiveness Council report -‘The Competitiveness Challenge 2000’: "Human capital, embodied in people, is the vital strategic resource in the increasingly knowledge-based modern economy. Pervasive skill and labour shortages are increasing the risk of overheating and a much sharper than expected economic slowdown".
27
Table 8:
2000 Science & Technology Allocations (including earned income) by
Industry objective
Agency/Department £'000 £'000 £'000 £'000 £'000 £'000 £'000
% activity % activity % activity % activity % activity % activity % change
FÁS 28,296 28,296 21,148
100% 100% 34%
Enterprise Ireland 1,819 5,846 1,000 3,550 780 12,994 13,454
14% 45% 8% 27% 6% 100% -3%
NSAI 10,861 10,861 10,599
100% 100% 2%
Dept. of Enterprise, 437 200 5,384 6,021 6,006
Trade & Employment 7% 3% 89% 100% 0%
National Microelectronics 3,912 3,912 970
Research Centre 100% 100% 303%
Patents Office 2,593 305 2,898 3,039
89% 11% 100% -5%
Teagasc 1,268 877 2,145 2,022
59% 41% 100% 6%
Shannon Development 1,750 1,750 1,633
100% 100% 7%
Innovation Centre 565 565 550
100% 100% 3%
Forfás (inc. NAB) 483 483 465
100% 100% 4%
National Microelectronics 32 42 42 21 21 158 186
Applications Centre 20% 27% 27% 13% 13% 100% -15%
Total 6,714 22,221 31,088 3,571 6,490 70,083 60,072
10% 32% 44% 5% 9% 100% 17%
1999 Outturn Total
Other Activities Technology
Transfer Education
and Training Scientific
and Technical Services Information &
Table 8A:2000 Science & Technology Allocations (including earned income)
by Industry objective
Agency/Department €'000 €'000 €'000 €'000 €'000 €'000 €'000
% activity % activity % activity % activity % activity % activity % change
FÁS 35,928 35,928 26,852
100% 100% 34%
Enterprise Ireland 2,310 7,423 1,270 4,507 990 16,500 17,083
14% 45% 8% 27% 6% 100% -3%
NSAI 13,791 13,791 13,458
100% 100% 2%
Dept. of Enterprise, 555 254 6,836 7,645 7,626
Trade & Employment 7% 3% 90% 100% 0%
National Microelectronics 4,967 4,967 1,232
Research Centre 100% 100% 303%
Patents Office 3,292 387 3,680 3,859
89% 11% 100% -5%
Teagasc 1,610 1,114 2,724 2,567
59% 41% 100% 6%
Shannon Development 2,222 2,222 2,073
100% 100% 7%
Innovation Centre 717 717 698
100% 100% 3%
Forfás (inc. NAB) 613 613 590
100% 100% 4%
National Microelectronics 41 53 53 27 27 201 236
Applications Centre 20% 27% 27% 13% 13% 100% -15%
Total 8,524 23,214 39,474 4,534 8,241 88,987 76,276
10% 32% 44% 5% 9% 100% 17%
1999 Outturn Total
Other Activities Technology
Transfer Education
and Training Scientific
and Technical Services Information
29
4.2 Agriculture
[image:29.595.83.538.245.785.2]Table 9 shows the S&T allocations (including earned income) to government departments and agencies to support activities in the agriculture area. The players here are the Department of Agriculture and Food (53%) and Teagasc (47%). The Department operates a number of veterinary laboratories, three dairy science laboratories, as well as classification, testing and certification schemes in relation to meat and crop production. Teagasc provides professional advice to farmer clients at enterprise level dealing with dairying, cattle, tillage crops, horticulture, financial management, agri-tourism, farm modernization, environmental conservation/control of farm pollution, winter feed quality and overall farm management. Program support includes the provision of specialist training to advisers to enable them to keep abreast of S&T developments.
Table 9:
2000 Science & Technology Allocations (including earned income) by
Agriculture objective
Agency/Department £'000 £'000 £'000 £'000 £'000 £'000 £'000
% activity % activity % activity % activity % activity % activity % change
Teagasc 27,533 2,139 29,672 28,706
93% 7% 100% 3%
Department of Agriculture 2,613 30,802 33,415 23,252
& Food 8% 92% 100% 44%
Total 30,146 32,941 63,087 51,958
48% 52% 100% 21%
Table 9A:
2000 Science & Technology Allocations (including earned income)
by Agriculture objective
Agency/Department €'000 €'000 €'000 €'000 €'000 €'000 €'000
% activity % activity % activity % activity % activity % activity % change
Teagasc 34,960 2,716 37,676 36,449
93% 7% 100% 3%
Department of Agriculture 3,318 39,110 42,428 29,524
& Food 8% 92% 100% 44%
Total 38,278 41,826 80,104 65,973
48% 52% 100% 21%
4.3 Environment
[image:30.595.86.539.212.615.2]Table 10 shows the science and technology allocations (including earned income) for activities broadly categorised as environment-related. The major components are the specialist advice, monitoring and laboratory services and other activities of the Environmental Protection Agency and the Radiological Protection Institute of Ireland, as well as the technical services in environment management of Enterprise Ireland and Teagasc.
Table 10:
2000 Science & Technology Allocations (including earned income) by
Environmental objective
Agency/Department £'000 £'000 £'000 £'000 £'000 £'000 £'000
% activity % activity % activity % activity % activity % activity % change
Environmental Protection 1,259 9,801 11,060 10,105
Agency 11% 89% 100% 9%
Enterprise Ireland 44 2,163 2,207 2,415
2% 98% 100% -9%
Radiological Protection 619 309 928 872
Institute of Ireland 67% 33% 100% 6%
Dept. of Arts, Heritage, 540 540 759
Gaeltacht & the Islands 100% 100% -29%
Teagasc 55 38 93
59% 41% N/A
Dept. of the Environment 31 51 82 79
& Local Government 38% 62% 100% 4%
Total 2,008 12,902 14,910 14,230
13% 87% 100% 5%
1999 Outturn Total
Other Activities Technology
Transfer Education
and Training Scientific
and Technical Services Information
31
Table 10A:
2000 Science & Technology Allocations (including earned income) by
Environmental objective
Agency/Department €'000 €'000 €'000 €'000 €'000 €'000 €'000
% activity % activity % activity % activity % activity % activity % change
Environmental Protection 1,599 12,445 14,043 12,831
Agency 11% 89% 100% 9%
Enterprise Ireland 56 2,747 2,802 3,066
2% 98% 100% -9%
Radiological Protection 786 392 1,178 1,107
Institute of Ireland 67% 33% 100% 6%
Dept. of Arts, Heritage, 686 686 964
Gaeltacht & the Islands 100% 100% -29%
Teagasc 70 48 118
59% 41% N/A
Dept. of the Environment 39 65 104 100
& Local Government 38% 62% 100% 4%
Total 2,549 16,382 18,932 18,068
13% 87% 100% 5%
4.4
Marine and Forestry
Table 11 shows the science and technology allocations (including earned income) for activities in the marine, fisheries and forestry areas.
Scientific and technical services now accounts for 76% of the total expenditure with the majority of the spending undertaken by the Marine Institute. The Marine Institute provides a data and
information management service which aims to strengthen the overall quality, service and
performance of marine data and information management at both national and international level. An Bord Iascaigh Mhara's training programmes are geared to developing practical skills with respect to efficiency, safety, and management functions in order to support the maintenance and expansion of sustainable employment in sea fishing, aquaculture, processing and distribution. Enterprise Ireland, in the forestry section, provides technical advice, consultancy services, training and assistance with new products, and process development was provided to the Irish timber industry to identify opportunities for Irish timber and develop new applications and standards.
1999 Outturn Total
Other Activities Technology
Transfer Education
and Training Scientific
and Technical Services Information
Table 11:
2000 Science & Technology Allocations (including earned income) by
Marine & Natural Resources objective
Agency/Department £'000 £'000 £'000 £'000 £'000 £'000 £'000
% activity % activity % activity % activity % activity % activity % change
Marine Institute 6,712 6,712 9,320
100% 100% -28%
Bord Iascaigh Mhara 53 1,761 670 2,484 2,258
2% 71% 27% 100% 10%
Central and Regional 1,200 1,200 1,420
Fisheries Board 100% 100% -15%
Enterprise Ireland 69 696 765 812
9% 91% 100% -6%
COFORD 80 212 292 190
27% 73% 100% 54%
Total 69 8,661 1,761 80 882 11,453 14,000
1% 76% 15% 1% 8% 100% -18%
Table 11A:
2000 Science & Technology Allocations (including earned income) by
Marine & Natural Resources objective
Agency/Department €'000 €'000 €'000 €'000 €'000 €'000 €'000
% activity % activity % activity % activity % activity % activity % change
Marine Institute 8,522 8,522 11,834
100% 100% -28%
Bord Iascaigh Mhara 67 2,236 851 3,154 2,867
2% 71% 27% 100% 10%
Central and Regional 1,524 1,524 1,803
Fisheries Board 100% 100% -15%
Enterprise Ireland 88 884 971 1,031
9% 91% 100% -6%
COFORD 102 269 371 241
27% 73% 100% 54%
Total 88 10,997 2,236 102 1,120 14,542 17,776
1% 76% 15% 1% 8% 100% -18%
[image:32.595.87.536.100.400.2]33
4.5 Energy
[image:33.595.85.538.179.810.2]Table 12 shows science and technology allocations (including earned income) for activities related to energy. The major element here is the energy technology promotion activities of the Irish Energy Centre in Enterprise Ireland. The Department of Marine and Natural Resources operate an Exploration and Mining Division and a Petroleum Affairs Division, which provides the technical expertise necessary for promotion, monitoring and controlling of petroleum exploration and development activities by private enterprise under licence to the Department.
Table 12:
2000 Science & Technology Allocations (including earned income) by Energy
objective
Agency/Department £'000 £'000 £'000 £'000 £'000 £'000 £'000
% activity % activity % activity % activity % activity % activity % change
Enterprise Ireland 3,910 670 4,580 3,082
85% 15% 100% 49%
Department of Marine 1,043 121 5 18 1,187 500
& Natural Resources 88% 10% <1% 2% 100% 137%
Total 4,953 791 5 18 5,767 3,582
[image:33.595.85.533.482.693.2]86% 14% <1% <1% 100% 61%
Table 12A:
2000 Science & Technology Allocations (including earned income) by Energy
objective
Agency/Department €'000 €'000 €'000 €'000 €'000 €'000 €'000
% activity % activity % activity % activity % activity % activity % change
Enterprise Ireland 4,965 851 5,815 3,913
85% 15% 100% 49%
Department of Marine 1,324 154 6 23 1,507 635
& Natural Resources 88% 10% <1% 2% 100% 137%
Total 6,289 1,005 6 23 7,322 4,548
86% 14% <1% <1% 100% 61%
4.6 Transportation
Table 13 shows science and technology allocations (including earned income) in support of national transportation objectives. The activity relates to the work of the National Roads Authority in planning and supervising the construction, improvement and maintenance of network of national roads. It amounts to £1.3m (€1.65m) overall.
Table 13:
2000 Science & Technology Allocations (including earned income) by
Transportation
Agency/Department £'000 £'000 £'000 £'000 £'000 £'000 £'000
% activity % activity % activity % activity % activity % activity % change
National Roads Authority 243 920 68 59 1,290 1,225
19% 71% 5% 5% 100% 5%
Table 13A:
2000 Science & Technology Allocations (including earned income) by
Transportation
Agency/Department €'000 €'000 €'000 €'000 €'000 €'000 €'000
% activity % activity % activity % activity % activity % activity % change
National Roads Authority 309 1,168 86 75 1,638 1,555
19% 71% 5% 5% 100% 5%
5
Education and Health Activities
[image:34.595.86.533.151.618.2]The S&T Budget incorporates data relating to scientific and technological activities undertaken in a broader social context. The major components of this relate to educational and health activities. Table 14 shows the science and technology allocations (including earned income) for education and training activities. The administering of funding by The Higher Education Authority and the Department of Education and Science for S&T courses, in the universities and institutes of technology respectively, are the major performers.
The total allocation for Education and Training (including earned income) in 2000 is £533.6m (€677.6m) an increase of £34.9m (€44.3m) over the 1999 figure. This increase is mainly due to the additional allocations by the Department of Education and Science via the Higher Education Authority (HEA) of £31m (€39.4m) for research in third level institutions. This is an increase in real terms of 9% over the 1999 HEA figure.
35
Table 14:
2000 Science and Technology Allocations (including earned income) by
Education & Training objective
Agency/Department £'000 £'000 £'000 £'000 £'000 £'000 £'000
% activity % activity % activity % activity % activity % activity % change
Department of Education 275,398 128 275,526 272,633
& Science 100% <1% 100% 1%
Higher Education Authority 196,444 58,237 254,681 223,022
77% 23% 100% 14%
Postgraduate Medical 2,857 2,857 2,524
& Dental Board 100% 100% 13%
Dublin Institute for 60 525 585 543
Advanced Studies 10% 90% 100% 8%
Total 60 474,699 58,890 533,649 498,722
<1% 89% 11% 100% 7%
Table 14A:
2000 Science and Technology Allocations (including earned income) by
Education & Training objective
Agency/Department €'000 €'000 €'000 €'000 €'000 €'000 €'000
% activity % activity % activity % activity % activity % activity % change
Department of Education 349,683 162 349,845 346,172
& Science 100% <1% 100% 1%
Higher Education Authority 249,432 73,946 323,378 283,179
77% 23% 100% 14%
Postgraduate Medical 3,628 3,628 3,205
& Dental Board 100% 100% 13%
Dublin Institute for 76 667 743 689
Advanced Studies 10% 90% 100% 8%
Total 76 602,743 74,775 677,594 633,245
<1% 89% 11% 100% 7%
[image:35.595.88.538.99.408.2]Activities in the area of health are shown in Table 15. Science and technology activities in the Health sector are dominated by the activities of the Department of Health and Children. In the Department of Health and Children, the scientific and technical services of £5.0m (€6.4m) relates mainly to the activities of the Irish Medicines Board, which is self-funding from earned income and receives no public funds.
The Department employs consultants to study and advise on various aspects of the health services. The Food Advisory Committee advises on matters relating to the composition, description,
manufacture, processing, labelling and advertising of food. The Department participates in the S&T activities of the World Health Organisation and other international organisations.
[image:36.595.87.537.316.727.2]The National Cancer Registry Board researches and analyses information relating to the incidence and prevalence of cancer and related tumours in Ireland and promotes and facilitates the use of data collected in approved research projects and in planning and management of services.
Table 15:
2000 Science & Technology Allocations (including earned income)
by Health objective
Agency/Department £'000 £'000 £'000 £'000 £'000 £'000 £'000
% activity % activity % activity % activity % activity % activity % change
Health Research Board 388 55 443 330
88% 12% 100% 34%
Dept. of Health & Children 5,706 5,134 21 10,861 9,381
53% 47% <1% 100% 16%
Radiological Protection 385 385 770 716
Institute of Ireland 50% 50% 100% 7%
Total 6,091 5,907 55 21 12,074 10,427
50% 49% <1% <1% 100% 16%
1999 Outturn Total
Other Activities Technology
Transfer Education
and Training Scientific
and Technical Services Information