Copyright©2019 by authors, all rights reserved. Authors agree that this article remains permanently open access under the terms of the Creative Commons Attribution License 4.0 International License
Abstract
This paper, to the best of my knowledge, is the first to estimate the association between Nighttime Lights (NTL) and real Gross Domestic Product (GDP) at the national level, using sub-national GDP data for the 27 Egyptian governorates over FY08-FY13. The study finds that NTL has a positive and statistically significant correlation with GDP at the sub-national and national levels. Hence, NTL can measure and predict GDP in Egypt, at the national and sub-national levels. These findings affirm most previous research that NTL could be a good proxy for GDP when official data are unavailable or time infrequent in developing countries.Keywords
Night Time Light, GDP, Regional GDP, Economic Performance, Egypt1. Introduction
Gross Domestic Product (GDP) at the national and sub-national levels are the most widely used indicators for the analysis of economic performance and reference for political decision making. This paper aims at finding a good proxy for estimating economic performance at the national level using disaggregated regional GDP (GGP1) in Egypt. At the national level, GDP helps policymakers in assessing changes in the economy, and formulating the appropriate policies at the time of boost and recession. At the regional level, GGP is useful in identifying the source and distribution of economic growth across regions and economic activities, and lagging governorates, and hence helping in developing the right sectoral strategies.
Unfortunately, national and regional GDP measurement is usually deficient, especially in developing countries. Traditional approach of measuring GDP and other economic indicators based on estimates, surveys and censuses suffers from potential biases, time lags,
1 Throughout the paper, GDP at the sub-national level is referred to as “Gross Governorate Product” (GGP) and GDP is meant by GDP at the national level.
inaccuracies and difficulty in comparison between and within countries. Another critical problem is that a fraction of economic activity is conducted within the informal sector that most of it is left uncounted in the GDP formula. Also, some developing countries suffer from absence of GDP estimates at the sub-national (regional) level in the economy, which hinder attempts to estimate different socio-economic variables at the sub-national level like economic growth, poverty, health and environmental quality. This paper suggests Nighttime light (NTL) as a good predictor of GDP, at the national and sub-national levels, in Egypt.
NTL involves a special remote sensing technique that is conducted by the U.S. Air Force Defense Meteorological Satellite Program (DMSP) at the National Oceanic and Atmospheric Administration (NOAA). It represents the artificial human lighting at night. Once NTL data have been cleaned and filtered out lights due to forest fires, moon shine etc., they may prove useful. It has numerous advantages; light emission is measured objectively and systematically at a fairly high resolution at specific geographic location. The gathering of NTL data is relatively cheap, though the initial investment is considerable. However, there are some drawbacks to this technique. Sensors have different detection limits and saturation radiances that saturate luminosity at bright urban cores. In addition, optical sensors degrade overtime. Despite NTL technique’s drawbacks, such limitations could be overcome and solved statistically and by calibration (Elvidge et al. 2014).
As early as Croft (1978), it was shown that NTL could reflect human development and settlement. Most studies concerned with the application of NTL, argue its predictive power in estimating many socio-economic variables, such as the estimation of population density (Sutton et al. 1997 and 2003; Zhuo et al. 2009), urbanization (Bhandari and Roychowdhury, 2011; and Zhang and Seto 2011), and economic performance at the national and sub-national levels (Ebener et al., 2005; Chen and Nordhaus, 2011; Kulkarni et al., 2011; Henderson et al., 2012; and Elvidge et al., 2014).
it investigates if the intensity of night lights can be used as a proxy measure for the magnitude of the real GGP and GDP, during the period FY08-FY13. The assumption behind studying this relation is that almost all consumption and investment activities at night require lighting. More specifically, the higher economic performance encourages higher human activities at night and so the higher night light emission. The paper is not interested in studying the causal relationship between NTL and GDP; rather it is concerned of investigating their association that would enable complementing GDP figures with NTL estimates.
The paper replicates the work of Moursi and Omar (2016) at the sub-national level by using a different estimation method; “the Driscoll and Kray” method to check the robustness of their findings (Driscoll and Kraay, 1998; and Hoechle, 2007). It contributes, as the first paper, in examining the association between NTL and GDP in Egypt at the national level using disaggregated data2 for 27 Egyptian governorates over 6 years (FY08-FY13). In line with literature, the paper finds a positive significant association between real GGP and light intensity within Egypt over the period FY08-FY13. The paper concludes that light intensity appears to be a good predictor of GGP and GDP.
The paper is organized as follows; after the introduction, section II gives an overview on NTL data. Section III provides NTL literature with its application on economic performance. Section IV shows and explains the link and performance of GDP and NTL in Egypt, at the national and sub-national levels. Section V presents the results, and finally, section VI concludes.
2. What Is Nighttime Light?
In the mid-1960s, the U.S. Air Force started a research project called the Defense Meteorological Satellite Program (DMSP). It was originally designed to detect moonlit clouds and weather data to support Department of Defense. Surprisingly, satellites were able to capture night lights from human settlements, which have been used since then extensively in research. Until 1992, scientists had access to DMSP data only from film archives (Doll, 2008). Since 1992, satellites’ images have been systematically digitized at the National Oceanic and Atmospheric Administration’s (NOAA) National Geophysical Data Center (NGDC). Each satellite-year dataset is a grid reporting the intensity of lights as a six-bit digital number (DN), for every 30 arc-second output pixel (approximately 0.86 square kilometers at the equator) spanning -180 to 180 degrees longitude and -65 to 75 degrees latitude. Some parts of Greenland, Alaska, Canada, Scandinavia and
2 The GGP computational methodology are available in Moursi and Omar (2016).
Antarctica are missing, as about 0.0002% of the world population lives there.
The sensor of satellites is called Operational Linescan System (OLS). OLS captures images at a resolution of 0.56 kilometer3 (km) (Doll, 2008). Satellites have been circling Earth 14 times per day, such that each satellite should have a global night light coverage every 24 hours. Usually two satellites orbit together, where each satellite observes every location on Earth every night between 8:30 and 10:00 pm local time. The lifespan of a satellite is limited from 6 to 8 years, and overtime satellite deteriorates and needs to be replaced to ensure data continuity and accuracy (Elvidge et al., 2009).
NOAA’s satellites composites provide different night light products: Average Lights X Pct, Radiance Calibrated datasets, and Average Visible Stable Lights and Cloud Free Coverage. This paper works with the latter dataset, that is widely used in research and for simplicity it is called “Stable Lights”. The night lights raw data are processed by scientists at the NOAA’s NGDC. In processing, they remove all noise background such as ephemeral lights from forest fires, fishing boats, and other sources are removed. They also discard places experiencing the bright half of lunar cycle, the summer months when the sunsets late, auroral activity (the northern and southern lights), and cloud cover obscures the earth’s surface. This action leaves NTL data with mostly human-made light, except the gas flare that comes as a byproduct of Oil production. Finally, data from all orbits of a given satellite in a given year are averaged over all valid nights to produce a satellite-year Stable Lights dataset. All satellite datasets are distributed to the public free of charge.
Stable lights dataset is quantized in 6-bits and gives different light intensities with an integer digital number (DN) ranging between 0 and 63, referring to no light and maximum light, respectively. Figure 1 presents the World Stable Lights Map, where two observations can be deduced. First, the dark area indicates the unlit area with zero DN, and the light appears with an increasing intensity from gray to purely white reaching the maximum 63 DN. Second, one gets a sense on the distribution of human settlement, urbanization, and income distribution.
Source: Image and data processing by NOAA’s National Geophysical Data Center. DMSP data collected by the United States Air Force Weather Agency. http://ngdc.noaa.gov/eog/dmsp/downloadV4composites.html
Figure 1. World’s Lights at Night, 2013
3. Literature Review
As early as Croft (1978), it was shown that NTL reflect human well-being, as they represent the artificial human illumination. NTL was used in a number of applications. The most intuitive application was in mapping urban areas (Doll and Muller 1999). NTL data had also successfully estimated population density (Sutton et al. 1997 and 2003; and Zhuo et al. 2009), urban population size (Elvidge et al. 1997; Doll et al. 2006; Small et al. 2011), as well as energy consumption and greenhouse gas emissions (Doll et al 2000; and Letu et al 2010).
On average, NTL can estimate human economic activity. Using only one year snapshot, Elvidge et al (1997) was the first to find a positive correlation between NTL and real GDP in a log-log regression for 21 countries in 1994-95. Subsequently, this was broadened by Doll et al. (2000) introducing the first global map of GDP-PPP at a resolution of 1˚x1˚using NTL datasets in a log-linear relationship (see also, Sutton and Costanza, 2002; and Doll et al. 2006).
Ebener et al. (2005) proposed a global model testing the correlation of NTL with income per capita. They found that total and mean frequency of observed lights is more correlated with per-capita income than lit-area. This result was more reliable at the national level than sub-national level. Later, Sutton et al. (2007) improved this model by adding estimated urban population as GDP predictor at the sub-national level to solve the saturation problem of luminosity images and applied the new model on China, India, Turkey, and U.S in 1992-93 and 2000. Authors concluded that “spatial disaggregation of estimates dramatically improves aggregate national estimates” of GDP (Zhao, et al., 2011; and Bhandari and Roychowdhury, 2011).
During last decade, research tried to consider the whole NTL time span to make use of all available data. Chen and
Nordhaus (2011) and Henderson et al. (2012), using the same statistical framework, found that NTL can play the role of proxy for economic activity at the national and sub-national levels, but light data has more value-added in low-quality income data countries than high-quality income data countries (Addison and Steward, 2016). They suggested the statistical time fixed effect approach to overcome the satellite sensors’ saturation problem. The current paper adopts these authors’ methodology with two differences: first this paper analyses the relationship between NTL and GDP at the regional and national levels, while Chen and Nordhaus (2011) and Henderson et al. (2012) at the national level. Second, this paper works with variables at level, while the latter works at growth. However, we reach the same finding of NTL predictive power in estimating economic performance. Bundervoet et al. (2015) had the same conclusion on Sub-Saharan African countries. These findings encourage the potential use of NTL in forecasting economic performance at the national and sub-national levels of developing countries.
To the contrary, Kulkarni et al. (2011) argued that NTL are good proxy for developed more than developing countries on a within country analysis on U.S., India and China over 2001-2007. To overcome sensors’ saturation problem and time aging, Elvidge et al. (2014) adopted the inter-calibration approach on Stable Lights data. Authors found in most countries positive correlation between sum of lights and GDP. For the countries with no or negative correlation, authors suggested that this might be because of electrical technological advances for more efficient lighting or to reduce light pollution.
4. GGP and NTL Evolution
in the Egyptian economy was steadily trending upward with annual growth rate averaging 2.6 percent. The Egyptian economy’s growth rates fluctuated around the average, with minimum and maximum growth rates of 2.11 percent in FY13 and 7.15 percent in FY08, respectively. Since 90’s, the Egyptian government was adopting a bundle of strategies aiming at accelerating economic growth through wealth accumulation of big business firms. These measures sustained high growth for three successive years until FY08, with the negative financial and economic spillover effects of the 2008 global financial crisis. These effects extended to slower growth in many economic activities in Egypt in FY09 e.g., hotels and restaurants, Suez Canal, manufacturing, construction and electricity, etc. By FY10, Egypt adopted a bundle of corrective measures involving investment, tariffs and subsidies policies that helped in recovering the economy to grow at 5.1 percent.
Egypt continues to suffer from various structural imbalances and social inequality. Such unfavorable economic and social conditions led many Egyptians to demonstrate in the 25th of January 2011. The revolution resulted in the disruption of economic activity, security failure and political instability and uncertainty. These factors drastically decreased investment from 17.1 percent to -1.2 percent in FY11, and slightly declined final consumption growth by 0.17 percentage point from 4.9 percent in FY10 (World Bank, 2016). Investment and final consumption are major contributors to GDP with 17.1 percent and 75.6 percent in FY11, respectively (Central Bank of Egypt, 2016). Hence, Egypt’s growth rate fell dramatically by 3.3 percentage points to 1.8 percent by FY11.
This situation led some Arab countries—mainly Saudi Arabia, Qatar, Kuwait and Oman—and international organizations to offer financial support to Egyptian governments. These funds helped Egypt improving its economic performance and raising growth to 2.2 percent in
FY12. By FY13, growth slightly decreased by 0.1 percentage point to become 2.1 percent, due to the decline of household consumption growth from 6 percent to 4.9 percent (World Bank, 2016), and investment drastic decays by 13.6 percent in FY13 (Central Bank of Egypt, 2016).
At the regional level, using the GGP dataset of Moursi and Omar (2016), governorates’ economic contribution can be easily identified. Policymakers can take suitable measures for distributing investment, subsidies, facilities in a way that would simultanously accelerate economic growth in more successful governorates (Cairo, Giza, Alexandria, Beheira, Sharqia and Suez) and encourage productive activities in lagging governorates such as most Frontier governorates, Asswan and Luxor that have great economic potential (figure 2). Higher economic growth and prosperity will increase individuals’ consumption and investment that is assumed to appear as higher night luminosity.
NTL shows a similar trend as real national GDP over the studied period (figure, 3). Night lighted pixels have been growing in Egypt with the increasing trend of GDP over the studied period until FY12, when Egypt witnessed the night curfews and the energy crisis that led to several electricity cut-offs. However, NTL and GDP are positively correlated with a coefficient of 0.74.
[image:4.595.143.454.546.720.2]A closer look within Egypt, Egypt night lights' map in figure 4 suggests that first, Delta/Nile is lighted while the rest of Egypt is almost dim, especially Frontier governorates that are the least populated area. This is attributed to the fact that the Egyptian population is mainly concentrated besides and around the Nile. Hence, most economic activities take place in this region. Second, most lighted pixels are not with the highest light intensity (not top-coded pixels). This is understood as Egypt is a developing country. Third, spatial distribution of light suggests that population is not equally distributed whether across or within governorates.
Source: Moursi and Omar (2016)
Source:Moursi and Omar (2016)
Figure 3. Sum of Lights and Real GDP in Egypt, over FY08-FY13 (in constant LE4 FY12)
Source: Done by Author
Figure 4. Egypt’s Night Light, 20135
Table (1). Night Lights Data for selected governorates, average FY08-FY13
DN Alex Beni Suef Gharbia Kafr Sheik Menia New Valley North Sinai Qalyubia Qena
0-6 21.8 78.4 0 5.1 85.4 99.5 93.4 0 75
6.1-10 7.3 2.7 0 9.2 2.7 0.2 2.3 0 3.7
10.1-20 14.7 3.2 0 26.1 3.0 0.2 2.3 0.4 3.2
20.1-40 19.7 5.6 32.1 47.2 2.5 0.1 1.4 1.2 3.7
40.1-60 17.8 8.7 60.2 11.7 5.6 0.0 0.5 31.6 8.1
60.1-63 18.8 1.5 8.6 0.9 0.8 0.0 0.1 67.5 6.2
63 12.8 0.6 3.4 0.3 0.3 0.0 0.02 44.8 2.94
GGP 831.4 177.36 412.8 425.6 330.3 56.3 88.4 374 260.3
Pop
Density 1852 2895 1098 78 2362 1 39 505 2502
Source: Calculated by Author
Note: GGP are in millions LE and base year 2010. Pop Density data are extracted from Ministry of Planning (MoP).
4 LE refers to the currency Egyptian Pounds.
[image:5.595.156.442.79.242.2] [image:5.595.157.438.295.480.2] [image:5.595.74.526.523.660.2]Table (1) gives some sense of NTL data, describing the distribution of pixels across different DN intervals, from dim to maximum lighted pixels intervals (0-6 and 60.1-63, respectively), for some selected governorates with a broad range of GGP and population densities. Many governorates have a high fraction of dim pixels with DN 0-6. No governorate has pixels with DN of 1 or 2. This observation was explained by Henderson et al. (2012) as the consequence of the algorithms used to filter out noise in raw data. Governorates that have most unlit pixels are located in Upper Egypt and Frontier governorates6. For instance, Beni Suef and Qena have 78.4 percent and 75.1 percent unlit pixels, respectively. Egypt has special case with its Frontier Cities that have the highest unlit pixels’ frequency among all governorates and they are almost dim, ranging from 93.4 percent in North Sinai to 99.5 percent in New Valley. This might be due to their low GGP and low population density. Also, their main economic activity is the Extraction of Crude Oil and Natural Gas, and the Manufacture of Crude Oil Petroleum that do not need for lighting or intense lighting at night.
Spatial distribution of NTL by governorate meet GGP distribution in Egypt, holding population constant. For instance, Menia is more populated than Alexandria but the latter has a higher GGP share in the economy 6.7 percent versus 2.7 percent. The densely populated poor governorate has more unlit pixels, where Menia has 85.4 percent of its pixels unlit while Alexandria has 21.8 percent.
Governorates are divided into five quintiles based on their GGP, and on average one can say that high (low) luminosity is concentrated in governroates with high (low) GGP and/or high (low) population density7. For instance, at the 1st GGP quintile, Cairo comes with the highest GGP that is reflected in its relatively high light intensity that has been growing during FY08-FY13 (figure 5). Its GGP grew by 2.36 percent per annum during FY08-FY13 that is driven by “Other Manufactuing”, Trade and Real Estate economic activities. The pattern of illumination in Cairo closley track its economic performance with the sum of lights increase by 2.67 percent, the top-coded cells increase by 4.1 percent while the unlit cells decrease by 3.73 percent per annum. Cairo’s illumination coverage and intensity increase overtime, with expanding areas of different observed light intensity at the expense of dim pixels (figure 5). Though Cairo has the highest contribution in the national economy, parts of it are dim might be due to high
6Egypt is divided into six regions: Cairo’s area includes Cairo, Giza and Qalyubia; Delta includes Al sharqia, Menoufia, Kafr El-Sheikh, Gharbia, Damieta and Dakahlia; Middle Egypt consists of Assuit and New Valley; Alexandria and West Delta includes Alexandria, Beheira and Matrouh; Upper Egypt consist of Luxor, Sohag, Red Sea, Qena, Menia, Fayoum, Beni Suef and Asswan; and Canal cities includes Suez, South Sinai, North Sinai, Ismalia, and Port Said.
7 Population density is computed as the number of people living per kilometer square.
income inequality.
The governorates that belong to the 3rd quintile of GGP contributes to the economy between 2-3 percent and their lights intensity is lower than the governorates with higher GGP. Assuit is located in Upper Egypt, contributing in the economy with 2.1 percent with the dominating activity Agriculture with 26 percent of its GGP. Agricutlure in Assuit takes place in field, which does not emit much light at night. Also, Assuit is not a populated area with around 33 indivdiuals per km2, indicating low human activities at night and low light emittion. Hence, 82.8 percent of Assuit’s area is dim. This could also explain the correlation between real GGP and NTL in trends and the non-association in growth rates. The GGP and light grew at 6.5 percent and 0.5 percent per annum on average, respectively. However, as shown in figure 6, lights expanded the unlit area in 2010 by 2.2 percent corresponding to the GGP growth of 66 percent. By 2013, lights coverage and intensity decreased by 7.3 percent as a response to the GGP drop by 25.1 percent.
(a) 2008 (b) 2013
Source: see Figure 1, processed by Author
Figure 5. Cairo Night Lights’ Map
(a) 2008 (b) 2013
Source: see Figure 1, processed by Author
Figure 6. Assuit Night Lights Map
(a) 2008 (b) 2013
[image:7.595.70.534.59.704.2]Source: see Figure 1, processed by Author
[image:7.595.69.525.82.255.2] [image:7.595.68.524.483.689.2]
This descriptive analysis suggests that though night lights might represent GGP in some governorates strongly while others weakly, overall they represent human economic activity and human settements. As income and/or population are concentrated in a location, the night lights grow and even its intensity increases. Night Lights represents a special remote sensing technique that might predict economic performance and popuation settelements as discussed above.
5. Can NTL Predict GGP?
5.1. Dataset Sources
The paper aims to examine the relation between NTL and economic performance in Egypt at the national and sub-national levels over the period FY08-FY13. Also, it tests if NTL could be a good proxy for forecasting economic performance for Egypt and within its different governorates. The dataset used in estimation is taken from Moursi and Omar (2016). It used three indicators: NTL, national GDP and GGP data. NTL data are freely available on the NOAA website as satellites images, which are easily converted into numerical (analogue) data. National GDP estimates by economic activity are available from the Ministry of Planning website. GGP data are constructed for the 27 Egyptian governorates across economic activities for the years FY08-FY13, as they are unsatisfactory and not available on regular basis. They are computed using various Central Agency for Public Mobilization and Statistics (CAPMAS) bulletins.
5.2. Modeling the Relation between NTL and GGP
The structure of this paper’s estimation model is similar to that of Chen and Nordhaus (2011). However, Chen and Nordhaus (2011) tackles the relationship between GDP growth and NTL growth, while this paper investigates the relationship at the variables’ levels.
The Allometric growth model is used with three assumptions; the first assumption is that GGP measures are computed with error. The measurement error is due to possible systematic growth in incorrect measurement because of the different sources in calculating the GGP by economic activity which have infrequent observations, the subjective response of the responders in ground surveys and not all informal sector activities are counted in official statistics (equation 1). The second assumption is the existence of measurement error in luminosity that might occur from the difference between the true light and what a satellite records due to the saturation problem; and the satellite aging effect on light records (equation 2). The third assumption is the existence of a structural relationship between the true GGP and observed NTL with constant elasticity (equation 3), signifying that observable lights
increases at the same rate as economic performance.
Where GGP and NTL stands for real Gross Governorate Product at factor cost and Nighttime light, and an asterisk denotes the true values. is the measurement error of regional standard output with variance that is allowed to vary with governorate; is the measurement error of luminosity with the variance ; and reflects the noise in the light-output structural relationship. Also, the subscripts i and t stands for governorates and time, respectively.
Since the paper is concerned with studying if lights can predict the economic performance, GGP is regressed on NTL. After some derivations thoroughly explained in Chen and Nordhaus (2011) and Henderson et al. (2012), making the coefficients’ interpretation with elasticity, log-log equation is used:
(4)
Where is the error term of predicting the observed GGP using observed NTL. Estimating equation (4), two constructed panel data are used; Stable light dataset and GGP for 27 Egyptian governorates over the period FY08-FY13. Using Stable light dataset, three variables are extracted; Sum of Lights SOL which is the sum of the multiplication of location’s pixels by its digital value of light’s intensity. Top-coded Cells Top is the number of pixels that are highest light with DN 62 and 63. Unlit-coded Cells Unlit variable indicates the number of pixels that are dim with DN 0-6. A multiple regression model regressing the GGP on the three NTL variables: SOL, Top and Unlit are estimated.
Moreover, year and governorate effects are considered in the model as dummy variables. Year dummies control for satellite light data sensitivity; as sensor settings vary over time across satellites in terms of radiometric performance, detection limits and saturation radiances (Henderson et al., 2012); FY08 is the benchmark category. Governorate dummies accounts for governorates’ differences in light coverage, economic structure and economic performance; where Frontier governorates is considered the benchmark category.
In estimating this regression, the robust Hausman test is first run to choose between fixed and random effect models, in deciding if time-invariant unobservable variables are correlated to other variables in the model. Accordingly, the model is to be estimated using the random effect approach as the null hypothesis of consistent and efficient random effect is not rejected at the 5 percent significant level. With
)
1
(
* it GGP itit
GGP
e
GGP
=
+
)
2
(
* it NTL itit
NTL
e
NTL
=
+
)
3
(
* it itit
GGP
u
NTL
=
α
+
GGP
e
2 GGPσ
NTLe
2 NTLσ
itu
it itit
NTL
u
GGP
)
=
+
ln(
)
+
ln(
α
β
it
cross-sectional units. These problems yield inefficient coefficients and biased standard errors. Correcting for these problems, against Moursi and Omar (2016) that uses the Panel Corrected Standard Error approach (PCSE), this paper estimates pooled Ordinary Least Squares (OLS) regression with Driscoll and Kraay standard errors of non-parametric technique (Driscoll and Kraay, 1998; and Hoechle, 2007).
The PCSE method, though, corrects for heteroscedasiticty and autocorrelation, it gives imprecise estimates due to its assumptions about the corrections’ form of cross-sectional dependence. With large-N asymptotics, such corrections require strong assumptions about the corrections’ form because the number of cross-sectional correlations grows with higher rate than the number of observations growth. Although Moursi and Omar (2016) followed a lot of empirical research assuming that cross-sectional correlations are the same for every pair of cross-sectional units such that the introduction of time dummies purges the spatial dependence, constraining the cross-sectional correlation matrix is prone to misspecification, and hence implementing nonparametric corrections for the cross-sectional dependence is desirable (Hoechle, 2007).
On the other hand, the Driscoll and Kraay estimates standard errors for coefficients estimated by pooled Ordinary Least Squares regression are robust to very
5.3. Can NTL Forecast GGP?
The different regressions confirm that night luminosity can estimate and predict regional GDP in Egypt, as found in Moursi and Omar (2016). These empirical results go in line with previous papers’ conclusion (Chen and Nordhaus 2011; Henderson et al. 2012; and Bundervoet et al. 2015) and suggest NTL as a candidate proxy for measuring economic performance in developing countries at the sub-national level.
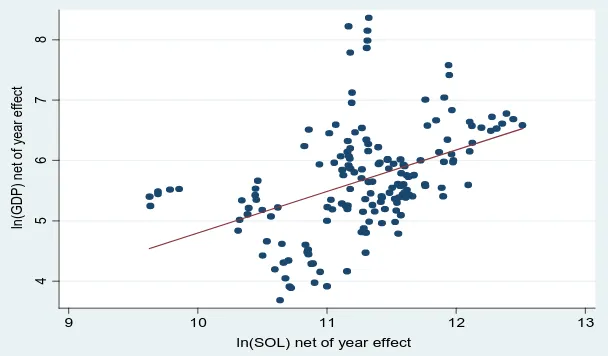
Column (1) shows that GGP and SOL are highly positively significant with elasticity of 0.69. This indicates that the human-made night light usage increases, the economy gets more prosperous and people richer (figure 8). Column (2) shows the positive significant relation between GGP and Top with elasticity of 0.42, suggesting that as the highest light intensity rises, GGP increases too. Also, as expected, column (3) reveals the negative significant correlation between GGP and Unlit variable with a coefficient of -0.17, meaning that the higher the number of dim pixels, the lower GGP and the lower people’s income. In a multiple regression, all night light variables have the expected relationship with GGP that is statistically significant at 5 percent significant level (column 4). Note the high R2 suggests that NTL with its different measures is likely to explain the variation in GGP with reasonable levels of significance.
Source: Calculated by Author
Figure 8. GGP versus Lights-Overall Panel
4
5
6
7
8
ln
(G
D
P) n
et
o
f ye
ar e
ffe
ct
9 10 11 12 13
[image:9.595.145.449.549.727.2]Table (2). Results of the Validity of NTL as a proxy for real GGP, FY08-FY13
(1) (2) (3) (4) (5)
ln(SOL) 0.69** 0.36** 0.68**
ln(Top) 0.42** 0.31**
ln(Unlit) -0.17** -0.13**
Dum09 0.15** 0.11** 0.16** 0.13** 0.15**
Dum10 0.02 -0.12** 0.15** -0.12** 0.01
Dum11 0.16** 0.00 0.27** 0.05** 0.16**
Dum12 0.20** 0.05** 0.30** 0.06** 0.19**
Dum13 0.27** 0.13** 0.34** 0.14** 0.26**
Cairo*ln(SOL) 0.27**
Alex*ln(SOL) 0.15**
Canal*ln(SOL) 0.11**
Upper*ln(SOL) 0.02**
Lower*ln(SOL) 0.07**
Constant -2.19** 3.63** 6.88** 1.17** -2.71**
Observations 162 162 141 141 162
R2 0.8 0.71 0.85 0.68 0.47
Number of Governorates 27 27 27 27 27
Note: 1-P-value *** p<0.01, ** p<0.05, * p<0.1. In Column (3) and (4), the inclusion of unlit variable decreased the number of observations to 141, owing to missing values.
2-Year and governorate fixed effects are accounted for. Dum09-Dum13 signify year dummy variables from FY09 to FY13; given FY08 is the benchmark category. Cairo*ln(SOL)-Lower*ln(SOL) signify governorates’ dummy variables of Cairo area multiplied by ln(Sum of Lights) to Lower Egypt multiplied by ln(Sum of Lights).
Examining the Sum of Lights’ regional effect—regional dummies in interaction with SOL—, column (5) shows that the coefficient of SOL remains positive and statistically significant at 5 percent significance level. This coefficient represents SOL elasticity of GGP in Frontier governorates; indicating that as SOL increases by 1 percent in Frontier governorates, GGP increases too by 0.68 percent. All regional dummies are statistically significant and positive, signifying that these regions have a higher impact of lights on their GGP than Frontier governorates, as expected from these regions’ GGP. For instance, Cairo has a higher impact of lights on its GGP than Frontier governorates, on average. SOL elasticity of GGP in Cairo is higher than Frontier governorates by 0.27, which indicates roughly a unit elastic relation (0.95) between light intensity and GGP in Cairo. Also, according to governorate economic value added, Cairo has the highest impact of lights on its GGP than other regions; followed by Alexandria, Canal, Lower and Upper Egypt. Across all regressions, the year dummy variables are significant, except in 2010 and 2011. This suggests that for some years there is significant difference in satellite capturing data and the model succeeded in
accounting for that difference.
[image:10.595.70.524.97.363.2]Source: Calculated by Author
Figure 9. Actual vs. Predicted Real GGP, on Average, FY08-FY13
[image:11.595.84.514.79.303.2]Source: Calculated by Author
Figure 10. Actual vs. Predicted Real GDP, Overtime (FY08-FY13)
In addition, the predictive power of NTL at the disaggregate level suggests consequently its power at the aggregate level. This indicates, importantly, that also NTL can play a prominent role in predicting the economic performance at the national level. This is shown in figure 10 where actual and predicted real GDP have the same positive trend with near values and no statistical significant difference between them at 5 percent. This confirms what Sutton et al. (2007) stated that “spatial disaggregation of estimates dramatically improves aggregate national estimates” of GDP.
Hence, this paper offers a suitable complementary and not substitute tool in measuring economic performance in terms of economic value-added at both the national and sub-national levels. Its results are similar to Moursi and
Omar (2016)’s findings, which confirms the robustness of their findings and the suggested association between NTL and economic performance. Also, the paper suggests a way to overcome the problem of examining the relationship at the national level with 5 years, by estimating the relationship using the disaggregated GGP data.
6. Conclusions
[image:11.595.143.453.337.530.2]Kraay non-parametric technique to check the results’ robustness. In addition, the current study is the first to investigate the predictive power of NTL in estimating national GDP in Egypt using disaggregated GDP dataset.
Regional GDP are important for several reasons; such as identifying the source of national economic growth by region and by economic activity and the growth distribution across regions. It also helps individuals such as investors and employment-seekers to form expectations and make decisions where and what to invest, and at what scale of investment. It also helps identifying the level and extent of inequality and thereby the efforts needed to reduce it. Importantly, regional GDP data can update and adjust national GDP figures.
The paper concludes that the intensity of night lights captured by DMSP-OLS satellites can predict the economic activity of human beings measured by GGP in Egypt. Also, using GGP dataset, NTL is powerful in predicting national GDP. This result is similar to Moursi and Omar (2016), which signifies the robustness of their results.
This study affirms the importance of night lights data, especially for developing countries as they often suffer from deficient or absence of GDP data. NTL estimates of regional GDP could be the benchmark of official dataset when they are available. Also, if official data are unavailable, NTL can predict retroactively the historical values of regional GDP and forecast its future values to have timely frequent and consistent regional GDP estimate.
This paper paves the road for future research on the application of DMSP-OLS Satellite Night Light data on different socio-economic variables in Egypt. Studies on the association between lights and GDP by economic activity at the national and sub-national level are recommended. From this association, an estimation of the informal sector is very much recommended as there are no official statistics on its total contribution in the economy in most developing countries (Ghosh et al., 2009; and Keola and Tanaka, 2015). Also, the relation between light and population density, rural population, urbanization and desertification, are all interesting and needed topics by policymakers in the Egyptian economy.
REFERENCES
[1] Addison, Douglas M.; Stewart, Benjamin P. (2016). “Nighttime lights revisited: the use of nighttime lights data as a proxy for economic variables”, Policy Research Working Paper WPS7496
[2] Baguley, Thom S (2009). “Standardized or simple effect size: What should be reported?”. British Journal of Psychology. Vol. 100, Issue 3, pp. 603-17. https://www.researchgate.net /publication/23481657_Standardized_or_simple_effect_siz e_What_should_be_reported
[3] Bhandari, Laveesh; and Roychowdhury, Koel (2011).
“Night Lights and Economic Activity in India: A study using DMSP-OLS night time images”; Proceedings of the Asia-Pacific Advanced Network, Vol. 32, pp. 218-236.
[4] Bundervoet, Tom; et al. (2015). “Republic of Kenya - Bright lights, big cities: measuring national and sub-national economic growth from outer space in Africa, with an application to Kenya and Rwanda”, World Bank Group, Policy Research Working Paper, WPS7461
[5] Central Bank of Egypt, (2016). “Time Series Dataset”. http://www.cbe.org.eg/_layouts/xlviewer.aspx?id=/Time%2 0Series%20Documents/Investments/Investments%20By%2 0Economic%20Sectors/Investment_Annual.xls.xlsx&Defa ultItemOpen=1
[6] Chen, Xi; and Nordhaus, William D. (2011). “Using Luminosity Data as a Proxy for Economic Statistics”. Proc. Natl. Acad. Sci. USA 2011, 108, 8589–8594. 12.
[7] Croft, T.A. (1978). “Nighttime Images of the Earth from Space”. Scientific American, Vol. 239, pp. 68-79.
[8] Doll, Christopher; and Muller, Jan Peter (1999). “An evaluation of global urban growth via comparison of DCW and DMSP-OLS satellite data”. Proceedings of IEEE International Geoscience and Remote Sensing Symposium (IGARSS’99), pp. 1134-1136.
[9] Doll, Christopher; Muller, Jan-Peter; and Elvidge, Christopher D. (2000). “Nighttime imagery as a tool for global mapping of socioeconomic parameters and greenhouse gas emissions”. Ambio, Vol. 29, pp157-162.
[10]Doll, C.N.H, Muller, J-P., and Morley, J.G. (2006). “Mapping regional economic activity from night-time light satellite imagery”. Ecological Economics, Vol. 57, pp. 75-92
[11]Doll, Christopher (2008). “CIESIN Thematic Guide to Night-time Light Remote Sensing and its Applications”. Center for International Earth Science Information Network (CIESIN).
[12]Driscoll, J. C.; and A. C. Kraay (1998). “Consistent Covariance Matrix Estimation with Spatially Dependent Panel Data”. Review of Economics and Statistics 80, pp. 549–560.
[13]Ebener, Steeve, et al. (2005). “From Wealth to Health: Modeling the Distribution of Income per Capita at the Sub-national Level using Night-time Light Imagery”. International Journal of Health Geographics.
[14]Elvidge, Christopher D., et al. (1997). “Relation between Satellite-observed visible-near infrared emissions, population, economic activity, and electric power consumption”, International Journal of Remote Sensing, Vol. 18, pp. 1373-79.
[15]Elvidge, Christopher D., et al. (2009) “A Global Poverty Map Derived from Satellite Data, Computers & Geosciences”, 35(8), pp. 1652-1660.
[16]Elvidge, Christopher D., et al. (2014). “National Trends in Satellite Observed Lighting: 1992-2012”. Global Urban Monitoring and Assessment through Earth Observation, CRC Press, pp. 97-120.
Light Approach”. Institute of Development Economies, Discussion Paper, No. 531.
[21]Kulkarni, Rajendra, et al. (2011). “Revisiting Night Lights as Proxy for Economic Growth: A Multi-Year Light Based Growth Indicator (LBGI) for China, India and the U.S.”. GMU School of Public Policy Research Paper No. 2011-12
[22]Letu, Hisu, et al. (2010) “Estimating Energy Consumption from Night-Time DMSP/OLS Imagery after Correction for Saturation Effects”, International Journal of Remote Sensing, 31(16), pp. 4443-4458.
[23]Moursi, Tarek Abdelfattah and S. Omar, Noha (2016). “Detecting National and Sub-national Economic Performance Using Weather Satellite Picture Composites: The Case of Egypt”, Masters International Research and
Development Center (MIRDEC) MIRDEC
2016-Conference on Social, Economics, Business and Educational Science Budapest, Conference Proceedings, Hungary, 24-26 May, 2016; ISBN: 978-605-83117-0-1
[24]Small, Christopher; et al. (2011) “Spatial scaling of stable night lights”. Remote Sensing of Environment, Vol.115, Issue 2, pp. 269–280.
[25]Ministry of Planning (MoP). (2015). http://www.mop.gov.e g/MOP/MOPStat.aspx?ModID=2&stat=1
[26]NOAA-NGDC. (2015) Night-time lights of the World 2008-2013. Stable lights data set; Available from: http://www.ngdc.noaa.gov/dmsp/download_Night_time_lig hts_94-95.html
[27]Sutton, Paul, et al. (1997). “A Comparison of Nighttime Satellite Imagery and Population Density for the Continental United States”. Photogrammetric Engineering and Remote Sensing, 63(11), pp. 1303-1313.
[28]Sutton, P.C.; and Costanza, R. (2002). “Global estimates of market and non-market values derived from nighttime satellite imagery, landcover and ecosystem service valuation”. Ecological Economics, Vol. 41, pp. 509-527.
[29]Sutton, P.C.; Elvidge, Christopher; and Obremski, T.(2003). “Building and evaluating models to estimate ambient population density”. Photogrammetric Engineering and Remote Sensing, Vol. 69, No. 5, pp. 545–553.
[30]Sutton, Paul C., Christopher D. Elvidge, and Tilottama Ghosh (2007). “Estimation of Gross Domestic Product at Sub-national Scales Using Nighttime Satellite Imagery.” International Journal of Ecological Economics and Statistics 8(S07): 5–21.
[31]World Bank (2016). “World Development Indicators”. Accessed in 2016;https://databank.worldbank.org/data/sour