Munich Personal RePEc Archive
Research standards for the Italian young
academics: what has changed over the
last thirty years?
Birolo, Adriano and Rosselli, Annalisa
Dept of Engineering Management, University of Padua,
Dipartimento di Economia e Istituzioni, Università di Roma “Tor
Vergata
5 December 2009
Online at
https://mpra.ub.uni-muenchen.de/21368/
Research standards for the Italian young academics:
what has changed over the last thirty years?
*Birolo, Adriano
(University of Padua, Dept. of Management and Engineering) and
Rosselli, Annalisa
(University of Rome 2, Tor Vergata, Dept. of Economics and Institutions)
Abstract
In this paper the authors present the findings of their research on a vast database containing the relevant information on the scientific characteristics of the three cohorts of assistant professors recruited in Italy in the early 1980s, the 1990s and the first few years of the new millennium. Their first objective is to trace out the scientific profile of the assistant professor in the early 1980s and the changes that came about in the following twenty-five years due to general changes in the profession and in the specific conditions of the Italian academic market. The second aim is to see what turn in direction the scientific standard has taken for access to a career as a young professor of economics, the number and typology of publications, the fields of research.
Research standards for the Italian young academics: what has changed over the
last thirty years?
Adriano Birolo, Annalisa Rosselli1)
Keywords: evolution of the scientific standard, research output, “representative” economist, academic market for economists, evaluation.
JEL code: A11, A 14, B23, B41
1. Introduction
Taking as good the famous definition of economics attributed to Viner, “Economics is what economists do”, it is surprising to see how little the history of economics has addressed the matter of what economists actually do, above all outside the USA. The vast mass of data on research output which has recently become readily accessible has found little use other than compilation of classifications of excellence in the field of scientific journals or departments, and rather more rarely with respect to individuals (Backhouse et al. 1997). On the other hand, precious little study has been dedicated to the “representative” economist, who makes the backbone of the profession and who, if research is performed mainly in the universities, also moulds the future followers of the discipline.
The aim of this paper is to fill in some pieces missing from the picture, taking the case of Italy and con-centrating on the economist at the first level of the academic career, the “Researcher” (ricercatore)2).
Actually, our study -- which entailed construction of an extensive database on the publications of young economists -- serves a twofold purpose. The first is to trace out the scientific profile of the university Resear-cher at the beginning of the 1980s, and the change it has seen over the last 30 years3) as a result both of the
broad developments that have affected the professional figure of the economist, and of the specific conditions of the Italian academic market. In particular, we will seek to define how and in what direction scientific stan-dards have changed (number and typology of publications) for access to the first rung of the academic ladder4)
(section 2). The second aim is to see whether the progressive internationalisation of the profession, the increa-sing influence of the Anglo-Saxon way of organiincrea-sing research and the introduction of evaluation criteria taking into account the prominence achieved by publications have effectively modified the subjects and methods of research. Therefore we will go on to a qualitative analysis of developments in the contents of the publications using as control models the classification of papers published in the American Economic Review and the Eco-nomic Journal (section 3). In this respect the case of Italy may prove emblematic of the situation of countries that already had a well developed university system and national traditions when they began opening up to international competition.
1 University of Padua and University of Rome 2, Tor Vergata.
Earlier versions of this paper were discussed at the seminars within the research group on “The evaluation of economic research in a historical perspective: comparing methods and arguments “. We wish to thank the participants for their useful comments and criticisms. We are particularly grateful to Luigi Salmaso, for his advice on statistical matters, to Sara Pecchioli, for her precious help in building the database, to Cristina Marcuzzo, for continuous encouragement and advice. Financial support from the Italian Higher Education and Research Ministry is acknowledged.
2 The Italian ”Researcher” is at the same time something more and something less than the Anglo-Saxon Lecturer or Assistant Profes-sor: better in having a tenure, and worse in not necessarily teaching a course with total control over it, but helping with the teaching of others’ courses.
3 For the type of database used and for the fact-finding objectives we set ourselves, we applied simple tools of descriptive statistics.
4 In the literature we have tracked down only one example (Fishe 1998) of a study pursuing much the same end for those promoted full professorships in finance in a selected group of universities.
2. How many publications and where?
2.1 Who are the university Researchers in the field of economics
The figure of the Researcher was instituted in Italy in 1980, and has since seen hardly any change. In 1983 selection procedures were launched on the basis of a “competitive examination”. The selection commit-tee, consisting of three members, is chaired by a full professor, designated by the university for which the post has been announced and almost always belonging to the same Faculty. The other committee members, who come from other universities, formerly appointed by the Minister, are now elected by all the Italian academics in the same field. Over the last 10 years information regarding the availability of new posts has become widely accessible thanks to the Internet; at the same time the number of posts announced in the field of economics has been rising, mitigating competition. In fact, the yearly average number of Researchers appointed came to 21.9 in the period 1983-1990, 33.5 in the period 1991-98, and 49.0 in the period 1999-20075). And yet the flow has
never been uniform: indeed, the distribution of posts up for competition has been very uneven, as can be seen in fig. 2.1. The discontinuity in the flow of posts, which were decided upon by the Ministry of Education in the 1980s, has remained such even since a new law granted individual universities the faculty to manage and control the entire competitive procedure, from announcement to appointment, at the end of the 1990s.
In order to reconstruct the Researcher profile, we analysed the relevant competitive examinations held in three two-year periods at intervals of 10 years: 1984-85; 1994-95; and 2004-20056). The years chosen were
characterised by a considerable concentration of posts relative to the period, so that by analysing only 6 years out of 24 we were able to cover 30% of the total of the 884 Researchers recruited up to 2007.
The data on the winners were provided to us by the Ministry for the University as far as the period 1980-99 was concerned; for the following period we gleaned our data from the information available online in the official university recruitment site7). The list provided by the Ministry for the first years shows certain rather
5 Alongside the growth in the number of posts to be competed for we have seen an increasing number of economics Ph.D graduates
entering the academic market. This may possibly be a case in which the demand for university Researchers has not been independent of the supply.
6 The year is that in which the appointment of the Researcher took place.
odd gaps8), but it is evidently the most reliable source available. A previous study (Corsi 1999) based on in
-formation obtained laboriously from the Personnel Offices of the individual Universities inevitably has rather more limited data to show. In order to determine which competitive examinations concerned the field of eco-nomics, we made use of the official descriptor which must be indicated when a post is announced. We selected the descriptors - which have over time seen various changes - so as to include the whole range of economics in the strict sense, excluding the management sectors9). We grouped the competition sites into the three broad
geographical areas in which Italy is customarily divided : North, Centre, and South and Islands.
[image:5.595.102.490.579.679.2]The three cohorts of the winners show many points in common, although they vary somewhat in nume-rical terms, as shown in table 2.1.
TABLE 2.1 New recruitments
M F F/T Total
1984-5 37 21 36% 58
1994-5 58 22 27% 80
2004-5 93 39 29% 132
To begin with, the average age remains around 33 years, with slight signs of rising. In the 1984-85 co-hort it was 32.7 years, while by the latest it had risen to 33.310). Secondly, the percentage of successful women
remains higher in the South than the North, where it has remained steady throughout the period at around 30 percent. In the South, however, while remaining higher than elsewhere, the women's share shows a drop, so that at the national level it falls from the 36 percent of 1984-5 to little over 29 percent in the youngest co-hort. With no data on the geographical origin of the successful candidates, we cannot tell whether the better chances of success for women in the South depend on the practice, widely followed by southern families until relatively recently, of sending the ablest sons to the North to study, reserving the universities nearer by for the daughters.
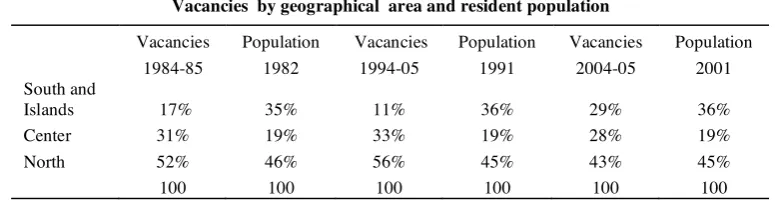
On the other hand, there are striking signs of change in the geographical distribution of posts subsequent to the extended autonomy of the universities, favouring the possibility to open positions of Researcher in the South (table 2.2). At the historical level, the imbalance noted in comparison with the resident population can be put down to the different distribution and scale of the universities in the various parts of Italy -- few and relatively small in the South, many, and some very large, in the Centre.
TABLE 2.2
Vacancies by geographical area and resident population
Vacancies Population Vacancies Population Vacancies Population
1984-85 1982 1994-05 1991 2004-05 2001
South and
Islands 17% 35% 11% 36% 29% 36%
Center 31% 19% 33% 19% 28% 19%
North 52% 46% 56% 45% 43% 45%
100 100 100 100 100 100
Career prospects are also decidedly better for the younger cohorts. Of the Researchers appointed in
8 For example, it does not include the name of one of the authors of this paper.
9 Initially all the fields of economics other than business economics came together under the one heading “group 20”. Subsequently they split up into 10 categories from P01A to P01J, then reduced to 6, labelled from SECS P01 to SECS P06.
10 The birthdates of the 2004-5 cohorts were drawn from the individual personal websites of the Researchers, and so are missing in about 50% of the cases.
1984-5, only 33 had arrived at the position of full professor 20 years later, while 10% had completely abando-ned the academic career. Of the Researchers appointed in 1994-5, on the other hand, only 10% had continued in the role, while 46.3% had been promoted to associate and 40% to full professorships. Again, of those ap-pointed in 2004-5, nearly 10% had already become associate professors by 2007. Thus the choices made in ear-lier periods do not appear to have found confirmation in the successive stages of the academic career. This can be interpreted in various ways: discouragement due to the scant chances of promotion marking the 1980s and 1990s; local preferences rewarding people with little motivation or aptitude; greater eccentricity in the 1980s as compared with the model subsequently prevalent. On the other hand, improved career prospects in recent years may possibly have encouraged many younger Researchers, already closer at the outset to the model of scholar prevalent at the international level, to take a truly committed approach to the academic career.
2.2 Scientific publications
We can obtain further information by reviewing the scientific publications of the successful candidates at the time of the competition. In order to construct the publication database, lacking the successful candida-tes’ “curricula vitae” we resorted to various bibliographic sources to track down their possible publications, divided into the categories of books, chapters of books, articles in scientific journals and working papers. The sources drawn upon were:
1) Econlit, the well-known electronic bibliography of the American Economic Association;
2) Essper ( http://www.biblio.liuc.it/essper/default.htm), which came into operation in 199611) and sifts
the Italian journals (i.e. those published in Italy, regardless of language) excluding only book reviews and working papers;
3) the OPAC catalogue (http://www.internetculturale.it/moduli/opac/opac.jsp), with which we were able to extend research to books and even small monographs (it gives the number of pages of each publication). OPAC covers all the publications appearing in the catalogue of the Servizio Bibliotecario Nazionale (SBN – National Library Service), the Italian library network including over 2900 libraries of the State, local bodies, universities and public and private institutions working in various fields of learning. In the SBN catalogue we find descriptions of documents acquired by the network libraries as from the 1990s or from the entry of individual libraries into the SBN, and descriptions drawn from the printed catalogues anterior to the 1990s. It is also to be borne in mind that according to Italian press law, a copy of every publication must be consigned to a National Library.
4) British Library catalogue, available online.
In view of the fact that selection committees may take into account, even if not officially, work presen-ted in manuscript form but in press, we extended our research to the first year subsequent to the appointment. Given that one year usually elapses between the announcement of the vacancy, when publications must be sub-mitted to the selecting committee, and the appointment of the successful candidate, we can reasonably assume that few publications can have escaped our attention. These are :
a) working papers which do not appear in our sources;
b) journal articles published two years or more after the announcement ; c) books and chapters in books brought out by small, non-Italian publishers;
d) works in languages other than Italian or English and published in foreign journals not included in Econlit.
This situation thus emerging is summarised in table 2.3. From the point of view of productivity, taking into consideration all the publications and all the successful candidates we find a distinct increase in the num-ber of publications in the two younger cohorts. The difference may in part be due to the fact that both Econlit
and OPAC are rather less reliable sources for the 1980s, when Econlit took a smaller number of journals into account, while in the case of OPAC some items may have been lost in transference from printed to electronic catalogues. Even confining the field solely to “active” Researchers, i.e. with at least one publication, there is still an appreciable increase in the number of works between the first and second cohorts, but hardly any dif-ference between the second and third. We might therefore be inclined to conclude that selection has become more meritocratic overtime, with an -- at least quantitative -- rise in benchmark.
TABLE 2.3
Productivity of successful candidates
1984-5 1994-5 2004-5
Total number of publications 111 305 567
Successful candidates 58 80 132
Publications per successful candidate, average 1,9 3,9 4,3
Successful candidates with at least 1 publication 41 69 122
Number of publication per successful candidate with at least 1
publication, average 2,7 4,4 4,6
As above, weighted average 2,5 4,0 3,9
As above, weighted average and working papers excluded 2,1 2,9 2,2
However, this difference is greatly reduced, almost to disappearing point, if we take two further factors into account. The first is a greater propensity for working in collaboration among the younger generations, who produce more co-authored works than the previous generations. Thus we found it appropriate to weight the publications by number of authors, assigning 0.7 when there are two authors and 0.4 for three or more. These weights were chosen with the consideration that collective work by its very nature calls for an additional activity of co-ordination, although the returns to scale may be increasing in qualitative terms. In other words, co-authored works may turn out better, but they take only a little less time than individual efforts12). Thus the
difference in number of publications for Researchers who have at least one proves somewhat less. The second factor is the inclusion of working papers. As we have extended research to cover publications over the entire calendar year after year, the working papers submitted as such at the time of the competitive exam will almost certainly have become publications and are therefore taken into account. By including the working papers we run the risk of duplication and taking into account publications of little worth or written after the term for submission of applications has expired13). With weighting and exclusion of working papers the differences are
appreciably reduced, with the result that no great difference in productivity is to be seen among the cohorts, apart from a slight increase in the 1994-95 cohort.
TABLE 2.4
Successful candidates with 0 publications
cohort North Centre South & Is. Total
1984-5 5 9 3 17
16,7% 50,0% 30,0% 29,0%
1994-5 5 5 1 11
11,1% 19,2% 11,1% 14,0%
2004-5 2 3 5 10
3,5% 8,1% 13,1% 7.6%
12 We are aware that we may thus be overrating the production in collaboration. However, if, following the convention, it had simply been divided by the number of co-authors, the results would have appeared only slightly less favourable to the younger cohorts, where the number of co-authored works is far higher.
13 In the most recent years, due also to the boost coming with large-scale adoption of modern information technologies, the series of working papers have multiplied and the Researchers of the younger cohorts have exploited all the possible advantages
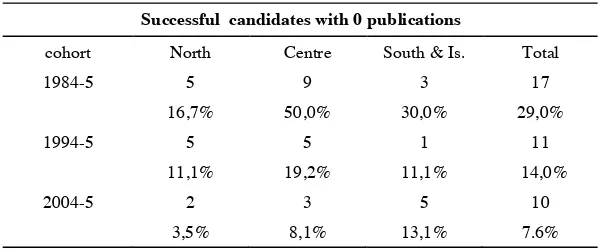
.
[image:7.595.147.447.588.714.2]The difference between the averages calculated for all the successful candidates and for only those who have at least one publication is greater for the earlier cohorts, which include a number of Researchers without publications. An apparent lack of publications may simply be due to deficiencies in the present online biblio-graphic databases. In any case, passing the competitive exam without any publications seems to have become more difficult, although not impossible. As table 2.4 demonstrates, nearly 8% of the successful candidates still make it, but with a large drop between 1984-5, when there was still no possibility of gaining a doctorate unless abroad, and 2004-5.
2.3 The numerical distribution of publications
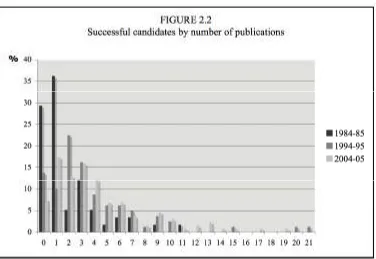
How do the Researchers fall into classes in terms of number of publications? For each cohort, how many of the Researchers publish little, and how many a lot?
The Researchers were grouped on the basis of having the same number of publications14). None of the
Researchers of the first cohort has more than 11 publications, the majority falling into the zero or one publica-tion class. The situapublica-tion appears very different for the following cohorts, the distribupublica-tion curve peaking around two publications to make a fairly steady descent to the threshold of 20 publications (figure 2.2)
The change in distribution of Researchers by number of publications between one cohort and another can better be appreciated grouping the Researchers into four broad numerical classes of publication, 0-3, 4-7, 8-11, 12-21. The results are set out in table 2.5.
TABLE 2.5
Successful candidates by number of publications
Number of publications 1984-85 1994-95 2004-05
0 - 3 82,8 62,5 53,8
4 - 7 13,8 26,3 29,6
8 - 11 3,4 7,5 9,8
12 -21 0,0 3,8 6,8
Concentration index 0,9 0,6 0,5
Concentration index: ratio between successful candidates in the largest group and total. Maximum value = 1 , minimum = 0.25
[image:8.595.112.488.295.554.2]In the first cohort 82% of the Researchers fall into the class of 0-3 publications. Ten years later the percentage had dropped to 62 percent, and after another ten years to 53 percent, thus with a reduction of 35 percent. Consequently the 1994-95 and 2004-05 cohorts come above the original cohort, for all the classes exceeding the first, following very similar trends markedly distinct from the first.
2.4 “Prominence” achieved
[image:9.595.181.415.315.442.2]While the average productivity, albeit “adjusted”, seems to have changed little over the years, if we go on to look at the publications listed by Econlit, the change from one cohort to another is quite evident in terms of prominence achieved. As can be seen in table 2.6, the percentage of successful candidates with at least one publication appearing in Econlit nearly doubles between the 1980s and the 1990s (but we must also bear in mind that the Econlit coverage was extended in those years), increasing even more for the youngest genera-tion.
TABLE 2.6
Successful candidates with at least 1 publication appearing in Econlit, absolute values and percentages
M F Total gender gap
1984-5 10 6 16
27,0% 28,6% 27,6% -1,5%
1994-5 30 12 42
51,7% 54,5% 52,5% -2,8%
2004-5 71 22 93,0
76,3% 56,4% 70,5% 19,9%
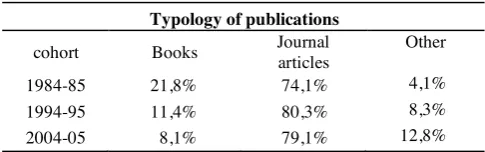
An interesting difference is to be seen between the second and third cohort. While no significant diffe-rence appeared in the behaviour of men and women up to 1994-5, the last cohort shows a striking gender gap. The men seem to develop a flair for grasping the rules of the game, and by now three out of four enter into the fray with at least one publication in Econlit. In fact, the percentage of those with a book among their pu-blications drops sharply: if papers had always represented the bulk of the pupu-blications, the books plunge to 8.1 percent (see table 2.7), replaced by contributions to collected volumes, (classified as “other”). The percentage with at least one book behind them, even though only as co-author, went from the 26 percent of the successful candidates in 1984-85, when in Italy doctorates had yet to be brought in, to 29 percent in 1994-5, when the doctorate thesis still took the form of a monographic research, and then to the 17 percent of the last generation, for which the doctorate thesis is conceived as a collection of papers.
TABLE 2.7
Typology of publications
cohort Books Journal
articles
Other
1984-85 21,8% 74,1% 4,1%
1994-95 11,4% 80,3% 8,3%
2004-05 8,1% 79,1% 12,8%
[image:9.595.178.421.667.743.2]3. The scientific profile of the Italian Researcher
3.1 Comparison with the “American Economic Review” model
An even more interesting problem, still harder to solve, is to trace out the cultural profile of the Resear-cher. As they are young economists, supposing that Keynes was right in asserting that “in the field of economic and political philosophy there are not many who are influenced by new theories after they are twenty-five or thirty years of age”(Keynes 1936, 383-4), then investigation into the Researcher’s cultural profile should cast light on future trends in the field. Each will be wanting to reap the fruits of their investment in human capital, and will hardly be likely to abandon research methodologies, if not areas of investigation, cultivated in their youth.
We have concentrated on a concern raised above all recently in the course of discussion on the criteria to evaluate economic research according to “objective” parameters, as required by an increasing number of agencies supplying funds, and the public ones in particular. One cannot help wondering whether a “monistic” view of economics is being emphatically imposed , to the effect that the way to funding and career progress is only through recognition of one established research model. Pluralism in the methods, subjects and results of research would thus be sacrificed, and with them the chances for the discipline to embrace real innovations (Artoni 2004, 2007; Bardhan 2003; Gillies 2006, 2008; Hodgson and Rothman 1999; Lee 2007; Lee and Har-ley 1997, 1998; Oswald 2007; Sen 2002; van Dalen 2007).
The question we set ourselves, therefore, is whether the Researchers of the youngest cohort answer more than those of the earlier ones to the need to conform to a model of economist such as emerges from the syllabuses of the major US universities, and whether the range of subjects and methods has effectively been reduced.
Arriving at an answer is no easy task. The first stumbling block is that any attempt at classification – whether of contents or methods – is inevitably dated, reflecting the approach to economics at that particular time. Earlier attempts to identify the “fads in economic writing” (Stigler 1965, Bronfenbrenner 1966) had already come to this conclusion, which is borne out by any, even superficial, examination of the items appea-ring in the classifications historically adopted by the profession. As for the subjects of research, the American Economic Association, for example, published from 1886 to the 1960s an Index of Economic Journals with over 20 headings, also including “War and defense economics” and “Consumer economics” – areas which no economist would now consider worth headings of their own – while on the other hand we also find subjects that have now become disciplines in their own right, like “Population”. In the 1970s the editors of the Econo-mic Journal offered in their annual report a table in which the articles published were grouped according to the subjects addressed15). Among the classification headings there appeared “Distribution” and “Theory of the
rate of interest” set at the same level as “Money and banking” and “Economic development”. The Journal of Economic Literature itself, which provides the now dominant classification adopted also in this paper, felt the need to change the number of headings, raising it from 10 to 20 in 1991, in response to the changes that had come about in the discipline. To this is to be added the consideration that, under the same heading, what had been classified twenty-five years ago as microeconomics would not necessarily be placed as such today.
No less challenging are attempts to classify the method of research. The very division of papers between “theoretical” and “empirical” itself clashes with variable opinions as to what effectively constitutes a theo-retical or empirical paper. Would an “analysis without any mathematical formulation and without data”, 12 examples of which the AER published between 1977 and 1981 (Morgan 1988, 160), find room in any journal of economics today? And does the paper model defined PME (Holub 1989), i.e. Problem - Model –
statistical support, prevalent by far in the 1990s, still represent the classical typology of empirical analysis? For this reason we have not attempted diachronic classification, which would inevitably have led us to view the past through today’s lenses, but preferred to make comparison for each period with a model of the same period. Thus we compare the scientific profile of the Italian Researcher with two standard models, one drawn from the papers published in the same years in the American Economic Review (AER), in this section, and one from those published in the Economic Journal (EJ), in the following section.
The choice of the American Economic Review (AER) as container of research subjects from which to draw the standard profile of the economist of the period was made for fairly obvious reasons. AER is the generalist economic journal with the widest circulation in the world; it is the official organ of the American Economic Association, the leading US “learned society” in the field of economics – it is not a mouthpiece for a school of thought but embraces orthodox economic research, albeit conducted according to the prevalent US standards, in its various forms. Hence the AER shows reliable performance over time in attesting to the evo-lution of themes and methods prevalent in economic research. Finally, it is also sufficiently international in its approach, receiving contributions by authors from various parts of the world outside the USA, although they tend to be authors with “USA based” grounding in any case16).
For the purpose of comparison use was made of nine years of the American Economic Review17), distri
-buted in three-year periods: 1983-85, 1993-95 and 2003-05. A database was constructed containing the articles of each year ordered on the basis of the JEL descriptor with which each article appeared in Econlit18). Included
in the same database are the publications of Italian authors of the 1984-85, 1994-95 and 2004-05 cohorts listed in Econlit on the basis of the first respective JEL descriptors, chosen by the authors19). The first descriptor
re-flects, if not the effective content of the article, at any rate the category the authors wish to see them accorded. For the sake of completeness, although it means introducing a somewhat arbitrary element, we have also inclu-ded in the database the publications of each Researcher that do not appear in Econlit – mainly articles in Italian, monographs, contributions to volumes and working papers. Each publication is provided with a descriptor on the evidence of the title and abstract or, in doubtful cases, determined by examining the publication20).
In the first overview table (table 3.1) we indicate for each cohort the composition of papers appearing in
16 Some data on this point are to be found in Hodgson and Rothman (1999).
17 Excluded from the calculation are the items in “Papers and Proceedings”, being extraneous to the normal refereeing process.
18 For in-depth study of the descriptors, classes and subclasses, see the site <<http://www.Econlit.org/subject_descriptors.html>>. The-re have been 20 since 1991; pThe-reviously theThe-re weThe-re 10. For the The-record, the titles of the descriptors prior to 1990 aThe-re set out below: 000 General Economics; Theory; History, Systems. 100 Economic Growth; Development; Planning; Fluctuations. 200 Quantitative Economic Methods and Data. 300 Domestic Monetary and Fiscal Theory and Institutions. 400 International Economics. 500 Admi-nistration; Business Finance; Marketing; Accounting. 600 Industrial Organization; Technological Change; Industry studies. 700 Agri-culture; Natural Resources. 800 Manpower; Labor; Population. 900 Welfare Programs; Consumer Economics; Urban and Regional Economics.
And, as from 1991:
A - General Economics and Teaching. B - Schools of Economic Thought and Methodology. C - Mathematical and Quantitative Me-thods. D – Microeconomics. E - Macroeconomics and Monetary Economics. F - International Economics. G - Financial Economics. H - Public Economics. I - Health, Education, and Welfare. J - Labor and Demographic Economics. K - Law and Economics. L - Industrial Organization. M - Business Administration and Business Economics; Marketing; Accounting. N - Economic History. O - Economic Development, Technological Change, and Growth. P - Economic Systems. Q - Agricultural and Natural Resource Economics; Envi-ronmental and Ecological Economics. R - Urban, Rural, and Regional Economics. Y - Miscellaneous Categories. Z - Other Special Topics.
19 Some papers, even in the most recent cohort, appear in Econlit without descriptor on account of the editorial policy of the journal in which they appeared, which did not require indication of at least one Econlit descriptor. In the first cohort 8 papers out of 26 are without descriptor, in the second 15 out of 101, in the third 9 out of 244. We assigned a descriptor on our own judgement on the basis of the content of the paper.
the AER sorted on the basis of their first JEL descriptor, and with the same criterion the composition of the Re-searchers’ publications found in Econlit. We then added a column with the composition of all the Researchers publications, those in Econlit being added to the others – the majority – identified in the remaining bibliogra-phic sources indicated in the previous section21).
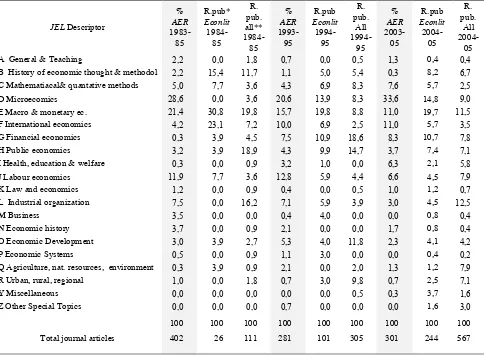
[image:12.595.64.548.206.564.2]The data emerging from the AER columns of Table 3.1 are the areas of economic research prevailing in the three-year period 1983-85 and the evolution this model showed in the following two decades.
TABLE 3.1
Subjects of the AER articles and of the Italian Researchers’s publications by JEL descriptor
JEL Descriptor
% AER 1983-85 R.pub* Econlit 1984-85 R. pub. all** 1984-85 % AER 1993-95 R.pub Econlit 1994-95 R. pub. All 1994-95 % AER 2003-05 R.pub Econlit 2004-05 R. pub. All 2004-05
A General & Teaching 2,2 0,0 1,8 0,7 0,0 0,5 1,3 0,4 0,4
B History of economic thought & methodol 2,2 15,4 11,7 1,1 5,0 5,4 0,3 8,2 6,7
C Mathematiacal& quantative methods 5,0 7,7 3,6 4,3 6,9 8,3 7,6 5,7 2,5
D Microecomics 28,6 0,0 3,6 20,6 13,9 8,3 33,6 14,8 9,0
E Macro & monetary ec. 21,4 30,8 19,8 15,7 19,8 8,8 11,0 19,7 11,5
F International economics 4,2 23,1 7,2 10,0 6,9 2,5 11,0 5,7 3,5
G Financial economics 0,3 3,9 4,5 7,5 10,9 18,6 8,3 10,7 7,8
H Public economics 3,2 3,9 18,9 4,3 9,9 14,7 3,7 7,4 7,1
I Health, education & welfare 0,3 0,0 0,9 3,2 1,0 0,0 6,3 2,1 5,8
J Labour economics 11,9 7,7 3,6 12,8 5,9 4,4 6,6 4,5 7,9
K Law and economics 1,2 0,0 0,9 0,4 0,0 0,5 1,0 1,2 0,7
L Industrial organization 7,5 0,0 16,2 7,1 5,9 3,9 3,0 4,5 12,5
M Business 3,5 0,0 0,0 0,4 4,0 0,0 0,0 0,8 0,4
N Economic history 3,7 0,0 0,9 2,1 0,0 0,0 1,7 0,8 0,4
O Economic Development 3,0 3,9 2,7 5,3 4,0 11,8 2,3 4,1 4,2
P Economic Systems 0,5 0,0 0,9 1,1 3,0 0,0 0,0 0,4 0,2
Q Agriculture, nat. resources, environment 0,3 3,9 0,9 2,1 0,0 2,0 1,3 1,2 7,9
R Urban, rural, regional 1,0 0,0 1,8 0,7 3,0 9,8 0,7 2,5 7,1
Y Miscellaneous 0,0 0,0 0,0 0,0 0,0 0,5 0,3 3,7 1,6
Z Other Special Topics 0,0 0,0 0,0 0,7 0,0 0,0 0,0 1,6 3,0
100 100 100 100 100 100 100 100 100
Total journal articles 402 26 111 281 101 305 301 244 567
*publications listed in Econlit; ** all publications, listed and not listed in Econlit
In the three-year period 1983-85 the descriptor of most weight (28%) is “D”, microeconomics, followed by “E”, macroeconomics (21%). Together they cover half the papers appearing in the AER in the three-year period. The other descriptors of some weight are “J”, labour economics (12%) and “L”, industrial organiza-tion (7%). Other descriptors later to become “weighty”, like “F” (internaorganiza-tional economics) and “G” (financial economics) show very low figures. In the three-year period 1993-95 microeconomics, while remaining the area with the relatively greater weight (20%), shows rather less importance. Such is also the case of macroe-conomics, which slips down to 15%. These two descriptors together add up to 35% of the papers published. Of growing importance are international economics (from 4% to 10%) and the financial economics (from 0.25% to 7%). Both labour economics and industrial organization maintain the weight of the previous decade.
The last three-year period shows sharp growth in microeconomics (from 20% to 33%) while macroeconomics declines, losing half the weight of the previous 20-year period (from 21% to 10%), possibly as a consequence of the decline of economic policies using the traditional tools of monetary and fiscal measures in the agendas of academic economists. Microeconomics and macroeconomics together cover 43% of the papers published, an increase over the previous decade accounted for, however, by the performance of microeconomics alone. International economics (10%) and the financial economics (from 7% to 8%) confirmed the level of impor-tance already achieved in the previous decade. Sharp drops are shown by labour economics and industrial organization, losing half their weight (respectively from 13% to 6% and from 7% to 3%). A reasonably likely explanation could be that in both these areas the ever wider adoption of Game theory took the upper hand over content, and that an appreciable portion of works in these areas fell into microeconomics pure and simple, and into the area of mathematical methods (descriptor “C”). As interpreted by the AER over a 20-year span, eco-nomics seems largely to be the discipline of individual choices and optimization methods22).
[image:13.595.94.508.323.723.2]How much of this model is reflected in the publications of the Italian Researchers? The figures in table 3.1 appearing in the second and third columns of each cohort offer initial indication.
TABLE 3.2
“Specialization” and “despecialization” of the Italian Researchers’s publications relatively to the American Economic Review
by JEL descriptor
(%R 1984-85 - %
AER 1983-85)/SD
(% 1994-95 - %
AER 1993-95)/SD
(%R. 2004-05 - %
AER 2003-05)/SD
JEL Descriptor Econlit
pub.
All pub.
Econlit pub
All pub
Econlit pub.
All pub A General & Teaching -0,2 -0,1 -0,2 0,0 -0,2 -0,1
B History of economic thought & methodology 1,4 1,2 1,1 0,7 1,4 0,9
C Mathematical& quantitative methods 0,3 -0,2 0,8 0,7 -0,3 -0,7
D Microeconomics -3,1 -3,2 -2,0 -2,0 -3,4 -3,5
E Macro & monetary ec. 1,0 -0,2 1,2 -1,1 1,6 0,1
F International economics 2,1 0,4 -0,9 -1,2 -0,9 -1,1
G Financial economics 0,4 0,5 1,0 1,8 0,4 -0,1
H Public economics 0,1 2,0 1,6 1,7 0,7 0,5
I Health, education & welfare 0,0 0,1 -0,6 -0,5 -0,8 -0,1
J Labour economics -0,5 -1,1 -2,0 -1,3 -0,4 0,2
K Law and economics -0,1 0,0 -0,1 0,0 0,0 0,0
L Industrial organization -0,8 1,1 -0,3 -0,5 0,3 1,4
M Business -0,4 -0,4 1,1 -0,1 0,2 0,1
N Economic history -0,4 -0,4 -0,6 -0,3 -0,2 -0,2
O Economic Development 0,1 0,0 -0,4 1,0 0,3 0,3
P Economic Systems -0,1 0,1 0,6 -0,2 0,1 0,0
Q Agriculture, natural resources, environment 0,4 0,1 -0,6 0,0 0,0 0,9
R Urban, rural, regional -0,1 0,1 0,7 1,5 0,3 0,9
Y Miscellaneous 0,0 0,0 0,0 0,1 0,6 0,2
Z Other Special Topics 0,0 0,0 -0,2 -0,1 0,3 0,4
The last row in table 3.1 indicates the number of publications examined, papers in the case of the AER and publications in the broad sense in the case of the Researchers. We observe that the total publications of the Researchers grow over fivefold between the first and third cohort, but almost 10 times those included in Econlit, a point already discussed in the previous section but worth recalling to underline the growing external visibility achieved by the average Researcher, and, with it, the soundness of the comparisons we develop.
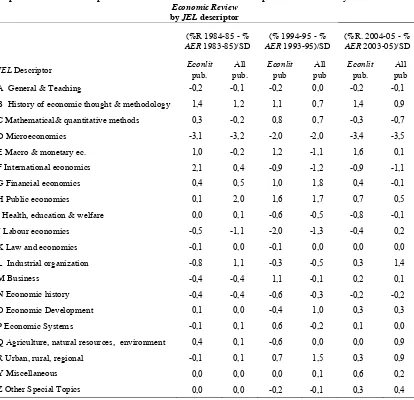
It is, however, table 3.2 that offers an unequivocal measure of the degree to which the Italian model differs from the AER model. In this table, the differences are calculated between the composition of the Re-searchers’ publications, distinguishing those appearing in Econlit from the total, and the composition of the AER papers. The values in the table limit the dimension effect in the differences between the compositions of the Researchers’ publications and the AER papers through normalisation by standard deviation23). Thus can be
seen the weight of Italian specialisation (positive values and equal to, or greater than one) or despecialisation (negative values and equal to, or less than one) as compared with the AER model. The Italian Researchers’ publications diverge sharply for descriptor “B” (history of thought and methodology), above all in the first cohort. In the second cohort specialisation is less pronounced, but again looms large in the third. Thus we see an evident specificity in Italian economic research into the history of thought. An interesting point is that the widest divergence appears with the more prominent publications, those in Econlit, evidencing the recognisabi-lity from outside of this Italian specificity and the capacity to take a commanding position in the international debate in this field.
Particularly glaring is the despecialisation for descriptor “D”, microeconomics, tempered only by the figure for the second cohort. In table 3.2 the highest absolute values are seen in the row corresponding to descriptor “D”. This despecialisation increases over time, the values of the last cohort exceeding those of the first, blithely challenging academic fashions. It may be the result of a tradition in Italian economic culture, de-veloped in the 1960s and 1970s with the emphasis on matters of macroeconomics and development economics, reflected and persisting -- unconsciously even -- in the younger generations despite the “American lessons” many apprentice Researchers were immersed in.
Descriptor “E”, macroeconomics, shows results for the publications included in Econlit diverging from the others. For the former, specialisation is seen to be positive and growing over time; it is negative for the other publications, with less international prominence.
For International economics, descriptor “F”, specialisation is very pronounced for the Econlit publica-tions of the first cohort, probably reflecting the Italian and European debate of those years on exchange rates, balance of payments adjustments, devaluation and so forth. In the following two cohorts the sign changes from plus to minus and despecialisation emerges, accentuated by the non-Econlit component of the publications.
Specialisation in industrial organization, descriptor “L”, appears for the non-Econlit publications in the first and third cohort, but not in the second. This is the result of publications tending largely to domestic themes finding reception above all in national containers.
In the two most recent cohorts there emerges an Italian specialisation in regional economics, descriptor “R”, generated by the non-Econlit component of the publications.
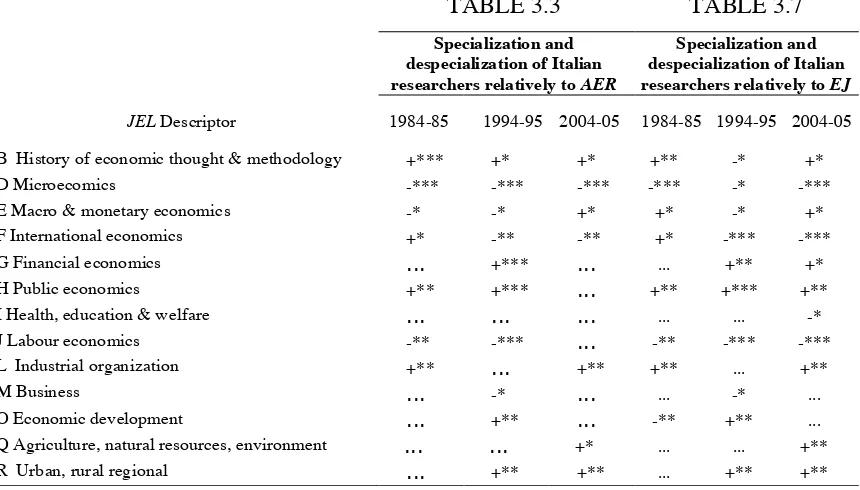
Table 3.3 offers a qualitative overview of the results. The positive or negative sign indicates specialisa-tion or despecialisaspecialisa-tion if the corresponding values fall outside the interval (-1,1). The number of superscript stars shows the degree of specialisation (despecialisation). This is “high” if specialization holds for both Econlit and not-Econlit publications and for the publications added together, “medium “if it holds for either the Econlit or the not-Econlit publications in such a degree that also the publications added together appear specialized, “low” in the opposite case.
Ultimately, the two lines of strong continuity are specialisation in the history of thought and in
me-23 The standard deviation is to be understood as a measure of the eccentricity in distribution of the Researchers’ publications in rela
thodology, and the particularly pronounced despecialisation in microeconomics, the latter calling for further investigation if it is to be accounted for.
TABLE 3.3
Specialization and despecialization of Italian researchers relatively to AER
JEL Descriptor 1984-85 1994-95 2004-05
B History of economic thought & methodology +*** +* +*
D Microecomics -*** -*** -***
E Macro & monetary economics -* -* +* F International economics +* -** -** G Financial economics ... +*** ...
H Public economics +** +*** ...
I Health, education & welfare ... ... ...
J Labour economics -** -*** ...
L Industrial organization +** ... +**
M Business ... -* ...
O Economic development ... +** ... Q Agriculture, natural resources, environment ... ... +* R Urban, rural regional ... +** +**
+ = specialization; - = despecialization ; number of stars = high, medium, low level
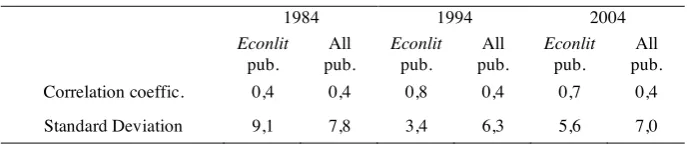
Over and above the differences by descriptor of the Italian and AER models, can we arrive at a general measure of the distance between the two models? To this end we compared for each cohort the vectors of publication composition with the vector of the composition of AER articles and formulated two indexes, sum-marised in table 3.4.
TABLE 3.4
Indicators of similarity between Italian Researchers and AER
1984 1994 2004
Econlit pub.
All pub.
Econlit pub.
All pub.
Econlit pub.
All pub.
Correlation coeffic. 0,4 0,4 0,8 0,4 0,7 0,4
Standard Deviation 9,1 7,8 3,4 6,3 5,6 7,0
The statistical indicators are extremely simple and readily grasped. The first is the linear coefficient of correlation. It proves positive in all cases, its value growing over time, indicating a reduction in the distance between the Researchers’ publication vectors and the AER vectors. The interesting point here is that in the second cohort the coefficient of correlation measured on the Econlit publications makes a great leap towards unity, not followed by the coefficient calculated on all the publications, which remains almost the same as of the first cohort. In the 1994-95 cohort the Italian “internationally oriented” model shows a striking adjustment to the AER model, taken as standard. The non-Econlit publications, on the other hand, perform a powerful braking function. This move towards international uniformity becomes, however, once again questionable -- albeit not to a drastic degree -- in the third cohort. The coefficient of correlation on Econlit publications slides slightly back, but the overall coefficient, taking into account publications that do not appear in Econlit, stands at a level only slightly above that of the first cohort. The conclusion is that the less “prominent” publications -- those not in Econlit -- continue to hold the Italian model firmly anchored to that of the origins, i.e. of the first cohort.
oc-curs in the transition from the 1984-85 cohort to that of 1994-95. Rather less sharp is the fall in the standard deviation calculated on publications not appearing in Econlit in the transition from the first to the second co-hort, offering further confirmation of the fact that the publications not in Econlit make a decisive contribution to maintaining the difference between the Italian and AER models.
3.2 Comparison with the “Economic Journal” model
We felt it worthwhile to extend analysis to see if the typology of scientific interests of the Italian Re-searchers reflected only national specificities or, rather, a view to the international scene – not so much to the other side of the Atlantic as to the European picture, with the UK model taken as a reference point. To verify this hypothesis we repeat for the Economic Journal (EJ), with the same characteristics and specifications, the exercise already performed with the American Economic Review.
Although over a third of the articles were still by British authors in the 1980s, the Economic Journal has always shown a great degree of openness towards the rest of the world and independence in its editorial policy. Is this enough to conclude that the Economic Journal editorial policy differs significantly from that of the AER?
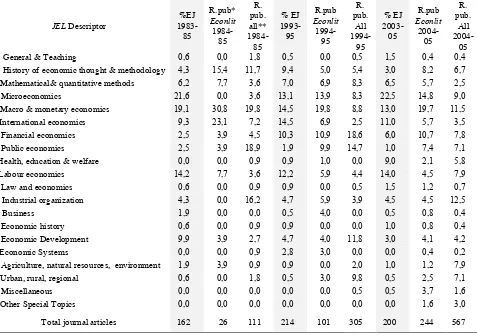
[image:16.595.69.546.390.725.2]Table 3.5 differs from 3.1 only in the columns headed EJ in the three periods considered. (The data on the Italian Researchers’ publications remain, of course, unchanged).
TABLE 3.5
Subjects of the EJ articles and of the Italian Researchers’s publications by JEL descriptor
JEL Descriptor
%EJ 1983-85 R.pub* Econlit 1984-85 R. pub. all** 1984-85 % EJ 1993-95 R.pub Econlit 1994-95 R. pub. All 1994-95 % EJ 2003-05 R.pub Econlit 2004-05 R. pub. All 2004-05 A General & Teaching 0,6 0,0 1,8 0,5 0,0 0,5 1,5 0,4 0,4 B History of economic thought & methodology 4,3 15,4 11,7 9,4 5,0 5,4 3,0 8,2 6,7 C Mathematical& quantitative methods 6,2 7,7 3,6 7,0 6,9 8,3 6,5 5,7 2,5 D Microeconomics 21,6 0,0 3,6 13,1 13,9 8,3 22,5 14,8 9,0 E Macro & monetary economics 19,1 30,8 19,8 14,5 19,8 8,8 13,0 19,7 11,5 F International economics 9,3 23,1 7,2 14,5 6,9 2,5 11,0 5,7 3,5 G Financial economics 2,5 3,9 4,5 10,3 10,9 18,6 6,0 10,7 7,8 H Public economics 2,5 3,9 18,9 1,9 9,9 14,7 1,0 7,4 7,1 I Health, education & welfare 0,0 0,0 0,9 0,9 1,0 0,0 9,0 2,1 5,8 J Labour economics 14,2 7,7 3,6 12,2 5,9 4,4 14,0 4,5 7,9 K Law and economics 0,6 0,0 0,9 0,9 0,0 0,5 1,5 1,2 0,7 L Industrial organization 4,3 0,0 16,2 4,7 5,9 3,9 4,5 4,5 12,5 M Business 1,9 0,0 0,0 0,5 4,0 0,0 0,5 0,8 0,4 N Economic history 0,6 0,0 0,9 0,9 0,0 0,0 1,0 0,8 0,4 O Economic Development 9,9 3,9 2,7 4,7 4,0 11,8 3,0 4,1 4,2 P Economic Systems 0,0 0,0 0,9 2,8 3,0 0,0 0,0 0,4 0,2 Q Agriculture, natural resources, environment 1,9 3,9 0,9 0,9 0,0 2,0 1,0 1,2 7,9 R Urban, rural, regional 0,6 0,0 1,8 0,5 3,0 9,8 0,5 2,5 7,1 Y Miscellaneous 0,0 0,0 0,0 0,0 0,0 0,5 0,5 3,7 1,6 Z Other Special Topics 0,0 0,0 0,0 0,0 0,0 0,0 0,0 1,6 3,0
Total journal articles 162 26 111 214 101 305 200 244 567
*publications listed in Econlit; ** all publications, listed and not listed in Econlit
If we look at the composition of the EJ publications, the only relevant divergences from the AER model are:
a) a “mild” and by no means overwhelming predominance of microeconomics.
Microeconomics (“D”) is the “pivot” descriptor for the EJ, but with a somewhat less marked prevalen-ce than in the AER. In the first period its weight is below the corresponding AER weight (21.6% as against 28.6%), closely followed by the macroeconomic descriptor (“E”) with 19.1%. In the second, with 14.5% ma-croeconomics eventually overtakes mima-croeconomics, which falls to 13%. In the third period mima-croeconomics takes the lead once again, rising to 22.5%, but at any rate standing well below the peak of 33.5% it reaches in AER.
b) the weight of the history of thought and methodology (“B”) is small in three cohorts, but not insigni-ficant, as was the case with the AER model. In the first period the history of thought is in seventh position in terms of number of articles published; in the second it rises to sixth position, with a percentage of 9.4%. The subsequent drop is sharp, to 3% (but in the AER the history of thought dwindles almost completely away, with a mere 0.33%) -- a sign of the changing times, but perhaps also of the editorial policy of the journal24).
c) International economics and labour economics have considerable weight in the EJ model, showing no significant dissimilarity with the AER model, with the exception of the years 1983-5. This is a period of great turbulence on the currency markets, with violent impact -- not very differently from the other countries of continental Europe -- on a relatively small country like the United Kingdom. The situation is also evidently reflected in the economic research that finds prominence in the EJ, which still dedicates its space largely to Anglo-Saxon scholars. In the third cohort the weight of international economics falls, sinking back to the AER level. Comparison between the AER and EJ models is summarised in table 3.6.
TABLE 3.6
EJ and AER: how much are they alike?
EJ – AER 1983-85
EJ – AER 1993-95
EJ – AER 2003-05 Correlation
coefficient 0,9 0,8 0,9
Standard
deviation 3,0 3,1 3,3
Despite the differences pointed out above, the summary indicators offer a picture showing evident si-milarity. The correlation coefficient is practically the same, with very high value in the first and third cohort. Only in the second cohort is the closeness reduced with the decreased weight of microeconomics and the growth in weight of the history of thought. The standard deviation shows a very low value in the three cohorts, evidencing very limited dissimilarity. Paradoxically, the dissimilarity seems to increase, albeit very slightly, in the third cohort. Thus the hypothesis we started from, namely that the EJ, a generalist journal, differed signifi-cantly from the AER model, is to be rejected.
The differences are there, but not so marked as to differentiate greatly the two models in any of the three periods examined.
Given this state of affairs, we should not expect results very different from those emerging from com-parison with the AER model in the specialisation by themes of the Italian Researchers’ publications in compa-rison with the EJ model.
Table 3.7, to be compared with the corresponding table 3.3, brings out quite clearly our specialisation pattern. Compared with the AER model, the differences are evidently limited, most of them concentrated in the second cohort. It was, then, in the early 1990s that a change in the model for the way of doing research – both
24 Hey, who took over as main editor in 1987, observed with satisfaction in 1989 that he had introduced a “marked change” in the editorial policy of the journal (Hey 1989, 210)).
contents and methods – took place in Italy.
TABLE 3.3
TABLE 3.7
Specialization and despecialization of Italian researchers relatively to AER
Specialization and despecialization of Italian researchers relatively to EJ
JEL Descriptor 1984-85 1994-95 2004-05 1984-85 1994-95 2004-05
B History of economic thought & methodology +*** +* +* +** -* +*
D Microecomics -*** -*** -*** -*** -* -***
E Macro & monetary economics -* -* +* +* -* +*
F International economics +* -** -** +* -*** -***
G Financial economics ... +*** ... ... +** +*
H Public economics +** +*** ... +** +*** +**
I Health, education & welfare ... ... ... ... ... -*
J Labour economics -** -*** ... -** -*** -***
L Industrial organization +** ... +** +** ... +**
M Business ... -* ... ... -* ...
O Economic development ... +** ... -** +** ...
Q Agriculture, natural resources, environment ... ... +* ... ... +**
R Urban, rural regional ... +** +** ... +** +**
+ = specialization; - = despecialization ; number of stars = high, medium, low level
Table 3.8, like table 3.4, shows two summary indicators of similarity between the Researchers’ publica-tions and the EJ model.
TABLE 3.8
Indicators of similarity between the publications of the Italian Researchers and EJ
1984 1994 2004
Econlit pub.
All pub.
Econlit pub.
All pub.
Econlit pub.
All pub.
Correlation coeffic. 0,6 0,4 0,8 0,4 0,7 0,5
Standard Deviation 7,4 7,2 3,5 5,9 4,5 5,3
The coefficient of correlation grows with transition from the first to the second cohort. It shows con-siderable growth in terms of the Econlit component of the publications, but hardly at all for the “domestic” publications. Thus the most prominent publications drive research in economics towards the model that is gai-ning ground in the Anglo-Saxon academic markets, on both sides of the Atlantic. Transition to the third cohort sees the picture becoming stable. The diminished distance between the coefficient measured on Econlit and the coefficient calculated for the total of publications is a sign that the domestic publications are adjusting to the EJ model, which is moreover very close to the AER model.
A somewhat similar interpretation can be made in the case of the standard deviation. Transition to the second cohort sees a very strong drive towards the EJ model, particularly marked for the Econlit publications, far less for the others. The domestic publications still exert a braking action. In the third cohort the standard deviation for Econlit publications shows a slight rise, while the standard deviation calculated on all the publi-cations declines, implying that the “internal” publipubli-cations are contributing to driving the standard deviation downwards and to playing a positive role in the progress towards the EJ model. It is worth noting, incidentally, that in table 3.4, referring to the AER model, this development is of rather less certain interpretation.
Neverthe-less, a lively interest persisted in certain fields that continue to be cultivated, even with the awareness that they will not achieve international prominence. Some might consider this characteristic, shown also by the younger Researchers, a hangover from the past, to be eliminated, but others will see it as a resource to cultivate and a meaningful asset contributing to the advance and variety of economic learning.
APPENDIX: correspondence between JEL descriptors before and after 1990
000 100 200 300 400 500 600 700 800 900
A 010
B 031
036
C 026 200
D 021
022 024 025
E 023 130 311
312 321 322
F 400
G 313
314 315
H 323 911
324 915
325 917
918
I 912
913 914 920
J 800
K 613 916
L 611
612 614 615 616 631 632 633 634 635
M 500
N 040
O 110 620
120 640
P 027 636
051 052 053
Q 700
R 930
940
Y
Z 011
References
Artoni, R. (2004), "La valutazione della ricerca", Economia Politica, vol. 21, No 3.
Artoni, R. (2007), “Valutazione della ricerca e pluralismo in economia politica”, Rivista italiana degli econo-misti, Vol. 12, No 2.
Bardhan, P. (2003), “Journal Publication in Economics: A View from the Periphery”, Economic Journal, Vol. 113, No 488.
Bronfenbrenner, M. (1966) 'Trends, cycles and fads in economic writing', American Economic Review, Vol. 56, No 1/2.
Corsi M. (1999), “I concorsi per ricercatore nelle discipline economiche”, in Carabelli, A., Parisi, D., Rosselli, A. (a cura di), Che “genere” di economista, Bologna: il Mulino.
Fishe Raymon P.H. (1998), “What are the research standards for full professor of Finance?”, The Journal of Finance, Vol. 53, No 3, June.
Gillies, D. (2006), “Why Research Assessment Exercises Are a Bad Thing”, Post-autistic economics review, No 37.
Gillies, D. (2008), How Should Research be Organised?, London, College Publications.
Hey, J. (1989), “Comment on Theodore Morgan, “Theory versus Empiricism in Academic Economics: Update and Comparison””, Journal of Economic Perspectives, Vol. 3, No 4.
Hodgson, G. M., Rothman, H. (1999), "The Editors and Authors of Economic Journals: A Case of Institutional Oligopoly?", Economic Journal, vol. 109, No. 453.
Holub, H. W. (1989), “Comments on Theodore Morgan, "Theory versus Empiricism in Academic Economics: Update and Comparison””Journal of Economic Perspectives, Vol. 3, No 4.
Keynes, J. M. (1936), The General Theory of Employment, Interest and Money, London, MacMillan
Lee, F. S. (2007), “The Research Assessment Exercise, the state and the dominance of mainstream economics in British universities”, Cambridge Journal of Economics, Vol. 31 No 2.
Lee, F. S. and Harley, S. (1997), " The Case of Economics," Radical Philosophy, No 85.
Lee, F. S. and Harley, S. (1998), "Peer Review, the Research Assessment Exercise and the Demise of Non-Mainstream Economics," Capital and Class, Vol. 66.
Morgan, T. (1988), “Theory versus Empiricism in Academic Economics: Update and Comparisons”, Journal of Economic Perspectives, Vol. 2, No. 4.
Oswald A. J. (2007), “An Examination of the Reliability of Prestigious Scholarly Journals: Evidence and Im -plications for Decision-Makers”, Economica, Vol. 74, No 1.
Sen, A. (2002), “The Science of Give and Take”, New Scientist, No 2340.
Stigler, G.J. (1965), “Statistical studies in the history of economic thought” in Stigler, G.J., Essays in the Hi-story of Economics, Chicago, The University of Chicago Press.