http://dx.doi.org/10.4236/jilsa.2013.54026
The Research of Urban Rail Transit Sectional Passenger
Flow Prediction Method
Qian Li1, Yong Qin1, Ziyang Wang1, Zhongxin Zhao1, Minghui Zhan2, Yu Liu2,Zhiguo Li3
1
The State Key Laboratory of Rail Traffic Control and Safety, Beijing Jiaotong University, Beijing, China; 2Beijing Rail Transit Network Management Co. Ltd., Beijing, China; 3Commercial Department of the Australian Consulate-General Guangzhou, Guang-zhou, China.
Email: 15210575627@163.com
Received May 11th,2013; revised September 12th, 2013; accepted October 25th, 2013
Copyright © 2013 Qian Li et al. This is an open access article distributed under the Creative Commons Attribution License, which permits unrestricted use, distribution, and reproduction in any medium, provided the original work is properly cited.
ABSTRACT
This paper studies the short-term prediction methods of sectional passenger flow, and selects BP neural network com-bined with the characteristics of sectional passenger flow itself. With a case study, we design three different schemes. We use Matlab to realize the prediction of the sectional passenger flow of the Beijing subway Line 2 and make com-parative analysis. The empirical research shows that combining data characteristics of sectional passenger flow with the BP neural network have good prediction accuracy.
Keywords: Urban Rail Transit; Neural Network; Sectional Passenger Flow; Prediction Method
1. Introduction
In recent years, the domestic urban rail transit develops very rapidly, for example, the future network of urban rail transit in Beijing will show a complex road network structure, high passenger demand growth and so on. Therefore, no matter in planning, construction or opera- tion stage, it is inseparable from the close control and forecast of the passenger flow. Short-term forecast for sectional passenger flow is a very important part. The research of forecasting methods is also very necessary. This text will combine the Beijing subway Line 2 to study short-term sectional passenger flow forecasting methods.
2. Overview of Sectional Passenger Flow
The sectional passenger flow refers to the passenger flow volume through a particular place of the subway line in unit of time. The prediction of sectional passenger flow is an essential element of forecasting. Grasp the present situation and changes of the passenger flow is the prem- ise of traffic organization works smoothly, it is of great significance to manage and control, set reasonable op- eration scheduling plan, track the Quality of Services.
Passenger flow analysis in forecasting is indispensable. Combined with the passenger flow characteristics of Bei-jing subway Line 2, we can see the passenger flow of Beijing subway Line 2 belongs to bimodal pattern in a
day time, the weekend passenger flow is greater than usual. Passenger flow is also affected by holidays, weather con- ditions, season, emergencies and many other factors [1].
3. Research of the Forecasting Methods
3.1. Short-Term Passenger Flow Forecasting Methods
In the short-term passenger flow forecasting, the com- monly used forecasting methods [2] mainly include:
Traditional algorithms, such as regression method,
time series and so on, their research focus on the law of the passenger flow sequence itself.
Modern algorithms, such as genetic algorithms, neu-
ral networks.
Combinational algorithms combined with traditional
methods and modern algorithms.
Among them, the artificial neural network, referred to as neural networks, is based on physiological changes in the brain, mimicking the brain’s structure and function, is a information processing system using computers to realize.
In this paper, we use the BP neural network to forecast.
3.2. BP Neural Network
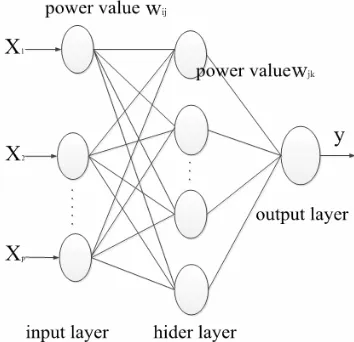
3.2.1. Network Structure
forecast. Through a large number of experiments, the transfer function of hidden layer take s-shaped tangent function tansig, output unit adopts s-shaped logarithmic function logsig, training function adopts gradient de- scending training function training dx when training the BP neural network. After repeated study and training, ad- justing parameters, set up reasonable mapping relation- ship between input and output.
4. The Instance of Predicting Sectional
Passenger Flow
This paper based on the characteristics of sectional pas- senger flow, takes advantage of BP neural network mo- del, to study the sectional passenger flow prediction pro- blem of urban rail transit, and using Matlab neural net- work toolbox to realize design schemes.
4.1. Sample Analysis and Data Selection
[image:2.595.83.260.548.719.2]The raw data I collected is from 1, March, 2012 to31, March, 2012, the daily passenger flow volume from 6:00 to 23:00 every 30 minutes of each section of Beijing subway Line 2. Reasonable sample selection requires enough samples, representative and uniform distribution,
Figure 1. Schematic diagram of BP neural network.
before training.
4.2. Solutions Design of Sectional Passenger Flow Forecast
The passenger flow volume of one section is intrinsically linked with the near time of this section. Each section is a part of the network; therefore, the passenger flow volume of one section is intrinsically linked with its near section. Sectional passenger flow is also relevant with a variety of external factors, such as weekends, holidays, weather, season and so on. Take these factors into account can also increase the prediction accuracy [4].
Based on the analysis above, the following three sce- narios using BP neural network will be used to predict sectional passenger flow, as shown in Table 1.
4.2.1. Sectional Passenger Flow Forecast Based on the Relevant Time
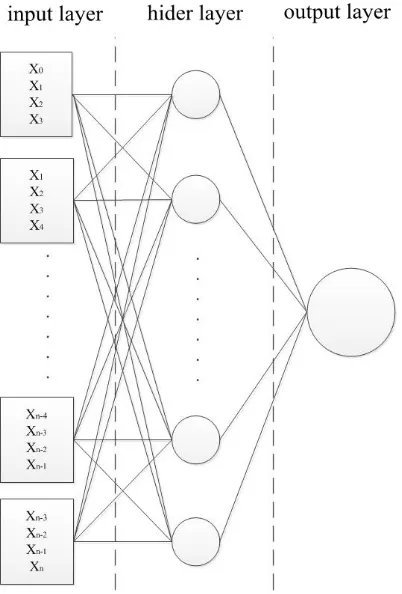
The current period and the previous three periods can be used as input vectors to forecast the next period of the sectional passenger flow.
In this case, the network is four-dimensional input, one-dimensional output, the structure is shown in Figure 2.
Table 1. Solutions design of sectional passenger flow fore-cast.
Type of
prediction Solution Description
Based on the relevant time
Predict the sectional passenger flow of the T + 1 time period by using passenger flow of researched section of the T time period and previous 30 minutes time
period
Based on the relevant section
Predict the sectional passenger flow of the T + 1 time period by using passenger flow of researched section and the relevant section of the T time period and
previous 30 minutes time period
Consider other factors
Predict the sectional passenger flow of the next day by using the sectional passenger flow of the previous day and influencing factors (holidays, weather, season) of
[image:2.595.308.537.580.740.2]Figure 2. Network structure diagram.
In accordance with the selection method based on 4.1, samples obtained 52 pairs, treated 70% of sample pairs as training samples to train the network, 15% of sample pairs as the validation sample set, 15% of sample pairs as the test.
As a result, Figure 3 is the error performance curve,
Figure 4 is the relationship between the predicted value and the true value. Observe the predicted value and the actual value of the curve, the predicted results almost co-incide with the actual value. It proves that the scheme can predict the future trend of sectional passenger flow [5].
4.2.2. Sectional Passenger Flow Forecast Based on the Relevant Section
The sectional passenger flow of Fuxingmen to Fu- chengmen has a strong correlation with its adjacent sec- tions. Accordingly, select four sections such as section of Fuxingmen transfer station, Changchunjie to Fuxingmen, Fuxingmen to Fuchengmen, Xuanwumennei to Chang- chunjie current period passenger volume and the section of Fuxingmennei to Fuchengmen in front of three periods as the input vector to predict the next time passenger volume of Fuxingmen to Fuchengmen section.
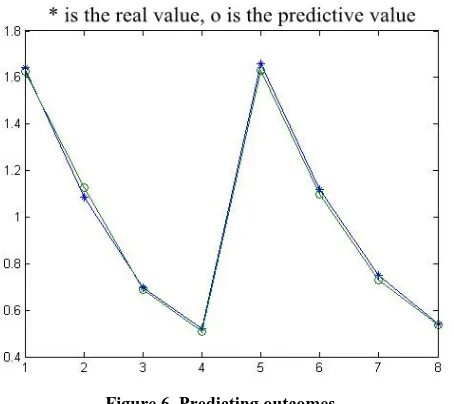
As a result, Figure 5 is the error performance curve,
[image:3.595.306.535.87.284.2]Figure 6 is the relationship between the predicted value and the true value. Observe the predicted value and the actual value of the curve, the predicted results almost
Figure 3. Predicting outcomes.
Figure 4. Predicting outcomes.
[image:3.595.308.538.278.725.2]Figure 6. Predicting outcomes.
coincide with the actual value. It proves that the scheme can predict the future trend of sectional passenger flow.
4.2.3. Sectional Passenger Flow Forecast Considering Other Factors
The impact of external factors also can improve the pre- diction accuracy, such as weekends, holidays, weather conditions, season, and other unexpected events. This pa- per considers the factors of weekends and the weather conditions. Defined weekend as 1, weekday as 0, sunny weather as 0, overcast sky as 0.5, rain and snow as 1.
[image:4.595.308.534.88.281.2] [image:4.595.306.538.90.515.2]As a result, Figure 7 is the error performance curve. Figure 8 is the relationship between the predicted value and the true value. Observing the predicted value and the actual value of the curve, the predicted results almost co-incide with the actual value. It is proved that the scheme can predict the future trend of sectional passenger flow.
4.3. Comparison of Several Prediction Schemes
From Figures 4, 6 and 8, we can see that three schemes above all revealed the relations between the actual sec- tion flow and the predicted section flow. Therefore, the method is feasible to forecast section flow.
Select the result from 8:00 to 10:00 on March 7th of three schemes, the comparison results is shown in Table 2.
By the data above, using the relevant section data has a higher precision than only use the relevant time, consid- ering other external factors can make error smaller.
5. Conclusion
[image:4.595.308.536.299.509.2]Combining with the characteristics of sectional passenger flow, we used BP neural network to predict. The predic- tion results show that the three schemes are all feasible. This paper used collected historical data [6]. If combin-
Figure 7. Predicting outcomes.
Figure 8. Predicting outcomes.
Table 2. The comparison results of three schemes.
Time interval
The actual section flow
The predicted value of Scheme 1
The predicted value of Scheme 2
The predicted value of Scheme 3
8:00 - 8:30 16,482 16,202 16,301 16,120
8:30 - 9:00 11,251 10,632 11,319 11,217
9:00 - 9:30 6922 6714 6713 6887
9:30 - 10:00 5186 4963 5046 5134
Time interval
Relative error of Scheme 1
Relative error of Scheme 2
Relative error of Scheme 3
8:00 - 8:30 1.7% 1.1% 2.2%
8:30 - 9:00 5.5% 0.6% 0.3%
9:00 - 9:30 3.0% 3.0% 0.5%
[image:4.595.308.538.540.735.2]ing neural network with station control system, making real-time training and on-line prediction, we believe we can get a better prediction effect.
6. Acknowledgements
This work is supposed by National Key Technology Re- search and Development Programs of China (Contract No. 2011BAG01B02).
REFERENCES
[1] G. W. Chang and W. W. Shi, “Study on Short-time Pas- senger Flow Forecast and the Optimal Capacity Alloca- tion Problem in Urban Mass Trasit,” Beijing Jiaotong University, Beijing, 2011.
[2] J. Mao, “Urban Rail Transit Passenger Flow Short-Term
Prediction Method and Empirical Research,” Beijing Jiaotong University, Beijing, 2012.
[3] R. Yang, “Study on Passenger Flow Forecast and Opera- tion Scheduling Method of Urban Rail Transit,” Beijing Jiaotong University, Beijing, 2010.
[4] L. N. Wang, “Traffic Prediction and Scheduling of Urban Passenger Rail Network Based on Historical Data,” Bei- jing Jiaotong University, Beijing, 2011.
[5] D. E. Rumelhart, G. E. Hinton and R. J. Williams, “Learn- ing Representations by Back-Propagation Errors,” Nature, Vol. 323, 1986, pp. 533-536.
http://dx.doi.org/10.1038/323533a0