'ìli
EUR
4
1 ' "MÄ*!1· '
$ä
'.'"•S;'Mfl
; !3M
wx'lpfu
EUROPEAN ATOMIC ENERGY
COMMUNITY -
EURATOM
LSSis."1
'M
I
«β*i
;¿fíiílWfl
Ifl»']M
T H E P R O B L E M O F URANIUM RESOURCES
m
A N D T H E LONG-TERM S U P P L Y P O S I T I O N
,iitai
rav*
1
M
• t ø '
pi
K!
»li i·
i
*<*£ Kiwi«;N fi
;'! ¡a i
«BJ
:an ».'¿Lb.WJLÎ
. afin»! :
Iff wMfM
«Si!
i l
íi¿:h
Í¡¡M¿
l*¡!Í
i W O T l *
¡ig
Λ «»w
me
*?r
'Wiift»
Íriííwi«■ML
í« a¡
mu
l«M>
; öij
iiii!
ι ¡ M J
F »'¡f M
!ΙΒ»!ιΓ
LEGAL NOTICE
m
i
T h i s d o c u m e n t was p r e p a r e d u n d e r t h e sponsorship of t h e Commission of t h e E u r o p e a n Atomic Energy C o m m u n i t y ( E U R A T O M ) .
m
N e i t h e r t h e E U R A T O M Commission, its contractors n o r any person acting on t h e i behalf:
ake any w a r r a n t y or representation,
M a k e any w a r r a n t y or representation, express or i m p l i e d , w i t h respect to t n e accuracy, completeness, or usefulness of t h e i n f o r m a t i o n contained i n t h i s docu m e n t , or t h a t t h e use of any information, a p p a r a t u s , m e t h o d , or process disclosed
iw% +ViÎa rì/i/»iiTTiont m a w -rirkt infγ·Ίπcre> T T r ï v i i t p l v n w n p i l r ï i r V i t s : o r
,4
in this document may not infringe privately owned rights; or .r;i:S!VAssume any liability with respect to the use of, or for damages resulting from the use of any information, apparatus, method or process disclosed in this
docu-.HÜÜ
Ki
_ 3 EURO-PEENNES - 98, Chaussee de Charleroi, Brussels 6. ÏliuBiMMfUillRafifii
Please remit payments:
— to BANQUE DE LA SOCIETE GENERALE (Agence Ma Campagne) - Brussels - account No 964.558,
to BELGIAN AMERICAN BANK AND TRUST COM-PANY - New York - account No 121.86,
— to LLOYDS BANK (Foreign) Ltd. 10 Moorgate -London E.C.2,
giving the reference: "EUR 414.e - The problem of uranium resources and the long-term supply position"
EUR 414.e
THE PROBLEM OF URANIUM RESOURCES AND THE LONGTERM SUPPLY POSITION
European Atomic Energy Community - EURATOM
The Consultative Committee of the Supply Agency, Brussels Brussels, September 1963, pages 31
The report describes the situation of the natural uranium industry in the free world and its future development as far as 1980. It takes stock of currently listed reserves workable at a price of $8-10 per lb. U¡Os and assesses their
quantitative trend up to 1970, allowing for production programmes up to that date. Foreseeable consumption of natural uranium between 1970 and 1980 is estimated and compared with the reserves still available. The development of the uranium market is considered more particularly as it affects the Community. This report also gives estimates of nuclear power output, and an annex shows the method used to calculate the corresponding uranium requirements.
EUR 414.e
THE PROBLEM OF URANIUM RESOURCES AND THE LONGTERM SUPPLY POSITION
European Atomic Energy Community - EURATOM
The Consultative Committee of the Supply Agency, Brussels Brussels, September 1963, pages 31
EUR 414.e
EUROPEAN ATOMIC ENERGY COMMUNITY - EURATOM
THE PROBLEM OF URANIUM RESOURCES
AND THE LONG-TERM SUPPLY POSITION
1 9 6 3
C O N T E N T S
PREFACE 5
I. PRESENT RESERVES OF THE FREE WORLD 9
II. DEVELOPMENT OF THESE RESERVES IN THE 1962-1970 PERIOD . 11
III. POSSIBLE DEMAND FOR URANIUM IN THE FREE WORLD AFTER
1970 13
IV. SUPPLY POSSIBILITIES AFTER 1970 17
V. SUPPLY PROBLEMS PECULIAR TO THE EUROPEAN COMMUNITY 21
ANNEX I. Uranium reserves in the free world at below 8-10 $/lb. U308 . . 25
The present report has been prepared for the Consultative Committee of the Euratom Supply Agency by a working party composed as follows:
Members of the Consultative Committee
J. ANDRIOT (spokesman)
I. DE MAGNEE
F. IPPOLITO
Th. R. SELDENRATH
W. HAASE
Head of Mission to Secretary-General for Energy Ministry of Industry
Professor at the Free University of Brussels
Administrative Adviser of the Ente Nazionale Energia Elettrica (ENEL) (National Board for Electrical Power)
Professor, Department of Mining Engineering Delft, Institute of Technology
Ministerial Adviser in the Federal Ministry for Atomic Energy
M. GANGLOFF
H. SCHUILING
F. PANTANETTI
T. Th. BARTELS
H. CLOSS
Experts of the Consultative Committee
Assistant to the Head of the Department of Mining Research in the Atomic Energy Commissariat
Geological Engineer-Adviser to the Upper Katanga Mining Union
Director of the Geomineral Division of the National Committee for Nuclear Energy
Chief Engineer of the Billiton Maatschappij NV
P R E F A C E
The Euratom Commission has decided to publish the report on "The problem of uranium resources and the long-term supply position" which it has received from the Consultative Committee of the Supply Agency. This report tries to give an objective estimate of the conditions which up to 1980 will determine the trend of the uranium market in the free world and the position of the Community as regards uranium supplies.
While recognizing that such estimates must be speculative, the Commission is particularly interested in three ideas which emerge very clearly from the various sur-veys that have been made.
1. A comparison of requirements and resources shows that the free world will not run short of uranium for nuclear electric power during the period under review.
2. Nevertheless, in order to ensure that uranium resources are available at the right time and the right price, it would be advisable to take appropriate measures in the near future, and in particular to start prospecting for uranium. Furthermore, the Commission shares the view of the Consultative Committee that for this purpose a special effort should be made to discover the methods best suited to the new uranium-prospecting conditions.
Under these conditions, it seems reasonably certain that reserves of uranium workable at less than $10 per lb. U3OS (454 gr. of UeOg) will be amply sufficient to supply the requirements of the free world.
3. The Commission was extremely pleased to note the importance which the Con-sultative Committee attaches to developing the string of breeder reactors, since this type of reactor, when perfected, will enable uranium resources to be considerably increased. With the breeder string, not only is the fissile part of natural uranium able to be used as before, but also the fertile part can be converted into plutonium, which is likewise fissile; thus the string will extract the maximum energy that it is technically possible to obtain from the uranium, and thereby considerably reduce the proportion accounted for by the price of uranium in the cost of nuclear power. In consequence, it will be possible to tap substantial uranium-bearing deposits which are already known but are at present unfit to be worked on economically acceptable terms owing to their low uranium con-tent.
THE PROBLEM OF URANIUM RESOURCES AND THE LONG-TERM SUPPLY POSITION
SUMMARY
The report describes the situation of the natural uranium industry in the free world and its future development as far as 1980. It takes stock of currently listed reserves workable at a price of $8-10 per lb. UÏOS and assesses their quantitative trend up to 1970, allowing for production programmes up to that date. Foreseeable consumption of natural uranium between 1970 and 1980 is estimated and com-pared with the reserves still available. The development of the uranium market is considered more particularly as it affects the Community.
This report also gives estimates of nuclear power output, and an annex shows the method used to calculate the corresponding uranium requirements.
Introduction
It is a fact that the world's uranium industry is at present over-producing and that prices have slumped and will remain very low during the years immediately ahead.
Hitherto, however, uranium has been used primarily for military purposes, where-as there can be little doubt that towards the end of the current decade the production of nuclear electricity will expand all over the world.
Since any raw-material supply policy must be drawn up on a long-term basis, the question arises whether the present slack state of the uranium market can continue for long in view of the increased demand resulting from atomic energy production after 1970, and consequently whether the European Community should not make certain plans now with a view to ensuring long-term supplies of uranium on the best possible conditions.
The object of this report is to state the position as regards these problems.
Let us begin with a review of the currently listed reserves which are known with
a fair degree of certainty: these are the quantities of ore or metal which are now available, or could if necessary be made available, for production programmes.
But it is quite certain that this purely "static" view cannot be used as anything
more than a starting point and that it is necessary to examine the development of these
reserves, taking into account not only the estimated or foreseeable production for the
coming years but also the effects which changes in the production structures—insofar
as they can be predicted at the moment—are bound to have on the remaining reserves.
on the other hand the possibility of increasing these reserves by exploring for new uranium deposits or, should this prove feasible, by taking into production the reserves which are at present not considered commercially exploitable.
Finally, we shall set off these possibilities against the probable uranium demand,
bearing in mind, of course, that there is a high degree of uncertainty regarding the
I. PRESENT RESERVES OF THE FREE WORLD
It is noteworthy that uranium, the initial history of which after 1940 was shrouded in strict secrecy, has in the last few years become the metal which is most freely dis-cussed as far as the known reserves and even the price are concerned, except, of course, in the Eastern bloc. Most of the countries possessing uranium deposits have published official figures on reserves and have sometimes released details enabling the value of the assessments to be ascertained. This is a fortunate state of affairs since it enables the total volume of available reserves to be estimated fairly accurately, thus facilitating the choice of measures which may be adopted to ensure future supplies.
On numerous occasions studies have been made of the world's available reserves, either by the specialized authorities of the various countries or at international con-ferences. One of the most recent efforts in this direction on an international plane was the conference held in Buenos Aires at the end of 1960. Since then, more detailed information has been issued or previous data revised.
Appended to the present report is a table which, though certainly still incomplete, summarizes the latest information gathered either from special publications and reports or from unpublished documents received by the Euratom Supply Agency.
It should be noted that this table only gives those reserves the exploitation of
which, is or would be compatible with a sales price of up to $ 8-10/lb for the Us08
oxide present in chemical concentrates. Although the possibility of determining the total reserves without considering prices is perfectly conceivable, since the latter depend on variable economic factors, we believe that, up to a certain point at least, it is neces-sary to take account of the reference price which is most generally accepted in the present circumstances. Indeed, nothing could be more misleading than to set up a table showing tonnages corresponding to any natural concentrations of uranium without taking account of the cost of extracting it from the ore and subsequently processing it in industrial plants, or of the efficiency of the various operations involved. On the other hand, when we examine all the possible ways of meeting future requirements, we must not overlook the fact that resources which are too costly to exploit today. may become attractive at some later date. We shall therefore revert to this matter later in this report.
Tbk table shows that among the producing countries there are essentially three which, in view of the extent of their reserves, are likely to play a dominant long-term role in the supply of uranium. Consequently, it is to these three countries, namely Canada, South Africa and the United States, to which special reference must be made.
The table below gives the principal figures as at 1.1.1962:
URANIUM RESERVES AS AT 1.1.1962 (1)
U.S.A. CANADA SOUTH AFRICA Other countries FREE-WORLD TOTAL Ore in millions of tons
64 145 680
Average content 0.2 %
0.1 '% 0.017%
Uranium metal in metric tons
130,000 145,000 (*) 115,000 (**)
60,000 450,00O> (*) Other estimates take into account a further 60,000 tons which are also apparently recoverable. (**) Estimate by the Chamber of Mines of the Union of South Africa; in respect of reserves recoverable
at a price of $8 per lb. of U3Os.
It must be emphasized that in the United States the USAEC has revised its
pre-vious estimates during the past year; the figures quoted above should be compared with those issued by the AEC in 1961: 74 million metric tons of ore, containing 175,000 metric tons of metal.
Canada has carried out a similar re-assessment, which we consider to be reflected in the figures quoted.
As regards South Africa, the above-quoted figures probably correspond to the total
available potential in the gold-bearing formations of the Rand basin, although by far the greater part of these resources are indicated reserves based solely on test borings. This extrapolation is only possible because of the unusual geological uniformity of these formations. It will be noted that the average content in the ores is comparatively low, but it should be borne in mind that since the gold itself generally imparts an additional value of these ores, a lower uranium content is sufficient to justify extraction at a price of $8-10.
Although this is not always expressly stated in our sources of information, we
believe that the figures given in Table 1 of the Appendix represent the recoverable
quantity of ore and metal in the formations, account being taken of the efficiency of present-day techniques for the extraction and processing of ores.
(1) All figures in this report express tonnages of uranium metal contained in the ores. As is known, the unit commonly used by the Anglo-Saxons is the short ton of Us08 content, which represents
approximately 0.76 metric tons of uranium metal.
Π. DEVELOPMENT OF RESERVES IN THE 1962-1970 PERIOD
An attempt can be made to forecast the trend which may be followed during the next few years by the reserves we have just been discussing. To confine ourselves to the present decade—for beyond that the situation cannot be foreseen with anything like the same degree of certainty—this development will be due primarily to the actual exploi tation of the mines now open, to changes in the production structures and, finally, to new discoveries, if any.
Canadian, United States and South African production will probably be determined by the contracts currently in force, up to 1966 as far as the United States is concerned and up to 1970 in the case of Canada and South Africa.
The table below shows the quantities of uranium metal (in metric tons) covered by the current contracts or forecasts of which we have been informed. Although these figures are no doubt open to question, they can safely be accepted in view of the fact that the civilian demand in the various countries is now, and will continue to be, determined by the reactor construction programmes. There may, however, be some additional requirements for military purposes.
FORECAST URANIUM EXTRACTION FOR THE 1962-1970 PERIOD
(in metric tons)
U.S.A CANADA SOUTH AFRICA
Other countries
FREE-WORLD TOTAL
Forecast for 1962-1966
47,000 (*) 22,000 13,000
9,000
91,200
Forecast for 1967-1971
24,000 (*) 2,800 (**) 5,000
7,000
38,000
TOTAL 1962-1971
71,000 (*) 25,000 18,000 (***)
16,000
130,000
(*) Taking into account the spreading policy recently decided upon by the USAEC. (**) Up to and including 1969.
(***) Up to and including 1972.
Although the estimated rate of production shows a very marked decline in com parison with the levels attained in the years 1959-1961 (an average of 22,000 t/a for 1962-66 as against 30,000 t in 1960), it can nevertheless be stated that considerable inroads will have been made into the present known reserves by the beginning of the next decade.
DEVELOPMENT OF RESERVES IN THE 1962-1970 PERIOD
(in metric tons)
U.S.A. CANADA SOUTH AFRICA Other countries FREE-WORLD TOTAL
Reserves as at 1.1.61
130,000 145,000 115,000 60,000 450,000
Extraction in the period 1962-1970 71,000 25.COO 18,000 16,000 130,000
Reserves as at 1.1.71
59,000 120,000 97,000 44,000 320,000
The United States would therefore be left with metal reserves of only about 59,000 tons, which is very little for a country which is bound to make extensive use of nuclear power; Canada and South Africa, with respectively 120,000 and 97,000 tons of metal in reserve, will be the only countries in a position to supply uranium if there is no change in the present reserve situation. Now, there is known to be little likelihood of South Africa's being able to increase its uranium production appreciably above 5,000 t/a, since that production is closely bound up with the output of gold.
In the United States, the USAEC recently decided on a policy of spreading out current contracts until 1968 and supplementary purchases over 1969-1971 of quantities equal to those carried over, or a maximum of 12,000 tons. This radically alters sales prospects for producers, since the AEC's intention until quite recently was virtually to suspend all'purchasing after 1966 for an indefinite period.
This decision removes the uncertainty that was hovering over the post-1966 period and gives the producers the opportunity to sell definite though limited quantities, at known prices, up to the beginning of the next decade; in the normal way, it should therefore relieve them of the necessity to close certain mines, which would have led to the flooding of underground mines and the loss of considerable reserves, and at the same time would have encouraged producers to develop the richest ores and abandon those with marginal contents.
In Canada, despite the slight respite resulting from the recent British contract, the production capacity as from 1965 will be reduced to that of a single plant, i.e. about 800 t/a of metal (as against 12,000 t in 1959), and as far as can be foreseen at present even this capacity will not be fully loaded. By 1965 the cost of production will no doubt
be fairly low—around $ 4-5/lb.—since the installations will largely have been written off.
But the revival of an industry capable of attaining production levels approaching those of 1959 will certainly not be possible unless uranium prices increase considerably. At least, in the case of Canada, it can be assumed that, owing to the nature of the deposits, wasteful exploitation is less likely, and there is some hope that the temporary closing of mines will result in a less serious loss of reserves than in the United States.
Finally, in South Africa the problem is somewhat different. The majority of
mining infrastructure designed for the production of gold will survive. After the gold has been extracted, the uranium-bearing ores can be stored with a view to subsequent extraction
of the u r a n i u m . T h e South African producers will probably retain their processing plants, b u t even should they n o t do so South Africa's position will a priori r e m a i n t h e least impaired b o t h from t h e economic standpoint and as regards the conservation of u r a n i u m reserves.
T h e r e is, of course, a chance t h a t new discoveries will b e m a d e to offset this r a t h e r pessimistic prognosis; one can never rule out t h e possibility t h a t t h e existence of a rich deposit will b e revealed in t h e near future, although t h e r e have been no discoveries of i m p o r t a n t ore-bearing districts since 1956. Nevertheless, it is to be fore-seen t h a t t h e diminishing purchases and falling prices will scarcely encourage private companies in t h e United States and Canada to invest in t h e search for u r a n i u m unless special government policy is involved. B u t t h e r e we are already touching u p o n measures which may b e p r o m p t e d by an examination of the prevailing conditions; w h a t concerns us h e r e is the situation as it will be if no special steps are taken.
To conclude, t h e quantities of u r a n i u m that, in principle would still be available, on t h e basis of UgOs value of $ 8-10 or less per pound, are limited, a n d only Canada and
South Africa will be able to play a p a r t in t h e supply of u r a n i u m on a world-wide scale. F u r t h e r m o r e , t h e development of production patterns due to t h e small d e m a n d in t h e next years will result in t h e loss of a substantial p a r t of t h e reserves which would theoretically r e m a i n available.
W e shall therefore definitely assume t h a t t h e reserves as at 1 J a n u a r y 1971 cor-responding to t h e deposits t h e existence of which is k n o w n today and which can be worked at a rate of 8 or 10 $ will b e of t h e order of 320,000 tons of n a t u r a l u r a n i u m . This m a r k e d state of depression in t h e u r a n i u m mining industry will prevail at the very time w h e n all t h e evidence points towards an upswing in nuclear power pro-duction.
III. POSSIBLE DEMAND FOR URANIUM IN T H E F R E E W O R L D A F T E R 1 9 7 0
We have just been seen t h a t in 1970 t h e available u r a n i u m reserves of t h e free world, workable at $ 8-10 per lb. UsOg, will b e about 320,000 tons U, after extraction of some 130,000 tons U during t h e period 1962-1971 and approximately 180,000 tons before 1962.
I n other words, the u r a n i u m discoveries in t h e free world since t h e war a m o u n t at present to about 630,000 tons U, of which 320,000 will have been extracted by 1 J a n u a r y 1971.
DEVELOPMENT OF PRODUCTION AND RESERVES SINCE 1945
(in metric tons)
Production before 1962 Estimated production 1962-1971 Reserves remaining on 1.1.1971 Total reserves discovered to date
180,000 130,000 320,000 630,000 tons U
It will be noted that the volume of production is large in relation to the reserves. But before any judgment can be passed as to the possible inadequacy of the 320,000 tons of reserves remaining on 1 January 1971, it is necessary to calculate the orders of
magnitude of the consumption after that date.
We have chosen 1970-1980 as a reference period, the three principal reasons being as follows:
— Most experts believe that nuclear energy will become competitive around 1970, but it would be very presumptuous to attempt to fix the date to within less than a few years either way. In our opinion, therefore, it is preferable to consider a period long enough to permit the effects of this competitivity, which in any case will come about gradually, to even themselves out.
— There is a substantial measure of discontinuity in the uranium consumption per MWe according to whether we base our assumptions on present-day primary reactor techniques or on breeder reactors. Up to 1980, at least, it is practically certain that primary-type reactors will be employed, since breeder reactors cannot come into use on an industrial scale for another fifteen years or so, i.e. towards 1980. Consequently, one technique will not be outsted by the other overnight, in view of the fact that primary reactors will still be necessary for a good many years to provide the initial charge of plutonium for breeder reactors.
— As far as the mining industry is concerned, any policy for new resources initiated in 1963 would scarcely have time to take effect before 1970 (owing to the time-lag for exploration and investment). Conversely, we consider it neither necessary nor realistic to attempt to foresee the situation after 1980.
A review of demand must embrace all the countries of the free world, since the production and consumption of uranium in each country will not necessarily balance out.
The demand for uranium is determined on the-basis of the forecast of nuclear capacity to be installed between 1970 and 1980. This forecast is in turn bound up with long-term forecasts for the major countries or groups of countries, relating to the demand for electricity, the maximum load, the total generating capacity to be installed, and an assumption concerning the share to be borne in these programmes by nuclear power plants.
Various bodies have published forecasts of the nuclear generating capacity to be expected in 1970, 1975 or 1980. In this report we have taken care to adopt only the most conservative of the various figures put forward, and we have again been extremely cautious where, for lack of published estimates we have had to extrapolate or propose figures.
Needless to say, however, these figures comprise a wide margin of uncertainty. For the sake of simplicity, we have adopted an average figure. In point of fact, there is often more than one value for each estimate, depending on the forecast trend of general economic activity (1).
(1) N.B. We could have given short hypotheses and long hypotheses corresponding to the various hypotheses for the national income growth, the development of the nuclear industry's share in this in-crease and the performance of nuclear reactors. But this would soon give rise to complicated diagrams in which the composite probability from each combination of the various hypotheses would have to be given. We have preferred to confine ourselves to the hypothesis which seemed to us the most probable.
As regards the European Community, the Inter-Executive Energy Group has recently published a "Study of long-term energy prospects", in which Euratom collaborated on the part concerning nuclear energy (Chapter 12).
According to this study, nuclear generating capacity, which would be about 3,500 to 4,000 MWe in 1970, would rise to 10-16,000 MWe in 1975. A reasonable extrapolation from these figures gives us 30-40,000 MWe in 1980. Thus it seems to be in keeping with our desire for caution to adopt a mean growth figure of approximately 30,000 MWe for nuclear electricity output between 1970 and 1980; this figure corresponds to about 25% of all new construction.
For the United Kingdom the figure adopted is 30%.
For the United States the figure is 20%, in accordance with the latest published
forecasts. The same proportion is taken for Canada. In view of the distinctly
advanta-geous position of the United States as regards fossil fuel reserves, this proportion suggests that the figure given for Europe is a modest one.
As for the other countries of the free world, which we have set apart because they do not at present have atomic programmes of any importance, it is difficult to make a forecast. Some of them may nevertheless be greatly interested in nuclear energy, whereas others may lack the industrial basis and specialist personnel which are necessary for the rapid development of nuclear energy on a large scale.
Among the countries capable of launching sizeable atomic programmes we list:
— Japan — Brazil — Argentina — India
— South Africa
Adopting the same cautious approach, we have therefore assumed that only 10% of the new generating plants erected in these countries between 1970 and 1980 will be nuclear installations.
The coresponding consumptions of natural uranium will depend to some extent on the techniques employed (light-water, enriched-uranium reactor; graphite, natural-uranium reactor; heavy-water, natural-natural-uranium reactor). However, the calculations show that the orders of magnitude do not differ much; only heavy water can permit sub-stantially lower uranium consumptions per MWe.
On the assumption that the United States will use enriched uranium, Canada and the United Kingdom natural uranium and the other countries, including Europe, 50% enriched and 50% natural uranium, we finally arrive at the figures given in the table below :
NUCLEAR GENERATING CAPACITY TO BE INSTALLED BETWEEN 1970 AND 1980
(in MWe)
European Community United Kingdom
Other European Countries U.S.A.
Canada
Other countries of the free world Free-world total
Total electric power to be installed between 1970 and ¡1980
120,000 40,000 46,000 190,000 24,000 100,000 520,000 Proportion of nuclear power
2 5 % 3 0 % 1 0 % 2 0 % 2 0 %
1 0 %
2 0 %
Nuclear power installed between 1970 and 1980
30,000 12,000 5,000 38,000 5,000 10,000 100,000
T h e consumptions of n a t u r a l u r a n i u m corresponding to t h e above figures are as follows :
CONSUMPTION OF NATURAL URANIUM FOR THE PERIOD 1970-1980
(in metric tons)
Europe North America Other countries Total for free world
Installed nuclear power in (1970, in MWe 10,000 6,000 1,000 17,000
Installed nuclear power in 1980, in MWe 57,000 49,000 11,000 117,000 Natural uranium consumption,
in tons U 100,000
70,000 20,000 190,000
I n short, t h e d e m a n d for n a t u r a l u r a n i u m b e t w e e n 1970 a n d 1980 can b e charac-terized as shown below, on t h e basis of t h e c u r r e n t l y e m p l o y e d t e c h n i q u e s .
URANIUM REQUIREMENTS BETWEEN 1970 AND 1980
(in metric tons)
Europe North America Other countries Total for free world
F r o m this brief outline it can be seen t h a t :
— u r a n i u m requirements for t h e ten-year period 1970-80 will probably total about 200,000 tons and possibly m o r e ; say, somewhere in t h e 180-250,000 tons r a n g e ;
— annual consumption will increase from 8-10,000 tons a year in 1970 to 35-50,000 tons a year in 1980.
We have assumed t h a t t h e requirements of nuclear power plants for the period u p to 1970 will be m e t by purchases and u r a n i u m stocks accumulated by t h e various Atomic Commissions before t h a t date. W e are adopting t h e same hypothesis for m a r i n e engines over t h e same period. Possible military requirements could be added to these estimates, b u t at present no precise figures are available. W e are working on the assumption t h a t t h e above-mentioned purchases and stocks will meet this d e m a n d u p to 1980.
T h e u r a n i u m requirements listed above would doubtless be reduced by recycling p l u t o n i u m or using t h o r i u m as a fertile m a t e r i a l in conventional reactor types. This eventuality would, however, only apply to certain reloadings and would only h a v e a slight effect on the total requirements, since t h e first charges m a k e u p a large percentage of these requirements anyway.
Finally, special reference should also b e m a d e to stocks of fissile materials p r e p a r e d specifically for military purposes. Stocks of this k i n d may, depending on t h e political circumstances, seriously upset t h e nuclear fuel market, at least temporarily, b u t it is impossible to m a k e any k i n d of prediction in this sphere.
IV. S U P P L Y POSSIBILITIES A F T E R 1 9 7 0
We have just seen an estimate of t h e reserves which will still b e available in 1970. As regards production plants, however, it is k n o w n that, provided no new contin-gency arises, t h e r e will b e only one plant in operation in Canada in 1965, while in South Africa t h e r e will only b e five actually engaged on production out of a total of 22 by 1970. On the by no means certain assumption t h a t all t h e US plants will still be k e p t operating u p to 1970, the following p i c t u r e is obtained of the state of the u r a n i u m industry in 1970:
STATE OF URANIUM INDUSTRY IN 1970
(in metric tons)
U.S.A. Canada (*) South Africa Other countries Total for free world
Reserves on 1 January 1971
59,000 120,000 97,000 44,000 320,000
Capacity of Plants still in operation
6- 9,000 1,000 2,000 1,500 10-13,500
(*) If the additional 60,000 tons in Canada should prove to be recoverable [see page 10, foot of page(*)], the reserves on 1 January 1971 would, of course, be increased by that amount.
From a comparison between the capacity of the plants still in existence in 1970 and the probable annual requirements at that date (13,500 tons and about 8 to 10,000 tons respectively), it is clear that the existing plants will be perfectly capable of meeting the demand up to about 1970-72. As the cost of all these installations is now or will by then be written off, production prices will be very low, namely, about $3-4 in South Africa, $4-5 in Canada and $4-7 in the US.
Of primary interest here, however, is the development of the market after 1970, and by way of an introduction we shall make a few general remarks concerning the uranium economy.
It will be recalled that uranium concentrates are obtained via the following stages: — extraction of the mineral
— pulverisation
— chemical processing of the pulp
The cost per ton of mineral is fairly rigidly established for these three operations, since it is the same ton which is handled up to nearly the end of the whole process. It is thus not difficult to imagine that in the final analysis the cost of the uranium extracted will be very largely in inverse proportion to the ore content, the processing cost per ton of ore remaining in any case within the following orders of magnitude:
— extraction of ore in underground mine — chemical processing
— depreciation of plant
Total: $12-20/t If the uranium content in the mineral is about 1 %c, the cost per pound of υ308 (1)
will therefore be between $5.50 and $8. If the content is 0.5 %o, the price will be double, and so on.
To this price should be added the amortization of prospecting and exploration costs, which come to $1-2 per pound of Ua08.
This simple outline gives the present prices of uranium (8-10%), bearing in mind the fact that there are no large deposits of ore possessing a content in excess of 1 or 2%c.
Conversely, it would be worthwhile continuing exploration while the cost of pros pecting for new deposits is lower than the extra cost which the exploitation of known low-content deposits would involve.
Thus, in view of the prices which we have just quoted ($1-2 per pound of UeOs taken as an average for prospecting at the present time), there would seem to be no point in exploiting low-content deposits, since the cost of extraction rises very rapidly per kg of uranium (by $5-8 per pound of U3O8 in our table (*) in passing to 0.5 %o content deposits from deposits having a content of 1 %o).
$ 6-10/t
$3-6/t 4/t
(1) If depreciation costs are ignored the figure of $4-5 is in fact obtained for the next few years.
(*) With the exception of the very special case of South African uranium, which is the by-product of an ore already valuable by virtue of the gold content.
There are, however, throughout the world considerable deposits of uranium which because of their low content (additional complications being encountered also in the shape of unsolved technical difficulties connected with processing methods) cannot at the time of writing be regarded as a source of supply.
In the absence of a more recent evaluation, we quote here some figures provided by the USAEC in May 1960 (*), considering only those deposits which are already known and ignoring possible resources which have not yet even been located, let alone assessed.
QUANTITIES OF URANIUM PRESENT IN DEPOSITS NOW UNEXPLOITABLE
(in metric tons)
Approx. price per lb. U3Os
North America Europe
South America Africa
$16 to 20 300,000 (1) 700,000 (2) 70,000 (3) 900,000 (1)
$20 to 30
700,000
(1) uranium from phosphates. (2) mainly schists in Sweden.
(3) uranium-bearing pyrochlore from Brazil.
There is no need to stress that these figures are only very approximate. Further-more, it should be recalled, for example, that uranium can at the moment only be extracted from phosphates in cases where the phosphates can be used in the manufacture of triple superphosphate; however, this industry only uses a very small percentage of the phosphates exploited throughout the world. The processing of the uranium-bearing pyrochlores in Brazil in itself poses difficult problems for which solutions have yet to be devised.
This uranium "potential" should therefore be regarded with a considerable degree of circumspection and it is doubtless more realistic to base estimates of future prospects on the assumption of new discoveries rather than on the extremely hazardous exploitation of these poor deposits.
Let us now revert to a discussion of the situation after 1970.
As soon as the existing plants can no longer meet the demand, prices will rise again in such a way as to finance the erection of new plants at the site of deposits which are already known.
Prices, in the $4-6 range during the period 1965-70, will therefore increase by about $2 to the $6-8 range. However, in view of the annual demand, which will rise gradually to 30 or 50,000 tons a year in 1980, this stage will soon be passed.
South African uranium output is in fact linked with the production of gold and cannot therefore exceed 5-8,000 tons a year in view of the present prospects for the
gold market. It may thus be assumed that out of the 97,000 tons making up South
(*) Energy from Uranium and Coal Reserves USAEC TID 82 07.
African reserves in 1970, only 50-80,000 tons will be available d u r i n g t h e ten-year period 1970-1980.
T h e US plants, on t h e o t h e r h a n d , m a y still b e in operation, b u t t h e r e m a i n i n g reserves will b e considerably reduced.
T h e p a t t e r n w h i c h t h e situation is likely to follow is o u t l i n e d below, on t h e assumption t h a t t h e u r a n i u m d e m a n d will rise from 10,000 tons in 1970 to 22,000 tons in 1975 a n d 38,000 tons in 1980.
TREND FOLLOWED BY URANIUM MARKET
(in metric tons)
I. Annual requirements
II. Capacity for meeting demand
a) Pfonts in operation in 1970 at deposits already known
U.S.A. Canada South Africa Other countries
Total
b) Plants ivhich can be built at deposits already known (***) U.S.A.
Canada (****) South Africa Other countries
Total
c) New deposits and new plants
TOTAL 2 Situation in 1970 10,000 ï • 10,000 10,000 — — — 10,000 2 Situation in 1975 22,000 7,000 1,500 2,000 1,500 12,000
| 10,000 (**)
10,000 — 22,000 3 Situation end 1980 38,000 1,500 2,000 1,500 5,000 9,500 6,000 15,500 17,500 38,000 4 TOTAL Uranium 1970-1980 190,000 59,000 (*) | 30,000 15,000 104,000 } 65,000 65,000 21,000 190,000 (*) Present known reserves will probably be exhausted shortly before 1980.
(**) The capacity of the new plants is calculated on the assumption that 10 years' reserves are guaranteed. (***) Or to be completely reorganized.
(****) If the additional 60,000 tons proved to be recoverable, they would increase the possibilities of production at known deposits.
These figures should not, of course, be taken as being strictly accurate, but the general orders of magnitude are such that the inevitable future pattern emerges fairly clearly, namely:
— by 1970-72 prices will begin to rise as new plants are put into operation;
— between 1975 and 1980 the deposits which are at present known will no longer
be able to keep up with the demand and new deposits, which have yet to be discovered,
will have to be exploited as of that date. The prices will rise again somewhat to some-where around $7-9, in order to defray not only the plant erection costs but also the prospecting costs, which will in any case tend to increase in view of the fact that the most easily located deposits have for the most part already been discovered due to their geological or geographical situation.
The latter aspect is of particular importance to the US, which will have exhausted all its reserves by then. This is borne out by the fact that the AEC is directing its attention to prospecting activities, in anticipation of a rise in prices.
In conclusion, it would appear that:
1. The 320,000 tons of reserves remaining on 1 January 1971 will represent a total of only 15 years' consumption at the most.
2. From an analysis of the production set up, it would seem that these reserves will not even be sufficient to guarantee an adequate production capacity after 1975.
3. New deposits must therefore be prospected during the next 10 years, since the known low-content deposits appear at all events to be much more expensive than those which may be discovered by new explorations on the basis of present experience.
4. Numerous parts of the globe which have yet to be explored doubtless contain uranium deposits which it would be economic to mine. In view, however, of the fact that no spectacular discovery has been made in the world since about 1956, it would seem that a concentrated effort will have to be made and that at all events the development of nuclear energy means that immediate priority will have to be given to the perfecting of breeding techniques.
V. SUPPLY PROBLEMS PECULIAR TO THE EUROPEAN COMMUNITY
A detailed comparison of the conclusions reached in the preceding sections shows that besides the general world problems of finding new resources there will be a marked inbalance between the various continents. This emerges clearly from the following table.
REQUIREMENTS AND RESOURCES BY CONTINENT
(in metric tons)
Europe
North America Other countries
Total
Cumulative requirements 1970-1980
100,000 70,000 20,000
Possible production from known reserves
15,000 \ 154,000
New discoveries 21,000
190,000 190,000
Thus the E u r o p e a n requirements, of which the Community's share accounts for more t h a n three-fifths (and would account for over 9 0 % if Britain were included), would have to be imported virtually in their entirety and would represent approximately half of the free-world market.
Such a situation is commercially, and even politically, undesirable.
Undoubtedly, t h e American continent will be an exporter, at least as far as Canada is concerned, b u t t h e above balance is still less reassuring if we a t t e m p t to ascertain t h e probable trends at the end of t h e decade 1970-1980.
ANNUAL REQUIREMENTS AND RESOURCES BY CONTINENT AT THE END OF THE DECADE 1970-1980
(in metric tons)
Europe
North America Other countries
Total
Annual requirements in 1980
20,000 14,000 4,000
38,000
Possible annual production from known reserves
1,500 11,000 8,000 New discoveries
17,500 38,000
Even if possible production between 1970 from k n o w n reserves is very nearly sufficient to cover the cumulative d e m a n d over t h a t period, between 1975 and 1980 t h e o u t p u t from plants at these deposits will lag increasingly b e h i n d requirements.
To be sure, there is every reason to suppose that the new discoveries will be made largely in America, but even if we assume that that continent, and in particular the United States, can replenish its reserves at the same rate as in previous years, we find that American consumption will soon overhaul the domestic production capacity.
In any case, since an effort directed at replenishment on such a scale presupposes substantial expenditure on exploration, the corresponding uranium will not be sold cheaply, and if the European countries do not foresee the situation they will be compelled to resort to new and probably expensive producers.
What conclusions can be drawn from this survey, based as it is on figures which, it must be pointed out once more, constitute only an average estimate embodying an appreciable margin of uncertainty ?
Our suggested conclusions are as follows, on the assumption, which we shall not discuss here, that the development of nuclear energy is continued.
(1) Europe will probably be a very large consumer on the uranium market. This is not surprising in view of its industrial power on the one hand and its unfavourable position as regards cheap sources of supply for fossil fuels on the other hand.
(2) Europe's present reserves are low and incommensurate with its future con-sumption.
(3) If it does not take control of, or participate in, the search for and exploitation of newly discovered uranium deposits throughout the world, Europe may well find itself at an economic or even political disadvantage.
(4) In this respect Europe could take advantage of the present slump, in the market by acquiring interests in mines which are currently dormant (Canada) or by stock-piling, provided that the purchase prices do not exceed the equivalent of $7-8 in 1975 or $4-4.5 in 1965 (at an interest rate of 6%). This might, however, present merely a partial solution to the long-term problema.
(5) It should at all events undertake independent exploration for uranium deposits either in Europe itself or, above all, in other countries of the world which are considered favourable for this purpose, with the object of basing its supplies on sources which are as varied and reliable as possible, whilst at the same time benefiting from the lowest prices. A simultaneous effort should be made to improve methods of ore prospecting and processing in view of the space of time separating the prospecting stage from the commencement of production (about 10 years).
(6) In this context the rapid development of breeder reactors is a matter of primary concern to Europe, in order to avoid aggravating after 1980 a situation which already merits attention for the preceding decade.
It is our opinion that the earlier these problems are tackled the more easily they can be solved and, above all, the better will be the economic conditions for their solution.
It is for this reason that, although we consider it necessary to study these questions immediately, it should not be concluded that the development of nuclear energy in Europe is thereby partly compromised.
On the contrary, there are substantial advantages to be gained by pushing ahead with nuclear energy in Europe in view of:
(1) the high cost of its conventional energy;
(2) the steadily deteriorating security of supply owing to the fact that its con-ventional energy resources are being severely taxed by the increasing demands.
In fact, however much it may vary, since the price of uranium in the concentrated stage accounts for only 3-10% of the total cost of nuclear energy, it cannot call into question the competitiveness of a source of energy which will become available primarily through scientific and technical progress. Furthermore, this low cost and the ease with which uranium concentrates can be stored make it possible to ensure supplies for much longer periods than is the case with coal or oil.
It would, however, be regrettable—and this is our conclusion—for Europe to be
condemned through lack of foresight to acquire all its uranium in conditions which are economically unfavourable and subject to political risks, which, although they could certainly be minimized in view of the ease of storage, would in turn finally entail a great deal of unnecessary expenditure.
As for the resources of low uranium content which are at present known to exist on the continent of Europe, these cannot be of any help in such a case, either because in our opinion they will continue for a long time to be much more costly than newly dis-covered deposits, or else because the inevitable time lag before they can be exploited is incompatible with the speed with which changes take place in the political sphere.
Nor must it be held that the advent of the breeder reactor will cause a sudden drop in the demand for uranium. Indeed it requires numerous recycling processes and several decades to extract all the energy from a kilogram of uranium. Moreover, breeder reactors can only be brought into operation gradually, depending on the quantities of plutonium produced by the primary reactors. What can, however, be expected from the rapid development of breeder techniques is a lessening of the demand for uranium, which would otherwise attain enormous proportions and certainly give rise to very serious problems.
There is therefore a need for a long-term European uranium supply policy which provides for the desired rapid development of nuclear energy, involving the earliest possible application of breeder techniques.
As far as the coming 20 to 30 years are concerned, the uranium reserves are there, but a great deal of time will be needed to find and exploit them. Supply diffi-culties will, therefore, arise only if insufficient forethought is devoted to the question.
ANNEX I
URANIUM RESERVES IN THE FREE WORLD AT BELOW 8-104/lb. U„Oa
(in metric tons)
N.B. The figures below relate to reserves which, at least in part, are measured or known, and are based on roughly the same degree of probability in each case.
U.S.A. Canada South Africa France Italy Germany Spain Portugal Australia Argentine Congo Gabon Japan India Miscellaneous RESERVES Ore
millions of t. 64 143 680 19 2 Metal tons 134,000 145,000 115,000 26,000 1,600 800 1,500 5,500 10,000 3,800 8,000 5,000 1,000 1,200 (?) 1,000 Content % 0.2 0.1 0.017 . 0.14 0.10 0.2 - 0.5
0.11 0.12 0.09 - 0.15
ANNEX II
TREND OF ELECTRICITY AND URANIUM CONSUMPTION
I. ELECTRICITY
1. European Community
The "Survey of the European Community's long-term energy prospects", recently published by the three Communities, contains forecasts of electricity consumption up to 1975.
These forecasts relate to gross consumption, but it is possible to calculate the net consumption and to extend the forecasts as far as 1980.
Maximum power demand can also be estimated by using a coefficient equal to 5,000 hours a year.
The installed capacity required for each period has been taken as being equal to the maximum power demand plus approximately 12% and another 10% in 1980.
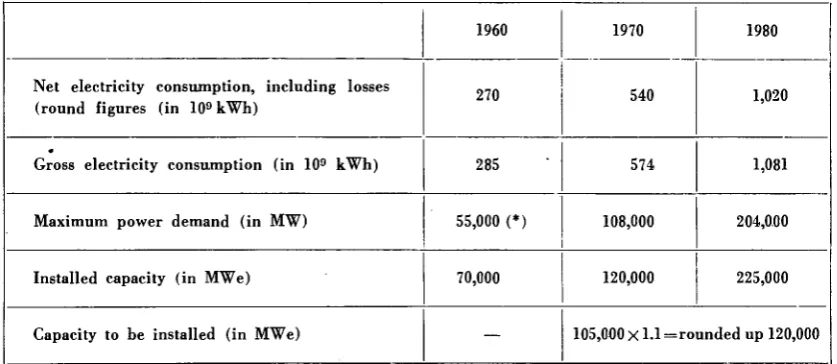
In point of fact, the figures recorded for 1960 should have prompted us to employ higher coefficients, since the installed power in the Community was at that time 70,000 MWe for a maximum load of 55,000 MWe, a coefficient of 127%. But in view of the dwindling proportion accounted for by hydraulic power, it can be said that the coefficient of utilization of installed power will improve progressively. Even apart from this circumstance, however, the figures adopted allow for a substantial improvement in the plant load coefficient, since the annual use of installed power rises from 3,900 hours in 1960 to over 4,500.
Once the capacity required for use in the two reference years is determined, the difference will give us the capacity to be installed during the period in question, but this capacity must be raised by 10% for the replacement of old plant.
We finally arrived at the following figures, which are consequently on the con-servative side as regards capacities to be installed:
Net electricity consumption, including losses (round figures (in 109 kWh)
Gross electricity consumption (in 10° kWh) Maximum power demand (in MW)
Installed capacity (in MWe) Capacity to be installed (in MWe)
1960
270
285 55,000 (*) 70,000
—
1970
540
574 108,000 120,000
1980
1,020
1,081 204,000 225,000 105,000 X 1.1=rounded up 120,000 (*) Figure consistent with the subsequent figures on the basis of 5,000 h/year.
In the case of the European Community, we could have dispensed with the fore-going table, since a recent UNÍPEDE study gives very detailed forecasts up to 1975. Our intention, however, was to adopt a standard table for all the countries of the free world, utilizable on the basis of figures published , in respect of countries other than those in the European Community.
The UNÍPEDE study gives a range (extrapolated up to 1980) of 90,000 to 130,000 MW to be installed, excluding hydraulic. Our figure of 120,000 MW, which includes hydraulic capacity (this, however, being relatively slight), fits into this range satisfactorily.
What proportion of this total will be taken up by the nuclear power plants can be deduced from the figures given in Chapter 12 of the above-mentioned survey of prospects.
According to this, installed nuclear electric capacity, which would be about 3,500 to 4,000 MW in 1970, would rise to 10,000 -16,000 MW in 1975. A reasonable extrapolation from these figures brings us to 30,000 - 40,000 MW in 1980. With due caution, then, we can apparently adopt an average growth figure of about 30,000 MW for nuclear capacity installed between 1970 and 1980, corresponding to about 25% of all new construction.
In this case too the UNÍPEDE study gives a range for 1975, namely of 12,000 to 25,000 nuclear MWe. At all events our figure of 30,000 nuclear MW in 1980 comes within the previous range extrapolated to 1980 (25,000 to 60,000) and nearer to the pessimistic hypothesis.
2. United Kingdom
On the basis of the UNÍPEDE and UNO publications and a calculation scheme
[image:31.595.72.491.71.253.2]similar to the one used for the European Community, we can draw up the following table :
Electricity consumption Maximum power demand Installed capacity
Capacity to be installed between 1970 and 1980 (MW) 1960 129 26,000 34,500 (*) 1970 230 45,000 51,000 1980 (400) 80,000 88,000 37,000x1.1=40,000
(*) This figure represents an annual utilization coefficient of 3,750 h/year which is still a long way from the 4,500 h in our table.
T h e last W h i t e P a p e r on t h e subject predicts an installed nuclear capacity of 5,000 M W in 1968, against a figure of 20,000 to 30,000 M W for 1975 as forecast in previous W h i t e Papers.
Since the United Kingdom's nuclear p r o g r a m m e is now being staggered, we may assume 15,000 to 20,000 nuclear M W for 1980, of which about 7,000 would b e com-missioned by 1970. Hence we may adopt a figure of about 12,000 M W for nuclear installations during that decade, representing nearly 30% of new construction.
3 . Other E u r o p e a n Countries
Similar m e t h o d of calculation and sources of information.
Few nuclear programmes have as yet been clearly defined. A m o n g t h e m are those of Sweden (500 M W in 1970), Spain (1,800 M W in 1975) and P o r t u g a l (2,600 M W between 1975 and 1985).
T h e proportion we have assumed as being accounted for by nuclear energy in the total power supplies (10%) will probably b e far below the actual figure.
4 . U.S.A.
T h e basic figures (according to U N Í P E D E and UN) are as follows:
Electricity consumption Installed capacity 1960 845 185,000 (*) 1970 1,500 320,000 1975 1,850 400,000 1980 (2,250) 490,000 190,000
(*) corresponds to 4,600 h/year, or the exact figure shown in our table.
According to several recent statements, t h e r e is likely to be 5,000 M W in 1970.
For 1980, the following forecasts have been made:
— 40,000 nuclear MW (Electrical World May 1961)
— 45,000 nuclear MW (General Atomics)
— 31,000 nuclear MW (Johnson)
— 50,000 to 80,000 (Edison Electric Institute)
We have finally settled on an average proportion of 20% for nuclear power, i.e. 38,000 MW to be installed between 1970 and 1980. This figure, on the basis of hypotheses
tq; which we refer later on, is in line with a natural uranium consumption of around
60,000 tons, which is reconcilable with the evaluation of 50,000 to 70,000 tons of U recently
put forward by Mr. JOHNSON of the AEC (75,000 to 100,000 short tons of U308).
5. Canada
Same basis as for the US. Installed capacity in 1970 has been assumed as being equal to 1,000 MWe.
6. Other Countries of the Free World
We have assumed that 10,000 nuclear MWe will be installed between 1970 and 1980. This figure is certainly very much on the conservative side, since Japan alone is expected to have as much as 7,000 to 9,000 nuclear MW by 1980.
II. URANIUM
1. Initial Loads
Reduced to terms of natural uranium, necessary at the outset, the figures we have postulated are:
— natural uranium-graphite: 0.8 tons per installed MWe;
— ordinary water-enriched uranium: 0.8 tons per installed MWe.
These identical figures are in line with the hopes raised by the most recent designs drawn up for each of the two strings.
2. Consumption
Reduced to terms of natural uranium necessary at the outset, the figures we have postulated are:
— natural uranium-graphite: 40 tons per TWh (burn-up of 3,500 MW d / t ) ;
— ordinary water-enriched uranium: 30 tons per TWh (it is the disposal rate for isotope separation plants which is the determining factor in this case).
These figures are based on present-day techniques. There will undoubtedly be further improvements which will reduce specific consumption, but that would mean an additional fall in the cost of nuclear energy and consequently a more rapid rate of expansion than we have allowed for. The two phenomena, would therefore tend to cancel each other out to some extent.
The use of heavy-water plants might bring about a very appreciable decrease in the foregoing figures, but this technique could in any case exert only a slight influence up to 1980. The same applies with even more force to breeder reactors, the technique of which is very new and, moreover, necessitates the production of plutonium before-hand in existing reactors.
BL
'"l'À
"ΐϋ
! 'nie
Tiví