information.
Author(s):Jayaratne, Ravindra; Wijeyesekera, D. Chitral
Title:Experimental investigation of hydrodynamic erosion of soils Year of publication:2010
EXPERIMENTAL INVESTIGATION OF HYDRODYNAMIC
EROSION OF SOILS
Ravindra Jayaratne and Chitral Wijeyesekera
School of Computing, Information Technology and Engineering, University of East London r.jayaratne@uel.ac.uk, chitral.wijeyesekera@uel.ac.uk
Abstract: Recent research studies revealed that most bridge piers and other hydraulic structures such as levees and embankments adopted in flood protection schemes in maritime environment have collapsed due to the failures attributed to scour associated with a soil–hydrodynamic interaction phenomenon (e.g. Shirole and Holt, 1991). Though erosion characteristics of coarse sands and gravels are relatively well known, soil-hydrodynamics interaction for finer sands such as silts and clays is not fully investigated. A series of small-scale laboratory experiments were conducted in a moveable sediment tank to investigate scour characteristics under various flow and soil conditions. The present paper discusses preliminary experimental observations and the analysis of hydrodynamic erosion of soils in line with the extensive research project „Mathematical and Physical Modelling of
Hydrodynamic Erosion of Soils (HES)‟ carried out under the „UEL Promising Researcher Fellowship
2009-2010‟ funded by the University of East London (UEL).
1. Introduction
During the last thirty years, nearly thousand bridges have collapsed in the world and 60% of the failures are attributed to scour (Shirole and Holt, 1991) associated with a soil–hydrodynamic interaction phenomenon. In comparison, failure due to earthquakes accounts only for 2% of the bridge failures. Scour/erosion of sediments is also attributed as the cause of failure in other hydraulic structures such as levees and embankments adopted in flood protection schemes in maritime environment. Therefore, these structures need to be designed to withstand for severe flow conditions.
Ting at al. (2001) conducted a series of small-scale laboratory experiments to study local scour at circular piers founded on clay and sand. The effects of Reynolds and Froude numbers and flow depth on scour depth was investigated using medium and fine uniform-silica sand, where average diameters, D50 were 0.6mm and 0.14mm
respectively. They observed that at low
Reynolds numbers, the depth of scour was the same all around the piers while at higher Reynolds numbers, the scour holes developed mainly behind the piers.
Though erosion characteristics of coarse sands and gravels are relatively well known, this hydrodynamic-soil interaction for finer sands such as silts and clays is not fully understood. The current accepted practice for scour prediction of very coarse grained material is mostly based on research studies of model tests in clean coarse sands apart from a few recent full scale evaluations for scour round bridges. The flow velocity is a dominant parameter determining the erosion rate of sandy beds and its subsequent sediment transport characteristics.
various modes of sediment transport processes such as sliding, rolling or suspension of different soils types. The scale effects for extrapolating laboratory experiments to full-scale prototype measurements can be better understood through the proposed mathematical model. This paper therefore presents and discusses the characteristics of various hydraulic parameters such as flow discharge and mean flow velocities, and soil sample properties such as average grain diameter, sand sample thickness and its diameter and orientations with the longitudinal and lateral spread length of sediment plume.
2. Hydraulic Theory
Hydrodynamic scour can be categorised broadly into three groups, viz;
a) Erosion of bottom bed without any obstacles,
b) Scour induced by the presence of piers, abutments etc., and
c) Channel migration – lateral movement of bottom bed/bed soils.
The physics and relevant existing formulae in category a) is explained in this section, as it is of particular interest to the thrust of this paper.
Clean sand and gravel erode particle by particle by sliding and rolling. Neglecting electromagnetic and electrostatic forces between particles and assuming the resultant force exerted by the water on the soil particle is a shear force parallel to the eroding surface, the critical shear stress (τc),
which is the threshold shear stress for the initiation of sediment motion, can be written as (White, 1940):
c
A
where W is the submerged weight of the particle, Ac is the effective area of the sand
particle over the shear stress is applied and
ϕ is the friction angle between two particles.
If the particle is a sphere, Eq. (1) can be replaced with: tan 6 ) ( 3 50 n w s c D
g (2)
or 50 3 tan ) ( 2 n w s c D g (3)
where ρs is the density of the particle, ρw is
the density of water, g is the gravitational acceleration, Dn50 is the average grain
diameter and α is the ratio between effective and maximum cross section of the spherical particle.
Since the critical shear stress is linearly proportional to the average grain diameter, Briaud et al. (1999) observed using the Erosion Function Apparatus (EFA) for sand and gravel the empirical relationship given in Eq. (4):
) ( ) / ( 50 2 mm D m N n c (4)
Further, it was confirmed that sliding mechanism was not the only eroding mechanism, or at least not the only mechanism involved. The same authors performed experiments for silts and clays and found that Dn50 was not a good predictor
for τc. As in such soils the scour resistance is
soils erode particle by particle and evidence was due to the unclear of water (Briaud et al., 1999). After comparing shear stress (τ) values obtained from various methods, it was proposed to calculate τ for the EFA was by using the Moody diagram (Moody, 1944).
Shear stress can be written as:
2
8 1
V
f (5)
where f is the friction factor obtained from Moody diagram, ρ is the density of water and V is the mean flow velocity in the pipe. Friction factor, f is a function of:
D VD
f , (6)
where D is the hydraulic diameter [=2ab/(a+b)], a and b are dimensions of rectangular tank, ν is the kinematic viscosity of water, ε is hydraulic roughness (=Dn50/2).
3. Experiments
The Ahlborn sediment mobile bed tank (4.0×0.6×0.2m) in the hydraulic laboratory at University of East London (UEL) was used to perform the experiments. Soil samples with different thicknesses were placed at a distance of 1.5m from the upstream side, and along the centre line of the tank, assisted with a Perspex locating sampling ring of various diameters. The relevant Perspex sampling ring was removed before each experiment taking necessary care to prevent any disturbance to the sample being tested. A plastic X-Y grid system was attached on the bottom of the tank to measure the longitudinal and lateral spread lengths of the eroded soil.
The test soils were a series of uniform soils of known particle size distributions with
known uniformity coefficients and effective sizes. The uniformity of generated flow was initially checked by introducing Potassium Permanganate (KnNO4) dye into the flow.
[image:4.595.309.525.469.701.2]The propeller-type current meters (Velocity range 0-1.5m/s) were used to monitor the uniformity of flow at the upstream and downstream ends. The flow rate was varied as desired via a rheostat control of the voltage input into the pump. Longitudinal and lateral spread of the sediment plume was recorded using a SONY digital video camera with a capture rate of 25 frames per second (fps), mounted above the tank. This facility enabled observations to be recorded at preset times and therefore the erosion rate and pattern were continuously monitored. A digital stop watch was used to record the time taken for erosion, dispersion and subsequent deposition of the sand as a consequence of the scouring process. Experiments were repeated at least 5 times for each test condition to ascertain reproducibility and representability of the tests. Figure 1 illustrates the sectional and plan views of the experimental set-up.
Figure 1. Schematic views of experimental set-up in the Ahlborn mobile bed tank.
Water Flow Shear Stress(τ)
Mobile Bed Tank Bed
Protruding Portion of Sand
Water Depth Current
Meter
Current Meter
Water Flow
Soil Sample
Mobile Bed Model Tank
Current Meter
Sediment Plume Current Meter
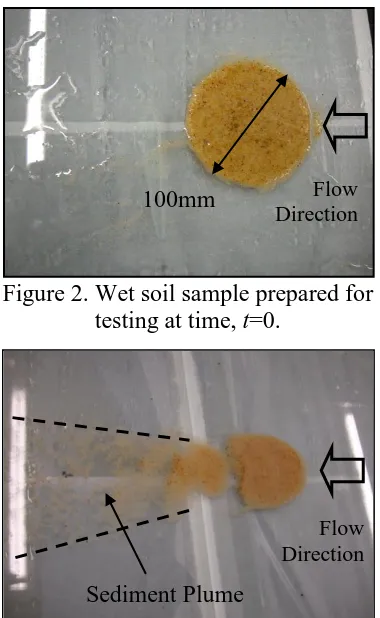
Figure 2. Wet soil sample prepared for testing at time, t=0.
Figure 3. Development of a sediment plume at time, t=30.0s.
An example of 100mm diameter wet soil sample placed on the tank bed is shown in Figure 2. Figure 3 shows the observation of the resulting sediment plume at a known time t=30.0s. Table 1 shows the test conditions used in these preliminary experiments.
The ratio of longitudinal and lateral spread of the sediment plume was observed to increase significantly with the water flow rate for smaller diameter wet soil sample (d=50mm). It was observed and can therefore be confirmed that the spread length ratio is independent of the sample thickness for Q=1.0-3.0 l/s (see Figure 4).
experiments.
Parameter Value
Soil type Sand, Gravel Average grain diameter,
Dn50 (mm)
0.20, 0.35
Soil condition Wet, Dry Sample diameter, d (mm) 50.0, 100.0,
150.0 Sample thickness, z (mm) 1.0, 2.0, 3.0 Sample orientation 1 sample, 2
samples in parallel, 3 samples in parallel Flow rate, Q (l/s) 1.0 - 3.0
4. Results
The measured parameters under preliminary experiments were water flow depth (h), upstream and downstream velocities (u1 and
u2), longitudinal (l1) and lateral (l2) erosion
spread lengths and time (t) taken for scour before the equilibrium occurs. Flow rate is the representative parameter for flow velocity therefore the analysis was carried out with respect to it.
100mm Flow Direction
Sediment Plume
[image:5.595.305.526.149.351.2]10.0 12.0 14.0 16.0
0.0 1.0 2.0 3.0
S
p
rea
d
L
eng
th
Ratio
(
-)
[image:6.595.310.514.112.296.2]Flow Rate (l/s) z=1.0mm (Wet Soil) z=2.0mm (Wet Soil) z=3.0mm (Wet Soil) z=1.0mm (Dry Soil) z=2.0mm (Dry Soil) z=3.0mm (Dry Soil)
Figure 4. Variation of longitudinal/lateral spread length ratio vs. water flow rate for
d=50mm, Dn50=0.35mm, wet and dry soils
of single sample.
Similar analysis was carried out for
d=100mm, 150mm Dn50=0.35mm, wet and
dry soils of single sample.
6.0 8.0 10.0
0.0 1.0 2.0 3.0
S
p
rea
d
L
eng
th
Ratio
(
-)
Flow Rate (l/s) z=1.0mm (Wet Soil) z=2.0mm (Wet Soil) z=3.0mm (Wet Soil) z=1.0mm (Dry Soil) z=2.0mm (Dry Soil) z=3.0mm (Dry Soil)
Figure 5. Variation of longitudinal/lateral spread length ratio vs. water flow rate for
d=100mm, Dn50=0.35mm, wet and dry soils
of single sample.
4.0 6.0 8.0
0.0 1.0 2.0 3.0
S
p
rea
d
L
eng
th
Ratio
(
-)
[image:6.595.79.289.114.312.2]Flow Rate (l/s) z=1.0mm (Wet Soil) z=2.0mm (Wet Soil) z=3.0mm (Wet Soil) z=1.0mm (Dry Soil) z=2.0mm (Dry Soil) z=3.0mm (Dry Soil)
Figure 6. Variation of longitudinal/lateral spread length ratio vs. water flow rate for
d=150mm, Dn50=0.35mm, wet and dry soils
of single sample.
It was noticed that the dry soils spread faster than that of wet soils for the same sample diameter due to the less moisture content in the dry soil sample (see Figures 4-6).
A similar propensity as in Figure 4 can be seen in Figures 5-6 for the soil samples with an increased diameter from 50mm to 150mm. However, it is noteworthy that the spread length ratio did not seem to change probably due to the domination of the gravitational forces acting on the coarse sand grains over the shearing forces, and hence the scour rate slows down. The highest spread length ratio was observed from the smaller diameter soil sample (d=50mm) among the other tested samples (d=100mm, 150mm).
Friction factors (f) and shear stresses (τ) on
[image:6.595.76.285.441.631.2]1.0mm, 2.0mm and 3.0mm.
0.0 10.0 20.0 30.0 40.0
0.0 10.0 20.0 30.0 40.0
Ca
lc
ulated
S
hea
r
S
tr
e
s
s
(
N/c
m
2)
[image:7.595.84.288.158.342.2]Mean Flow Velocity (cm/s) 100mm Diameter Wet Soil Sample (Dn50=0.35mm)
Figure 7. Influence of sample protrusion on calculated shear stress from Moody diagram
(1944).
5. Conclusions
A series of preliminary small-scale laboratory experiments on soil-hydrodynamics interaction for gravel and sands carried out with the Ahlborn sediment moveable tank of the hydraulics laboratory at the University of East London. Tank has provided promising observations to study the influence of hydrodynamics on soil erosion. Spread length of sediment plumes depends on the soil sample diameter with the flow rate. Smaller the sample diameter is the higher the spread length ratio due to the domination of the gravitational forces acting on soil grains. Moody diagram (1944) approach was adopted to compute the hydraulic shear stresses acting on the soil particles for different protrusions.
The Ahlborn sediment mobile tank will be modified in order to incorporate into its strengthened fibre glass base a protruding 100mm diameter thick walled Perspex soil sample tube. The advantage of this apparatus is that erodibility of soils can be measured on a site-specific basis using standard undisturbed samples. Distribution of vertical and lateral spread of sediment plumes will be recorded using a multiple time lapse digital cameras mounted on the end and plan positions of the tank. The highly controlled precise, comprehensive scour data sets under various flow conditions will be gathered using a re-fabricated and modified tank. Coarse, clay and silts soil samples from various locations around UK will be chosen for testing with the guidance given in Wijeyesekera (1998, 2001).
A relationship between scour rate and flow velocity for uniform soils of different effective sizes ranging from coarse sand to very fine silt, leading to a design chart for scour predictions will be obtained. Quantitative parameters to define the patterns of the vertical and lateral spread of the plumes of eroded soils will be established. A simple mathematical model to predict scour/erosion rate will be developed using dimensional analysis and best-fit technique, explained in Jayaratne (2004).
7. References
Jayaratne, M.P.R. Modelling of suspended sediment concentration and cross-shore beach deformation model, PhD Thesis,
Yokohama National University, 2004, pp. 133.
Moody, L.F., Friction factors for pipe flow, Trans. American Soc. of Mech. Engrs., 1944, pp. 1-66.
Shirole, A.M., and Holt, R.C. Planning for a comprehensive bridge safety assurance program, Transport Research Record 1290, Transportation Research Board, Washington D.C., 1991, pp. 137-142.
Ting, F.C.K., Briaud, J-L., Chen, H.C., Gudavalli, R., Perugu, S., and Wei, G. Flume tests for scour in clay at circular
piers, Journal of Hydraulic Engineering, Vol. 127, No. 11, 2001, pp. 969-978.
White, C.M., The equilibrium of grains on the bed of a stream, Proc. Royal Soc. of London, 174(958), 1940, pp. 322-338. Wijeyesekera, D.C. The significance of dilatancy of the backfill on the soil structure interaction of polypropylene reinforcement, 2nd International Conference on Ground Improvement Techniques, Singapore, 1998, pp. 537-544.