A Fuzzy Anomaly Detection System based on Hybrid PSO-Kmeans Algorithm
in Content-Centric Networks
Amin Karami∗
Computer Architecture Department (DAC), Universitat Polit`ecnica de Catalunya (UPC), C6-E102 Campus Nord, C. Jordi Girona 1-3. 08034 Barcelona, Spain
Manel Guerrero-Zapata
Computer Architecture Department (DAC), Universitat Polit`ecnica de Catalunya (UPC), D6-212 Campus Nord, C. Jordi Girona 1-3. 08034 Barcelona, Spain
Abstract
In Content-Centric Networks (CCNs) as a possible future Internet, new kinds of attacks and security challenges -from Denial of Service (DoS) to privacy attacks- will arise. An efficient and effective security mechanism is required to secure content and defense against unknown and new forms of attacks and anomalies. Usually, clustering algorithms would fit the requirements for building a good anomaly detection system. K-means is a popular anomaly detection method to classify data into different categories. However, it suffers from the local convergence and sensitivity to selection of the cluster centroids. In this paper, we present a novel fuzzy anomaly detection system that works in two phases. In the first phase -the training phase- we propose an hybridization of Particle Swarm Optimization (PSO) and K-means algorithm with two simultaneous cost functions as well-separated clusters and local optimization to determine the optimal number of clusters. When the optimal placement of clusters centroids and objects are defined, it starts the second phase. In this phase -the detection phase- we employ a fuzzy approach by the combination of two distance-based methods as classification and outlier to detect anomalies in new monitoring data. Experimental results demonstrate that the proposed algorithm can achieve to the optimal number of clusters, well-separated clusters, as well as increase the high detection rate and decrease the false positive rate at the same time when compared to some other well-known clustering algorithms.
Keywords: Content-Centric Networks, Anomaly Detection, Particle Swarm Optimization, K-means, Clustering Analysis, Fuzzy Set
1. Introduction
Content-Centric Networking (CCN, also referred to as Information-Centric Networking or Data-Centric Networking, Named-Data Networking) has emerged to overcome the inherent limitations of the current In-ternet regarding content security and privacy, and to provide a better trust model [1, 2]. Unlike the cur-rent Internet (host-centric approach) in which security
∗Corresponding author, Telephone: 0034-934011638
Email addresses:[email protected](Amin Karami), [email protected](Manel Guerrero-Zapata)
URL:http://personals.ac.upc.edu/amin(Amin Karami),http://personals.ac.upc.edu/guerrero(Manel Guerrero-Zapata)
or-der to disarm new kinds of attacks, anomalous traffics, and any deviation, not only the detection of the malevo-lent behavior must be achieved, but the network traf-fic belonging to the attackers should be also blocked [8, 9, 10]. In an attempt to tackle with the new kinds of anomalies and the threat of future unknown attacks, many researchers have been developing Intrusion De-tection Systems (IDS) to help filter out known malware, exploits and vulnerabilities [6, 11]. Anomaly detec-tion systems are becoming increasingly vital and valu-able tools of any network security infrastructure in order to mitigate disruptions in normal delivery of network services due to malicious activities, Denial of Service (DOS) attacks and network intrusions [12, 13]. An IDS dynamically monitors logs and network traffics, apply-ing detection algorithms to identify potential intrusions and anomalies within a network [14]. In recent years, data mining techniques specially unsupervised anomaly detection have been employed with much success in the area of intrusion detection [15, 16, 17]. Generally, un-supervised learning or cluster analysis algorithms have been utilized to discover natural groupings of objects and find features inherent and their deviations with sim-ilar characteristics to solve the detection problems of the abnormal traffics and unknown forms of new attacks [18, 19]. Data clustering algorithms can be either hier-archical or partitioning [20, 21]. In this paper, we focus on the partitioning clustering and in particular, a pop-ular method called K-means clustering algorithm. The K-means algorithm is one of the most efficient cluster-ing algorithms [22, 23, 24]. This algorithm is simple, easy to implement, straightforward, suitable for large data sets, and very efficient with linear time complexity [25]. However, it suffers from two main drawbacks: (1) the random selection of centroid points and determining the number of clusters may lead to different clustering results, (2) The cost function is not convex and the K-means algorithm may contain many local optimum [26]. In the previous work [27], we employed K-means clus-tering in our anomaly detection system over CCN. But, the results were not appropriate due to the large num-ber of clusters, trapping in the local optimum solution, and changing results by running the algorithm with the constant parameters in several times. However, if good initial clustering centroids can be assigned by any of other global optimal searching techniques, the K-means would work well in refining the cluster centroids to find the optimal centroids [28, 29].
To overcome these drawbacks, we present a fuzzy anomaly detection system in two phases: training and detection. In the training phase, we apply a meta-heuristic algorithm called PSO (Particle Swarm
Opti-mization) which can find the optimal or near optimal solution by the least iterations [30, 31, 32]. We employ the combination of the ability of global search of the PSO with a novel boundary handling approach and the fast convergence of the K-means to avoid being trapped in a local optimal solution.
On the other hand, the most clustering methods usually try to minimize the Mean Square Error (MSE) between data points and their cluster centroids [33, 34]. The MSE is not suitable for determining the optimal number of clusters. Since it decreases, the number of the clus-ters increase. We develop our method for globally opti-mal placement of data points as well-separated clusters by low intra-cluster cohesion and high inter-cluster sep-aration. But the optimal placement can increase MSE [35]. Thus, we apply MSE for local optimization, i.e., in the case of each cluster separately to decrease the er-ror caused by corresponding data points and their clus-ter centroids. This simultaneous approach -application of two cost functions (well-separated clusters and local optimization)- in PSO can lead to the optimal number of clusters and well-separated clusters. When the opti-mal placement of clusters centroids and objects are de-fined, they are sent to the second phase. In the detection phase, we apply a novel fuzzy decision approach to give a fuzzy detection of normal or abnormal results in the new monitoring data that do not appear in the training data set. Because fuzzy approach can reduce the false positive rate with higher reliability in determining intru-sive activities, due to any data (normal or attack) may be similar (closest distance) to some clusters.
This paper is organized as follows. Section 2 contains related work. Section 3 presents security issues in CCN. Section 4 provides a general overview of the PSO algo-rithm. The K-means clustering algorithm and clustering problem are surveyed in Sections 5 and 6, respectively. Fuzzy set theory describes in Section 7. Section 8 de-scribes our proposed method. Section 9 contains exper-imental results and analysis. Finally, we conclude in Section 10.
2. Related Work
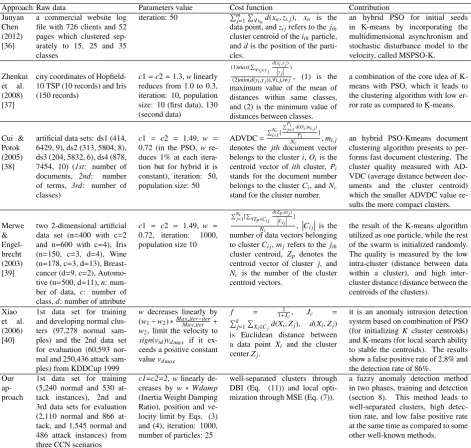
Table 1: Comparison of hybrid PSO+K-means approaches in clustering problems
Approach Raw data Parameters value Cost function Contribution Junyan
Chen (2012) [36]
a commercial website log file with 726 clients and 52 pages which clustered sep-arately to 15, 25 and 35 classes
iteration: 50 Pm j=1
P
∀xnd(xn,zi,j), xn is the
data point, andzi jrefers to thejth
cluster centroid of theithparticle,
anddis the position of the parti-cles.
an hybrid PSO for initial seeds in K-means by incorporating the multidimensional asynchronism and stochastic disturbance model to the velocity, called MSPSO-K.
Zhenkui et al. (2008) [37]
city coordinates of Hopfield-10 TSP (Hopfield-10 records) and Iris (150 records)
c1=c2=1.3,wlinearly reduces from 1.0 to 0.3, iteration: 10, population size: 10 (first data), 130 (second data)
(1)max(P
∀xi∈y j d(xi,y j)
y j )
(2)min(d(yi,yj)),∀i,j,i,j, (1) is the
maximum value of the mean of distances within same classes, and (2) is the minimum value of distances between classes.
a combination of the core idea of K-means with PSO, which it leads to the clustering algorithm with low er-ror rate as compared to K-means.
Cui & Potok (2005) [38]
artificial data sets: ds1 (414, 6429, 9), ds2 (313, 5804, 8), ds3 (204, 5832, 6), ds4 (878, 7454, 10) (1st: number of documents, 2nd: number of terms, 3rd: number of classes)
c1 = c2 = 1.49, w = 0.72 (in the PSO,w re-duces 1% at each itera-tion but for hybrid it is constant), iteration: 50, population size: 50
ADVDC= PNc
i=1[
PPi
j=1d(Oi,mi,j)
Pi ]
Nc ,mi,j
denotes the jthdocument vector belongs to the clusteri,Oiis the
centroid vector ofithcluster, Pi
stands for the document number belongs to the clusterCi, andNc
stand for the cluster number.
an hybrid PSO-Kmeans document clustering algorithm presents to per-forms fast document clustering. The cluster quality measured with AD-VDC (average distance between doc-uments and the cluster centroid) which the smaller ADVDC value re-sults the more compact clusters.
Merwe & Engel-brecht (2003) [39]
two 2-dimensional artificial data set (n=400 with c=2 and n=600 with c=4), Iris (n=150, c=3, d=4), Wine (n=178, c=3, d=13), Breast-cancer (d=9, c=2), Automo-tive (n=500, d=11),n: num-ber of data, c: number of class,d: number of attribute
c1 = c2 = 1.49, w = 0.72, iteration: 1000, population size 10
PNc
j=1[
P
∀Zp∈Ci j d(Zp,m j)
Ci j ]
Nc ,
Ci j
is the
number of data vectors belonging to clusterCi j,mjrefers to the jth
cluster centroid, Zp denotes the
centroid vector of cluster j, and Nc is the number of the cluster
centroid vectors.
the result of the K-means algorithm utilized as one particle, while the rest of the swarm is initialized randomly. The quality is measured by the low intra-cluster (distance between data within a cluster), and high inter-cluster distance (distance between the centroids of the clusters).
Xiao et al. (2006) [40]
1st data set for training and developing normal clus-ters (97,278 normal sam-ples) and the 2nd data set for evaluation (60,593 nor-mal and 250,436 attack sam-ples) from KDDCup 1999
wdecreases linearly by (w1−w2)∗Max iterMax iter−iter+
w2, limit the velocity to sign(vid)vd max if it
ex-ceeds a positive constant valuevd max
f = 1+1J
c, Jc =
Pk j=1
P
Xi∈Cjd(Xi,Zj), d(Xi,Zj)
is Euclidean distance between a data point Xi and the cluster
centerZj.
it is an anomaly intrusion detection system based on combination of PSO (for initializingK cluster centroids) and K-means (for local search ability to stable the centroids). The results show a false positive rate of 2.8% and the detection rate of 86%.
Our ap-proach
1st data set for training (5,240 normal and 530 at-tack instances), 2nd and 3rd data sets for evaluation (2,110 normal and 866 at-tack, and 1,545 normal and 486 attack instances) from three CCN scenarios
c1=c2=2,wlinearly de-creases byw∗Wdamp (Inertia Weight Damping Ratio), position and ve-locity limit by Eqs. (3) and (4), iteration: 1000, number of particles: 25
well-separated clusters through DBI (Eq. (11)) and local opti-mization through MSE (Eq. (7)).
a fuzzy anomaly detection method in two phases, training and detection (section 8). This method leads to well-separated clusters, high detec-tion rate, and low false positive rate at the same time as compared to some other well-known methods.
only select linearly the best set of parameters but ful-fill also exploration and exploitation issues. Then, we propose a fuzzy detection method by the combination of two distance-based methods as classification and out-lier. We design this hybrid system over CCNs to find the optimal number of clusters with high separation from neighbor clusters and low compactness of local data points, increase detection rate, and decrease false pos-itive rate at the same time. Table 1 summarizes the comparison of applied PSO with K-means in different
domains and with various parameters.
3. Content-Centric Networks (CCNs)
from. On the way back, all the intermediate nodes store a copy of content in their caches to answer to proba-ble same Interest requests from subsequent requesters [41, 42]. CCN routers must include the following com-ponents:
1. Content Store (CS): a storage space for content caching and retrieval,
2. Forwarding Interest Base (FIB): a table with name prefixes and corresponding outgoing interfaces for routing incoming Interests packets,
3. Pending Interest Table (PIT): a table with the cur-rently unsatisfied Interests and their corresponding incoming interfaces.
The following is a list of some of the main security is-sues in CCN:
1. Architectural Risks: Since contents can be cached on each CCN router, the caches can jeop-ardize user privacy, content privacy and perform cache pollution attacks. Because users leave com-munication and exchanged data traces in the caches and content can be extracted by attackers [41, 43, 44]. And since, any attacker can get that informa-tion from the caches by either using Interest pack-ets with special query features or by probing the caches; user’s privacy is very vulnerable [45]. 2. DoS attacks: There are new ways to perform DoS
attacks by either making content unreachable for requests or forcing fake responses [7, 45, 46, 47].
To make content unreachable for requests: a source can be disrupted by sending large numbers of new and distinct Interests (Interest Flooding Attacks) or an attacker can decline the cache performance by overloading the cache when a cache receives a le-gal traffic. When attackers get high access control in a router, they can make disruption in routing by do not forwarding requests or enforce misbehaving in Pending Interest Table (PIT) routers in order to prevent content retrieval.To serve fake responses: an attacker can make routers believe a valid con-tent is invalid and reply a ”not valid” response, de-liberately. A content can also be spoofed by inject-ing fake responses that are not signed or are signed with a wrong key, hoping that the user accepts the response in source. An old content (which may be unsecured) signed with the right key can be also re-placed with the original one, or an attacker may get high access to the source’s signing key to sign con-tent with the correct key. Another possible threat is the misbehaving of the distributed directory system
(a digital certificate storage of authority identities) where a client should query for a digital certificate of a content provider, e.g., not replying to a query [27, 48].
4. Particle Swarm Optimization (PSO)
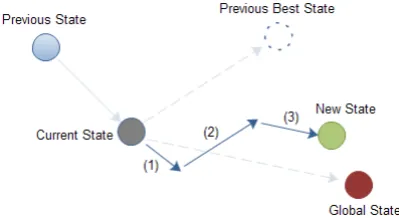
The PSO was firstly introduced by Kennedy and Eberhart in 1995 [49]. It was inspired by the social be-havior of a bird flock or fish school. It is a population based meta-heuristic method that optimizes a problem by initializing a flock of birds randomly over the search space where each bird is referred as a ”particle” and the population of particles is called ”swarm”. The particles move iteratively around in the search space according to a simple mathematical formula over the particle’s po-sition and velocity to find the global best popo-sition. In then-dimensional search space, the position and the ve-locity ofith particle attth iteration of algorithm is de-noted by vectorXi(t)=(xi1(t),xi2(t), ...,xin(t)) and
vec-torVi(t)=(vi1(t),vi2(t), ...,vin(t)), respectively. This
so-lution is evaluated by a cost function for each particle at each stage of algorithm to provides a quantitative value of the solution’s utility. Afterwards, a record of the best position of each particle based on the cost value is saved. The best previously visited position of the particleiat current stage is denoted by vectorPi =(pi1,pi2, ...,pin) as the personal bests. During this process, the position of all the particles that gives the best cost until the cur-rent stage is also recorded as the global best position denoted byG=(g1,g2, ...,gn). The structure of the ve-locity and the position updates is depicted in Fig. 1. Each iteration is composed of three movements: in the first movement, particle moves slightly toward the front in the previous direction with the same speed. In the second movement, it moves slightly toward the previ-ous itself best position. Finally, in the third movement, moves slightly toward the global position. At each iter-ation, the velocity and the position of each particle are defined according to Eqs. (1) and (2), respectively:
Vi(t)=ω∗Vi(t−1)+c1ϕ1(Pi−Xi(t−1))
+c2ϕ2(G−Xi(t−1)) (1)
Figure 1: Description of velocity and position updates in PSO for a 2-dimensional parameter space
weightωwhich have been described in [52, 53].c1and
c2 are positive constant (social) parameters called
ac-celeration coefficients which control the maximum step size between successive iterations. ϕ1 andϕ2 are two
independently positive random number drawn form a uniform distribution between 0.0 and 1.0. According to [51], a good starting point is to setωstartto 0.9,ωend to 0.4, andc1=c2=2.
The velocity and position of a particle might end up positioning the particle beyond the boundary [Varmin,
Varmax] of the search space. Therefore, the need of having a scheme which can bring such particles back into the search space. In our proposal, we applySet On Boundarystrategy. According to this strategy the parti-cle is reset on the bound of the variable which it exceeds [54]. LetXCdenote a current velocity or position of a solution, thenXCis set toXCnewas follows:
XC →XCnew=
−0.1∗(Varmax−Varmin)
i f XC <lowerbound
0.1∗(Varmax−Varmin)
i f XC>upperbound
(3)
An additional strategy called velocity reflection is also applied. Velocity reflection allows those particles that move toward the outside the boundary to move back into the search space according to Eq. (4).
Vi(t+1)→ −Vi(t+1) (4)
5. K-means Clustering Algorithm
The K-means algorithm [23] groups the set of data points into a predefined number of the clusters in terms of a distance function. The most widely used method is Euclidean distance in which a small distance implies a strong similarity whereas a large distance implies a low
similarity. The Eq. (5) shows the Euclidean distance calculation between two data points (xand y) with N
objects in a n-dimensional space.
Distance(x,y)=
v u t N
X
i=1
(xi−yi)2 (5)
The standard K-means algorithm is summarized as fol-lows:
1 Randomly initialize the K cluster centroids. 2 Assign each object to the group with the closest
centroid. Euclidean distance measures the mini-mum distance between data objects and each clus-ter centroid.
3 Recalculate the cluster centroid vector, using
mj= 1
nj X
∀datap∈Cj
datap (6)
where,mjdenotes the centroid vector of the cluster
j,njis the number of the data vectors in clusterj,
Cjis the subset of the data vectors from clusterj, anddatapdenotes thepth data vector.
4 Repeat step 2 until the centroids do not change any more in the predefined number of iteration or a maximum number of iterations has been reached.
6. Clustering Problem
Mean Square Error (MSE) is the average pairwise distance between data points and the corresponding cluster centroids. Usually distance is Euclidean dis-tance, but other metrics are also used. Given the set of cluster centroids (c), the set of corresponding data points (x),cxdenotes the cluster centroid corresponding to the x, andNis the number of data points, MSE can be calculated as:
MS E= 1 N
N X
i=1
d(xi,cx)2 (7)
Figure 2: Two steps of the proposed fuzzy anomaly detection system in CCN
the optimal MSE would be number of the cluster equals to data set points, and the MSE=0. Therefore, we ap-ply Davies Bouldin Index (DBI) [56] as the criterion since, in our experiments, we have found it quite reliable among the variety of alternative internal clustering val-idation metrics; with regard to pointing out the correct number of clusters. DBI takes into account both com-pactness (intra-cluster diversity) and separation (inter-cluster diversity) criteria that makes similar data points within the same clusters and places other data points in distinct clusters. The intra-cluster diversity of a cluster
jis calculated as:
MS Ej= 1
N
N X
i=1
d(xi,cx)2 (8)
The inter-cluster distance of the clusteriandjis mea-sured as the distance between their centroidsciandcj. According to Eq. (9), the closeness of the two clusters can be calculated by the sum of their MSE divided by the distance of their centroids.
Closenessi,j=
MS Ei+MS Ej
d(ci,cj)
(9)
Small value ofClosenessi,jdenotes that the clusters are separated and a large value denotes that the clusters are
close to each other. To calculate DBI value, the highest value from Eq. (9) is assigned to cluster as its cluster similarity:
Closenessi=max(Closenessi,j),i, j (10)
Finally, the overall DBI validity is defined according to Eq. (11), which the lower DBI value means better clus-tering result.
DBI= 1 M
M X
i=1
Closenessi (11)
7. Fuzzy Set
Fuzzy set theory is a method of representing the vagueness and imprecision which is appropriate for anomaly detection for two major reasons [57, 58]:
1. The anomaly detection problem involves many nu-meric attributes in collected audit data and various derived statistical measurements. Building models directly on numeric data causes high detection er-rors, and
Fuzzy logic also can work with other popular data min-ing technique as outlier detection. Since malicious behavior is naturally different from normal behavior, abnormal behavior should be considered as outliers [59, 60]. Fuzzy logic can help to construct more ab-stract and flexible patterns for intrusion detection and thus greatly increase the robustness and adaption abil-ity of detection systems [58]. Hence, fuzzy approach can reduce the false positive rate with higher reliability in determining intrusive activities, due to any data (nor-mal or attack) may be similar (closest distance) to some clusters.
8. Proposed Fuzzy Anomaly Detection System
This section presents the details of our proposed method. Proposed fuzzy anomaly detection system con-sists of two phases: training and detection. Fig. 2 shows the proposed fuzzy anomaly detection system steps. Each phase is also described as follows.
8.1. Training Phase
The training phase is based on the hybridization of PSO and K-means clustering algorithm with two si-multaneous cost functions: well-separated clusters (low intra-cluster distance and high inter-cluster distance) by DBI and local optimization by MSE to find the optimal number of clusters. Before training process, data sam-ples should be normalized into [0 1], when dealing with parameters of different units and scales [61, 62]. The steps of the training phase is presented as follows:
Step 1: Define problem and PSO parameters
1.nVar: number of the cluster centroids,nPop: size of the population;
2. Define constriction coefficients parameters, c1 =
c2=2 and initiallyw=1;
3. Define inertia weight damping ratio (Wdamp =
0.99) to linearly decreasew;
4.Define position and velocity limits as Varmax = 1 andVarmin=0;
5. An initial population is generated based on the
nPopwith following parameters:
particle.Position=am×nVarmatrix of random num-bers generated from the continuous uniform distribu-tions with lower (Varmin) and upper (Varmax) endpoints.
mdenotes size of the data set features;
particle.Cost = calculate the DBI for each particle based on the generatedparticle.position;
particle.Velocity=a zero matrix inm×nVarsize;
particle.S ol = [], (S ol is a structure of two objective functions: Cost1 (DBI) and Cost2 (MSE));
particle.Best.Position = [] (keep the personal best of the position);
particle.Best.Cost = [] (keep the personal best of the cost);
particle.Best.S ol = [] (keep the personal best of the
S ol);
6.Globalbest=[] (keep the global best of swarm); 7.Repeat the following loop until the target or maxi-mum iteration is completed:
8.SelectParticle(i),i=1,2, ...,nPopand run the fol-lowing PSO algorithm forParticle(i):
8.1.Update velocity by Eq. (1); 8.2.Apply velocity limits by Eq. (3); 8.3.Update position by Eq. (2); 8.4.Velocity mirror effect by Eq. (4); 8.5.Apply position limits by Eq. (3);
8.6.Evaluation of two objective functions, DBI by Eq. (11) and MSE by Eq. (7);
8.7.Update personal best:
i f (particle(i).Cost== particle(i).Best.Cost)AND
(particle(i).S ol.MS E <particle(i).Best.S ol.MS E)
particle(i).Best.Position=particle(i).Position;
particle(i).Best.S ol=particle(i).S ol;
else i f (particle(i).Cost<particle(i).Best.Cost)
particle(i).Best.Position=particle(i).Position;
particle(i).Best.Cost=particle(i).Cost;
particle(i).Best.S ol=particle(i).S ol;
end end;
8.8.Update global best:
i f((particle(i).Best.Cost==GlobalBest.Cost)AND
(particle(i).Best.S ol.MS E <GlobalBest.S ol.MS E))
OR(particle(i).Best.Cost<GlobalBest.Cost)
GlobalBest=particle(i).Best;
end;
9.ifi>nPopgo to the step 10; otherwise, seti=i+1 and go to the step 8;
10.Updatewbyw=w∗Wdamp;
11.If the maximum iteration or predefined target is not reached, seti =1 and go to the step 7; Otherwise, run K-means clustering algorithm by the obtained posi-tions of cluster centroids from PSO algorithm.
common category/class into each cluster:
Purity= 1 n
k X
q=1
max
1≤j≤ln j
q (12)
[image:8.595.73.276.290.341.2]Where,nis the total number of samples;lis the number of categories,nqj is the number of samples in clusterq that belongs to the original class j(1 ≤ j ≤l). A large purity (close to 1) is desired for a good clustering. If the all samples (data) in a cluster have the same class, the purity value set to 1 as a pure cluster. This purity metric (goodness value) is used in the detection phase.
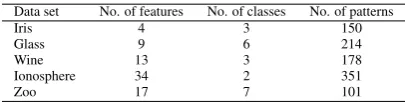
Table 2: The five applied benchmark data sets
Data set No. of features No. of classes No. of patterns
Iris 4 3 150
Glass 9 6 214
Wine 13 3 178
Ionosphere 34 2 351
Zoo 17 7 101
8.2. Detection Phase
The defined optimal placement of cluster centroids and data objects from training phase are sent to the sec-ond phase for outlier and anomaly detection when new monitoring data enter. In the detection phase, a fuzzy decision approach applied to detect attacks and anoma-lies. We deploy a combination of two distance-based methods, i.e., classification and outlier:
1 Classification: The distances between a data ob-ject and each clusters are calculated using the
goodness value of the cluster×average linkage. Average linkage approach considers small vari-ances, because it considers all members in the clus-ter rather than just a single point. However, it tends to be less influenced by extreme values than other distance methods [63]. A data object is classified as normal if it is closer to the one of the normal clusters than to the anomalous ones, and vice versa. This distance-based classification allows detecting known kind of abnormal or normal traffics with similar characteristics as in the training data set. 2 Outlier: An outlier (noise) is a data object that
dif-fers considerably from most other objects, which can be considered as an anomaly. For outlier de-tection, only the distance to the normal clusters (obtained from classification phase) is calculated bygoodness value of the closer normal cluster×
Chebyshev distance. In the Chebyshev distance (Eq. (13)), distance between two vectors is the greatest of their differences along any coordinate
dimension. It allows to detect better new anoma-lies that do not appear in the training data set. Be-cause it takes into account the maximum value dis-tance approach between any coordinate dimension that would lead to become more strict against data objects measurement.
Dchebyshev(p,c)=max(|pi−ci|) (13) Where,pis the data object andcis the centroids of the normal cluster with standard coordinatespiandci. The proposed fuzzy detection method consists of two inputs (classification and outlier), one output, and four main parts: fuzzification, rules, inference engine, and defuzzification. In fuzzification step, a crisp set of in-put data are converted to a fuzzy set using fuzzy lin-guistic terms and membership functions. In step 2, we construct rule base. Afterwards, an inference is made and combined based on a set of rules. In the defuzzi-fication step, the results of fuzzy output are mapped to a crisp (non-fuzzy) output using the membership func-tions. Finally, if the crisp output is bigger than a pre-defined threshold, an object is considered as an abnor-mal instance; otherwise, an object is a norabnor-mal instance. This fuzzy approach can improve our performance cri-teria (high detection rate and low false positive rate at the same time) as compared to a non-fuzzy approach.
9. Experimental Results and Discussion
9.1. Performance Measurement
We compared and evaluated the training phase of our proposed method with standalone PSO and K-means al-gorithms as well as preexisting methods from the lit-erature as [36], [37], [38], [39], and [40] which used different parameters and cost functions. We also em-ployed both MSE and DBI criteria on all evaluations. In order to evaluate the performance of each method, we use the Detection Rate (DR), False Positive Rate (FPR) and F-measure criteria. The detection rate is the num-ber of intrusions detected by the system from Eq. (14), the false positive rate is the number of normal traffics that was incorrectly classified as intrusion from Eq. (15) and F-measure is the weighted harmonic mean of pre-cision (positive predictive value) and recall (detection rate) from Eq. (17).
DR(Recall)= T ruePositive
T ruePositive+FalseNegative (14)
FPR= FalsePositive
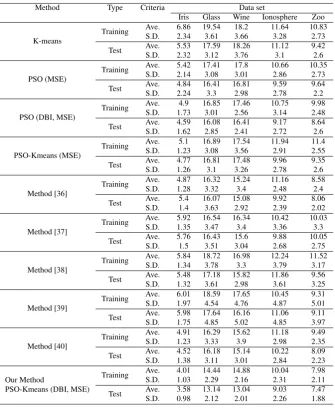
Table 3: Classification error (%) for our proposed method and applied methods
Method Type Criteria Data set
Iris Glass Wine Ionosphere Zoo
K-means
Training Ave. 6.86 19.54 18.2 11.64 10.83 S.D. 2.34 3.61 3.66 3.28 2.73
Test Ave. 5.53 17.59 18.26 11.12 9.42
S.D. 2.32 3.12 3.76 3.1 2.6
PSO (MSE)
Training Ave. 5.42 17.41 17.8 10.66 10.35 S.D. 2.14 3.08 3.01 2.86 2.73
Test Ave. 4.84 16.41 16.81 9.59 9.64
S.D. 2.24 3.3 2.98 2.78 2.2
PSO (DBI, MSE)
Training Ave. 4.9 16.85 17.46 10.75 9.98 S.D. 1.73 3.01 2.56 3.14 2.48
Test Ave. 4.59 16.08 16.41 9.17 8.64 S.D. 1.62 2.85 2.41 2.72 2.6
PSO-Kmeans (MSE)
Training Ave. 5.1 16.89 17.54 11.94 11.4 S.D. 1.23 3.08 3.56 2.91 2.55
Test Ave. 4.77 16.81 17.48 9.96 9.35
S.D. 1.26 3.1 3.26 2.78 2.6
Method [36]
Training Ave. 4.87 16.32 15.24 11.16 8.58
S.D. 1.28 3.32 3.4 2.48 2.4
Test Ave. 5.4 16.07 15.08 9.92 8.06 S.D. 1.4 3.63 2.92 2.39 2.02
Method [37]
Training Ave. 5.92 16.54 16.34 10.42 10.03
S.D. 1.35 3.47 3.4 3.36 3.3
Test Ave. 5.76 16.43 15.6 9.88 10.05 S.D. 1.5 3.51 3.04 2.68 2.75
Method [38]
Training Ave. 5.84 18.72 16.98 12.24 11.52 S.D. 1.34 3.78 3.3 3.79 3.17
Test Ave. 5.48 17.18 15.82 11.86 9.56 S.D. 1.32 3.61 2.98 3.61 3.25
Method [39]
Training Ave. 6.01 18.59 17.65 10.45 9.31 S.D. 1.97 4.54 4.76 4.87 5.01
Test Ave. 5.98 17.64 16.16 11.06 9.11 S.D. 1.75 4.85 5.02 4.85 3.97
Method [40]
Training Ave. 4.91 16.29 15.62 11.18 9.49 S.D. 1.23 3.33 3.9 2.98 2.35
Test Ave. 4.52 16.18 15.14 10.22 8.09 S.D. 1.38 3.11 3.01 2.84 2.23
Our Method
PSO-Kmeans (DBI, MSE)
Training Ave. 4.01 14.44 14.88 10.04 7.98 S.D. 1.03 2.29 2.16 2.31 2.11
Test Ave. 3.58 13.14 13.04 9.03 7.47 S.D. 0.98 2.12 2.01 2.26 1.88
Precision= T ruePositive
T ruePositive+FalsePositive (16) F−measure=2×Precision × Recall
Precision+Recall (17)
True negative and true positive correspond to a correct operating of the system when traffics are successfully predicted as normal and attacks, respectively. False pos-itive refers to normal traffics when are predicted as at-tack, and false negative is attack traffic when incorrectly predicted as normal traffic.
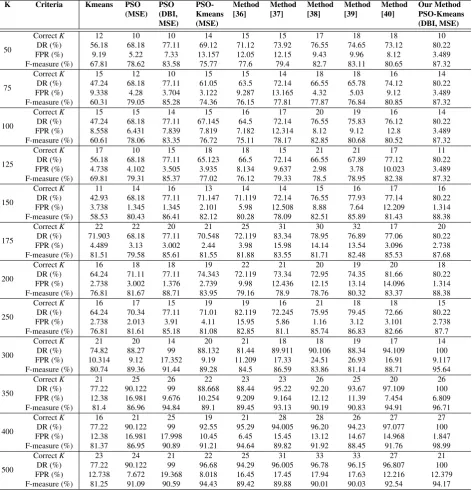
9.2. Benchmarking the proposed method
To assess the robustness and accuracy of our pro-posed method, we applied the five classic benchmark
Table 4: Comparison of our proposed method with some other methods
K Criteria Kmeans PSO
(MSE) PSO (DBI, MSE)
PSO-Kmeans (MSE)
Method [36]
Method [37]
Method [38]
Method [39]
Method [40]
Our Method PSO-Kmeans (DBI, MSE)
50
CorrectK 12 10 10 14 15 15 17 18 18 10
DR (%) 56.18 68.18 77.11 69.12 71.12 73.92 76.55 74.65 73.12 80.22
FPR (%) 9.19 5.22 7.33 13.157 12.05 12.15 9.43 9.96 8.12 3.489
F-measure (%) 67.81 78.62 83.58 75.77 77.6 79.4 82.7 83.11 80.65 87.32
75
CorrectK 15 12 10 15 15 14 18 18 16 14
DR (%) 47.24 68.18 77.11 61.05 63.5 72.14 66.55 65.78 74.12 80.22
FPR (%) 9.338 4.28 3.704 3.122 9.287 13.165 4.32 5.03 9.12 3.489
F-measure (%) 60.31 79.05 85.28 74.36 76.15 77.81 77.87 76.84 80.85 87.32
100
CorrectK 15 15 14 15 16 17 20 19 16 14
DR (%) 47.24 68.18 77.11 67.145 64.5 72.14 76.55 75.83 76.12 80.22 FPR (%) 8.558 6.431 7.839 7.819 7.182 12.314 8.12 9.12 12.8 3.489 F-measure (%) 60.61 78.06 83.35 76.72 75.11 78.17 82.85 80.68 80.52 87.32
125
CorrectK 17 10 15 18 18 15 21 21 17 11
DR (%) 56.18 68.18 77.11 65.123 66.5 72.14 66.55 67.89 77.12 80.22 FPR (%) 4.738 4.102 3.505 3.935 8.134 9.637 2.98 3.78 10.023 3.489 F-measure (%) 69.81 79.31 85.37 77.02 76.12 79.33 78.5 78.95 82.38 87.32
150
CorrectK 11 14 16 13 14 14 15 16 17 16
DR (%) 42.93 68.18 77.11 71.147 71.119 72.14 76.55 77.93 77.14 80.22 FPR (%) 3.738 1.345 1.345 2.101 5.98 12.508 8.88 7.64 12.209 1.314 F-measure (%) 58.53 80.43 86.41 82.12 80.28 78.09 82.51 85.89 81.43 88.38
175
CorrectK 22 22 20 21 25 31 30 32 17 20
DR (%) 71.903 68.18 77.11 70.548 72.119 83.34 78.95 76.89 77.06 80.22
FPR (%) 4.489 3.13 3.002 2.44 3.98 15.98 14.14 13.54 3.096 2.738
F-measure (%) 81.51 79.58 85.61 81.55 81.88 83.55 81.71 82.48 85.53 87.68
200
CorrectK 16 18 18 19 22 21 20 19 20 18
DR (%) 64.24 71.11 77.11 74.343 72.119 73.34 72.95 74.35 81.66 80.22 FPR (%) 2.738 3.002 1.376 2.739 9.98 12.436 12.15 13.14 14.096 1.314 F-measure (%) 76.81 81.67 88.71 83.95 79.16 78.9 78.76 80.32 83.37 88.38
250
CorrectK 16 17 15 19 19 16 21 18 18 15
DR (%) 64.24 70.34 77.11 71.01 82.119 72.245 75.95 79.45 72.66 80.22
FPR (%) 2.738 2.013 3.91 4.11 15.95 5.86 1.16 3.12 3.101 2.738
F-measure (%) 76.81 81.61 85.18 81.08 82.85 81.1 85.74 86.83 82.66 87.7
300
CorrectK 21 20 14 20 21 18 18 19 17 14
DR (%) 74.82 88.27 99 88.132 81.44 89.911 90.106 88.34 94.109 100 FPR (%) 10.314 9.12 17.352 9.19 11.209 17.33 24.51 26.93 16.91 9.117 F-measure (%) 80.74 89.36 91.44 89.28 84.5 86.59 83.86 81.14 88.71 95.64
350
CorrectK 21 25 26 22 23 23 26 25 20 26
DR (%) 77.22 90.122 99 88.668 88.44 95.22 92.20 93.67 97.109 100 FPR (%) 12.38 16.981 9.676 10.254 9.209 9.164 12.12 11.39 7.454 6.809 F-measure (%) 81.4 86.96 94.84 89.1 89.45 93.13 90.19 90.83 94.91 96.71
400
CorrectK 16 21 25 19 21 28 28 26 27 27
DR (%) 77.22 90.122 99 92.55 95.29 94.005 96.20 94.23 97.077 100 FPR (%) 12.38 16.981 17.998 10.45 6.45 15.45 13.12 14.67 14.968 1.847 F-measure (%) 81.37 86.95 90.89 91.21 94.64 89.82 91.92 88.45 91.76 98.99
500
CorrectK 23 24 21 22 25 31 33 33 27 21
DR (%) 77.22 90.122 99 96.68 94.29 96.005 96.78 96.15 96.807 100 FPR (%) 12.738 7.672 19.368 8.018 16.45 17.45 17.94 17.63 12.216 12.379 F-measure (%) 81.25 91.09 90.59 94.43 89.42 89.88 90.01 90.03 92.54 94.17
A. If it gets assigned to classBby the proposed classifi-cation method in the second phase, classBis an incor-rect class/category for data objectd. Hereby, the formed cluster belongings to classBis assumed to be an abnor-mal cluster for the data objectd. In contrast, if data ob-jectdis closer to a cluster labeled class A(we called it normal cluster), the outlier distance should be
Figure 3: The sample solution area (fuzzy inference) of proposed fuzzy detection system
3. It can be seen in the table that our proposed fuzzy method tends to obtain a more accurate classification rate (Ave.) and lower standard deviation (S.D.) as com-pared to other methods.
9.3. Feature Construction
We employed simple features that can be extracted by inspecting the headers of the network packets. These intrinsic features are the duration of the connection, source host, destination host, source interface, and des-tination interface [65]. We also used the following fea-tures in each 2 seconds time interval:
1 Total number of packetssent from and to the given interface in the considered time interval,
2 Total number of bytessent from and to the given interface in the considered time interval, and 3 Number of different source-destination pairs
matching the given hostname-interface that being observed in the considered time interval.
The motivation of the first two features is that the num-ber of packets and bytes allow to detect anomalies in traffic volume, and the third feature allows to detect network and interface scans as well as distributed at-tacks, which both result in increased number of source-destination pairs [66].
9.4. Training Phase
Since there is no reference data for content-centric networks as well as real Internet traffic, we used the
Table 5: CCNx Traffic Generation
Type of traffic Applied tools Normal
(5240 records)
(1)ccnsendchunkswithccncatchunks2 (2)ccnputfilewithccngetfile (3)ccnchat
Attack (530 records)
(1)ccndsmoketestfor (distributed)Interest flood-ingattack
(2) make abnormal traffics to saturate channels by sending very small contents (decreasing buffer size) from owner of origin, called Abnormal Source Behavior
(3) do not forward contents deliberately to re-quester(s), calledAbnormal Unreachable Content Behavior
Table 6: Rules Matrix
Outlier Classification (Cls.) Very
close
Close Average Far Very far
Close Normal Normal Normal Low prone
Low prone Average Low
prone Low prone
High prone
High prone
High prone
Far High
prone High prone
Abnormal Abnormal Abnormal
repository), ccncatchunks2 (to receive desired contents and to write them to stdout), ccnputfile (to publish a lo-cal file in the CCNx repository), ccngetfile (to retrieve published content and writes it to the local file), ccndsmoketest (to send the large number of Interests -Interest flooding attacks- toward a host/network), and ccnchat (to run a chat channel). We conducted three attack instances for both training and detection phases including Interest flooding attacks, flooding a victim router by sending too many small contents from owner of origin content (we called itAbnormal Source Behav-ior) and making content unreachable for requesters (we called itAbnormal Unreachable Content Behavior). We also carried out an anomaly instance in the detection phase as serving fake response (we called itAbnormal Forwarder Capacity Behavior) which does not appear in the training data set. The structure of the generated traffics are shown in Table 5 for training and Tables 8 and 9 for testing data sets.
[image:12.595.308.541.283.391.2]For the PSO algorithm, we used swarm size of 25 parti-cles, the number of iterations set to 1000, and other pa-rameters set according to subsection 8.1. The proposed hybrid method was implemented by the MATLAB soft-ware on an Intel Pentium 2.13 GHz CPU, 4 GB RAM running Windows 7 Ultimate.
Table 7: Some fuzzy rules in proposed fuzzy system
IFCls.=AverageandOutlier=CloseTHENAlarm=Normal IFCls.=CloseandOutlier=AverageTHENAlarm=LowProne IFCls.=HighandOutlier=AverageTHENAlarm=HighProne IFCls.=Very farandOutlier=FarTHENAlarm=Abnormal
9.5. Detection Phase
We use MATLAB fuzzy logic toolbox for fuzzy rule based intrusion detection. The detection phase is struc-tured with the following components:
1 Two fuzzy set of input variables: Classification and Outlier;
classification membership:Very Close, Close, Av-erage, Far, Very Far; outlier membership: Close, Average, Far.
2 A fuzzy set of output variable: Alarm; alarm mem-bership:Normal, Less Prone, High Prone, Abnor-mal.
3 Fuzzy membership functions: see section 9.7. 4 Fuzzy rules: 15 rules (Tables 6 and 7).
5 Inference: Mamdani fuzzy inference by fuzzy set operations asmax andmin forOR andAND, re-spectively.
6 Defuzzifier: Center of Gravity algorithm:
Center o f Gravity=
Rmax
min uµ(u)d(u) Rmax
min µ(u)d(u)
(18)
Where,udenotes the output variable,µis the mem-bership function after accumulation, andmin and
maxare lower and upper limit for defuzzification, respectively.
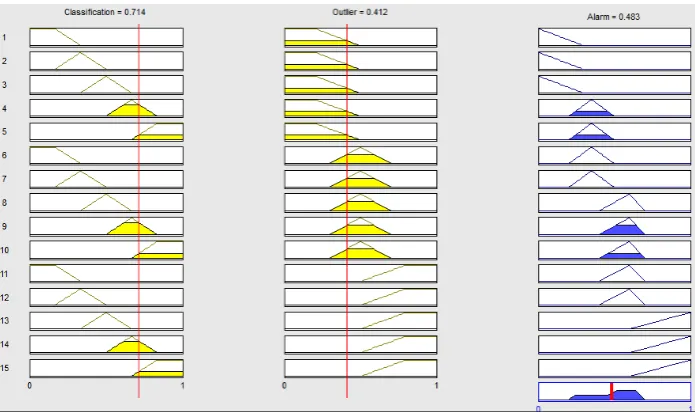
A sample solution area (fuzzy inference) of proposed fuzzy detection phase is given in Fig. 3.
Table 8: First scenario of CCNx traffic
Type of traffic Applied tools Normal
(2110 records)
(1)HttpProxyapplication to run a HTTP proxy that converts HTTP Gets to CCN data.
(2)ccnputfilewithccngetfile (3)ccnchat
Attack (866 records)
(1)ccndsmoketestforInterest floodingattack (2)Abnormal Source Behavior
(3) make capacity limitation in count of content objects by forwarder/router to discard cached con-tent objects deliberately asAbnormal Forwarder Capacity Behavior
Table 9: Second scenario of CCNx traffic
Type of traffic Applied tools Normal
(1545 records)
(1)ccnsendchunkswithccncatchunks2 (2)ccnputfilewithccngetfile (3)HttpProxyapplication Attack
(492 records)
(1)Abnormal Source Behavior
(2)Abnormal Unreachable Content Behavior (3)Abnormal Forwarder Capacity Behavior
9.6. Results of Training Phase
[image:12.595.307.539.433.505.2]Figure 4: 1st cost function (DBI) in 1000 iterations
Figure 5: 2nd cost function (MSE) in 1000 iterations
[image:13.595.73.279.343.514.2]According to the Table 4, by increasing of initial pa-rameter K, results are more efficient with the optimal number of clusters, high detection rate, low false posi-tive rate and greater F-measure at the same time. The results clearly show that our proposed method offers the best optimized solution in comparison with the other methods when K=400 by DR=100%, FPR=1.847%, F-measure=98.99% and the correct number of K=27. We show the fluctuation of variations of two cost functions during the training phase in Figs. 4 and 5. The results clearly show that by changing of clus-tering values based on DBI, MSE changes in a irregular manner through the different iterations. For instance, in the last iteration, the minimum MSE is 8.391, but the
Figure 6: The best cost (DBI) of four clustering results
Figure 7: The MSE value of four clustering results
[image:13.595.320.525.344.510.2]500. These results verify that the MSE parameter cannot be singly used as a good performance criterion for find-ing the optimal placement of clusters centroids and data objects. We send the optimal outcomes from our pro-posed method (DR=100%, FPR=1.847%, F-measure =89.99% and K=27) and the best combination of the DR, the FPR and the F-measure from other methods to the second phase for fuzzy anomaly detection.
9.7. Results of Detection Phase
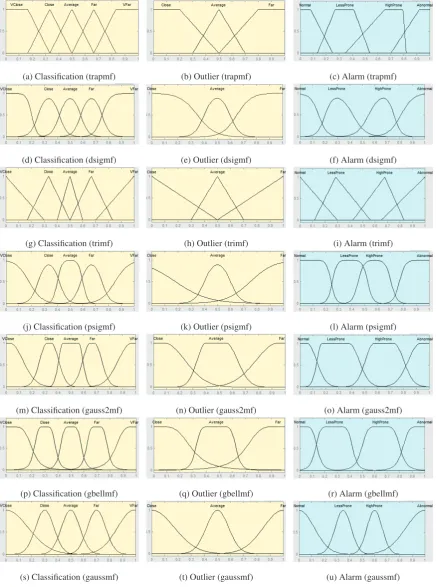
In order to obtain results on how the proposed fuzzy anomaly detection system can perform in real scenar-ios, we applied it to packet traces recorded at two sce-narios with 17 Linux machines (10 clients, 4 servers, and 3 routers). These traces are from CCNx data repos-itory of the University of Politecnica Catalunya (UPC) which are shown in Tables 8 and 9. Each trace file con-tains about 20 minutes of monitored traffic. Accord-ing to Tables 8 and 9, there is a new type of normal traffic (HttpProxy) and a new type of anomaly traffic (Abnormal Forwarder Capacity Behavior) which have not appeared in the training data set. We also define a threshold as dthreshold=0.5. Each new monitored CCN packet is sent as input to the fuzzy detection phase in order to detect attacks and anomalies. According to the proposed fuzzy anomaly detection system (section 8.2), we calculate the classification distance to find the nearest cluster. If the distance is closer to one of the normal clusters, we calculate the outlier. If the out-lier outcome is bigger than a predefined threshold, the packet is treated as an anomaly. In contrast, if the clas-sification distance is closer to one of the attack clus-ters, it gets treated as an attack packet. Based on the different fuzzy membership functions, the fuzzy detec-tion method produces different results. To find the most ideal system, we apply seven membership functions for each applied methods including trapmf (Trapezoidal-shaped), dsigmf (Difference between two sigmoidal functions), trimf (Triangular-shaped), psigmf (Product of two sigmoidal), gauss2mf (Gaussian combination), gbellmf (Generalized bell-shaped), and gaussmf (Gaus-sian curve). Fig. 8 illustrates the applied membership functions. We integrated each method by optimal results gained from the training phase (Table 4) with our pro-posed fuzzy detection method in the second phase. Af-terwards, we compare the performance of each method based on the RMSE, minimum and maximum error be-tween target output and predicted output. The compar-ison results between methods in two applied data sets (Tables 8 and 9) are summarized in Table 10. We found out that the RMSE between target and predicted output is absolutely different. We marked the three best results
for each membership function. The most appropriate re-sults based on the RMSE, minimum and maximum er-ror include our proposed method (PSO-Kmeans (DBI, MSE)), PSO (DBI, MSE), methods [36] and [40], re-spectively. By the integration of DBI (well-separated cost) and MSE (local optimization cost), PSO could considerably improve the results in detection phase. As shown, our proposed method is very well suited for most of the membership functions based on the less RMSE, minimum and maximum error values. Perfor-mance of trapmf and gauss2mf MF in our proposed method are better than other MF and applied methods. For anomaly detection performance measurement, we continue our experiment by applying well-performing and preexisting methods from Table 10 on the afore-mentioned data sets. The performance of fuzzy detec-tion approach is also compared with the non-fuzzy ap-proach. In order to validate the CCNx traffic classifi-cation performance of our fuzzy detector, we use the Receiver Operating Characteristic (ROC) curve analy-sis, Area Under the Curve (AUC), accuracy, specificity and sensitivity (recall). The ROC curve provides a way to visually represent how the trade-off between false positive and detection rate varies for different values of the detection threshold [67]. The AUC summarizes the classification performance of the classifier in the range [0 1] in which the higher the AUC, the easier to distin-guish attacks from normal traffic [68]. The other applied performance measures can be summarized as a 2×2 ta-ble (confusion matrix in tata-ble 11):
1. Accuracy: (a+d)/(a+b+c+d) 2. Specificity (true negative rate):a/(a+b) 3. Sensitivity (recall):d/(c+d)
Table 11: The 2×2 contingency table (confusion ma-trix)
True label Predicted label Negative Positive
Negative a b
Positive c d
(a) Classification (trapmf) (b) Outlier (trapmf) (c) Alarm (trapmf)
(d) Classification (dsigmf) (e) Outlier (dsigmf) (f) Alarm (dsigmf)
(g) Classification (trimf) (h) Outlier (trimf) (i) Alarm (trimf)
(j) Classification (psigmf) (k) Outlier (psigmf) (l) Alarm (psigmf)
(m) Classification (gauss2mf) (n) Outlier (gauss2mf) (o) Alarm (gauss2mf)
(p) Classification (gbellmf) (q) Outlier (gbellmf) (r) Alarm (gbellmf)
[image:15.595.81.518.111.699.2](s) Classification (gaussmf) (t) Outlier (gaussmf) (u) Alarm (gaussmf)
Figure 8: Seven applied membership functions in detection phase (two inputs and one output)
Table 10: Comparison of membership functions for fuzzy anomaly detection purposes
Methods Data set Criteria trapmf dsigmf trimf psigmf gauss2mf gbellmf gaussmf
K-means
Table 8
RMSE 0.1037 0.2397 0.2713 0.2268 0.3039 0.1943 0.1949 Min error -0.253 -0.2992 -0.2216 -0.9755 -1.5892 -1.058 -0.4240 Max error 0.8934 0.8635 0.995 0.9334 1.0023 0.9683 0.9875
Table 9
RMSE 0.0663 0.1596 0.1211 0.1238 0.2202 0.2703 0.2009 Min error -0.8817 -0.2088 -0.432 -0.3606 -1.1779 -0.4503 -0.6663 Max error 0.9994 0.935 0.6265 0.3563 0.9966 0.9880 1.008
PSO (MSE)
Table 8
RMSE 0.0759 0.092 0.103 0.1162 0.0953 0.1046 0.0865 Min error -0.2625 -0.7765 -0.3011 -0.727 -0.6035 -0.6303 -0.6541 Max error 0.4862 0.7926 0.4364 0.9918 0.3987 0.8653 0.8337
Table 9
RMSE 0.1295 0.1592 0.2129 0.2604 0.1665 0.1785 0.1728 Min error -0.9444 -0.2385 -0.2004 -1.0268 -0.3541 -1.2154 -0.4445 Max error 0.8943 0.8267 1.0337 0.9501 0.8683 0.4131 0.9616
PSO (DBI, MSE)
Table 8
RMSE 0.6525 0.1817 0.1541 0.1432 0.2024 0.0723 0.1587 Min error -0.7457 -0.276 -0.6548 -0.4627 -0.2643 -0.584 -0.9233 Max error 0.937 0.8859 0.4301 0.9398 0.9489 0.5771 0.8303
Table 9
RMSE 0.0524 0.0892 0.1251 0.1225 0.0669 0.25 0.0925
Min error -0.5833 -0.5382 -0.7248 -0.2865 -0.6324 -0.9254 -0.4052 Max error 0.6592 0.8299 0.9487 0.7618 0.5671 0.9618 0.8465
PSO-Kmeans (MSE)
Table 8
RMSE 0.1096 0.1381 0.2582 0.2608 0.3255 0.1737 0.1931 Min error -0.5418 -0.2839 -0.3055 -1.173 -1.0158 -0.1510 0.8461 Max error 0.854 0.9903 1.1168 0.915 0.9992 0.9425 0.8425
Table 9
RMSE 0.2002 0.1597 0.0979 0.1466 0.2331 0.2647 0.168 Min error -1.1255 -1.1157 -0.5717 -1.3077 -1.005 -0.198 -0.4575 Max error 0.9525 0.6084 0.5921 0.1089 0.998 1.043 0.9459
Method [36]
Table 8
RMSE 0.0927 0.1093 0.0722 0.1135 0.0935 0.0763 0.0581 Min error -0.3177 -0.5658 -0.3461 -0.5126 -0.092 -0.6623 -0.6063 Max error 0.4688 0.8788 0.8808 0.8765 1.003 0.5867 0.6139
Table 9
RMSE 0.1156 0.3435 0.1826 0.2317 0.2817 0.23 0.2393 Min error -0.5278 -0.6531 -0.8078 -0.982 -0.9648 -0.1718 -0.565 Max error 0.8821 0.9217 0.7279 0.825 1.0119 0.9886 1.032
Method [37]
Table 8
RMSE 0.1507 0.2584 0.1868 0.2916 0.2523 0.1115 0.2968 Min error -0.4221 -0.6492 -0.8722 -0.3394 -1.074 -0.4625 -1.038 Max error 0.9439 0.7947 0.78 0.836 1.008 0.3892 0.9654
Table 9
RMSE 0.1919 0.2442 0.0971 0.1749 0.1374 0.1288 0.1163 Min error -0.2277 -0.6492 -0.3084 -0.5541 -0.6253 -0.7965 -0.3109 Max error 1.0243 0.8691 0.8129 0.8973 0.9699 0.9148 0.8623
Method [38]
Table 8
RMSE 0.0917 0.1971 0.2805 0.2059 0.2891 0.1737 0.1568 Min error -0.5883 -0.494 -0.9252 -0.7737 -0.8936 -0.9185 -0.6149 Max error 0.7866 0.9858 0.9913 1.4086 1.479 1.007 0.6044
Table 9
RMSE 0.1749 0.13 0.2525 0.1282 0.2481 0.209 0.1788 Min error -0.5433 -0.5966 -0.6027 -0.3625 -0.9461 -1.139 -0.902 Max error 0.9719 0.4311 0.7168 1.0516 1.085 1.005 0.391
Method [39]
Table 8
RMSE 0.0921 0.201 0.2612 0.2112 0.2761 0.1872 0.1691 Min error -0.593 -0.5143 -0.8982 -0.8754 -0.9012 -0.9218 -0.6241 Max error 0.7957 0.9936 0.9984 1.4148 1.502 1.019 0.6502
Table 9
RMSE 0.1791 0.1256 0.2485 0.1432 0.2516 0.215 0.1889 Min error -0.5553 -0.6041 -0.6081 -0.3702 -0.9333 -1.114 -0.924 Max error 0.9784 0.4394 0.7221 1.0464 1.094 1.055 0.403
Method [40]
Table 8
RMSE 0.1442 0.0948 0.1206 0.0811 0.0961 0.0848 0.1106 Min error -0.3528 -0.5687 -0.6512 -0.5823 -0.209 -0.5186 -0.3415 Max error 1.0159 0.872 0.556 0.7106 0.8354 0.8223 0.8651
Table 9
RMSE 0.2885 0.1871 0.2245 0.2043 0.1849 0.1968 0.3799 Min error -1.391 -1.005 -0.8121 -1.1521 -0.803 -0.2025 -1.3634 Max error 1.0382 0.805 1.0565 0.4807 0.9676 0.9299 0.8228
Our Method
Table 8
RMSE 0.0617 0.2525 0.1191 0.0653 0.0664 0.1176 0.3219
Min error -0.4157 -1.0143 -1.0819 -0.5434 -0.581 -0.3657 -1.0182 Max error 0.6002 0.9994 0.6676 0.5124 0.4562 0.8798 1.003
Table 9
RMSE 0.0531 0.0738 0.0691 0.2165 0.0657 0.1491 0.0519
Figure 9: ROC curves corresponding to the proposed method and other applied methods for 1st scenario (fuzzy approach)
Figure 10: ROC curves corresponding to the proposed method and other applied methods for 1st scenario (non-fuzzy approach)
positives. Table 12 shows the results of fuzzy and non-fuzzy (crisp) anomaly detection for two applied testing data sets. As shown in this table, our proposed method classifies data objects better than the other approaches based on AUC, accuracy, sensitivity and specificity. In addition, the non-fuzzy anomaly detection approach is often not sufficient in detecting many types of attacks as compared to a fuzzy detection method.
9.8. Computational Order
The computational order of standard PSO algorithm isO(I·S·Cost), whereIis the required generation num-ber,S is the population size, andCostis the cost func-tion. The computational complexity of evaluating the cost function depends on the particular cost function un-der consiun-deration. The applied cost functions in
preex-Figure 11: ROC curves corresponding to the proposed method and other applied methods for 2nd scenario (fuzzy approach)
Figure 12: ROC curves corresponding to the proposed method and other applied methods for 2nd scenario (non-fuzzy approach)
isting methods ([36, 37, 38, 39, 40]) areO(N·K), where
N is the number of data samples andKis the number of clusters. The computational order of K-means algo-rithm isO(T·N·K), whereTis the number of iterations. The computational order of proposed training method and preexisting methods from the literature are shown in Table 13.
9.8.1. Time Complexity
[image:17.595.73.281.329.472.2] [image:17.595.316.526.330.470.2]Table 12: fuzzy (non-fuzzy) anomaly detection for two applied testing data sets
Method AUC Accuracy Sensitivity (recall) Specificity
mean S.D. mean S.D. mean S.D.
Data set 1:Table 8
Our Method 97.44 94.48 0.97 96.88 1.54 95.52 0.79 (93.26) (89.07) (2.35) (90.15) (1.41) (93.51) (1.02) PSO (DBI, MSE) 95.36 91.38 1.34 91.02 2.45 94.18 1.51
(91.41) (87.3) (2.48) (89.15) (2.03) (91.12) (1.29)
Method [40] 92.39 89.61 2.73 89.2 2.83 91.4 1.28
(89.87) (81.74) (3.9) (82.76) (2.97) (88.4) (1.37) Method [36] 91.92 88.18 2.84 88.21 2.89 90.98 1.94
(87.37) (81.64) (3.71) (83.33) (3.7) (87.73) (1.17) Method [37] 91.37 89.29 2.98 87.07 3.04 90.11 2.08
(87.14) (81.18) (3.88) (82.13) (3.57) (87.61) (2.21) Method [38] 90.87 88.63 3.02 87.1 3.12 90.01 2.18
(86.78) (80.51) (3.76) (82.21) (3.85) (87.15) (2.4) Method [39] 89.4 87.74 3.01 86.63 3.31 89.41 2.15 (86.12) (80.2) (3.58) (81.68) (3.72) (87.05) (2.31)
Data set 2:Table 9
Our Method 97.41 94.45 0.99 97.65 0.67 96.7 0.99
(92.29) (88.14) (2.84) (89.15) (2.03) (91.57) (1.36) PSO (DBI, MSE) 95.91 92.01 1.01 93.81 1.43 94.93 1.8
(90.98) (86.8) (2.68) (88.18) (3.96) (90.3) (1.39) Method [40] 92.92 89.84 2.83 88.49 2.19 91.58 1.74
(88.64) (81.06) (3.49) (82.3) (3.19) (86.32) (1.83) Method [36] 92.18 89.14 2.78 87.3 0.75 90.43 1.14
(86.67) (80.19) (3.9) (81.82) (3.09) (85.55) (1.98)
Method [37] 91.71 87.11 2.74 87.21 0.8 90.1 1.22
(86.11) (80.1) (3.99) (81.9) (3.18) (85.33) (2.05) Method [38] 91.47 86.98 2.86 87.17 0.91 90.02 1.34
(85.61) (80.06) (3.92) (81.76) (3.41) (85.3) (2.03) Method [39] 90.08 85.49 3.03 86.66 1.03 89.43 1.53
[image:18.595.151.444.475.547.2](85.86) (80.01) (3.99) (80.54) (3.68) (85.11) (2.61)
Table 13: The computational order of the six methods
Methods Cost function Algorithm
Our Method O(MS E)+O(DBI)=O(N·K)+O(K2) O(PS O)+O(K−means) Method [40] O(MS E)=O(N·K) O(PS O)×O(K−means) Method [36] O(MS E)=O(N·K) O(PS O)×O(K−means) Method [37] O(MS E)=O(N·K) O(PS O)×O(K−means) Method [38] O(MS E)=O(N·K) O(PS O)+O(K−means) Method [39] O(MS E)=O(N·K) O(PS O)+O(K−means)
of a single cost function. But the proposed method can find the better solution with less times of increment on computational time than the other five methods due to its fast convergence speed. The results show that the proposed method with the new strategy of cost func-tion -applicafunc-tion of two simultaneous cost funcfunc-tions- functions-can yield high accuracy as compared to other methods without very much computational cost.
9.9. Discussion
In this paper, a fuzzy anomaly detection system has been proposed for content-centric networks. This sys-tem applies a new hybrid approach with PSO and K-means in two phases: training and detection (Fig. 2). In
Table 14: The computational time of the six methods
Methods Computational time (sec)
Increment time (sec) Our Method 791.412 92.381 Method [40] 1348.297 478.146 Method [36] 1203.459 401.678 Method [37] 1301.763 424.829 Method [38] 711.359 207.412 Method [39] 723.286 289.764
[image:18.595.325.514.586.663.2]algorithm utilizes the iteratively global search ability of PSO to find optimal or near optimal cluster cen-troids and local search ability of K-means to avoid be-ing trapped in a local optimal solution. A new boundary handling approach is also utilized in the PSO to not only select linearly the best set of parameters but fulfill also exploration and exploitation issues. When the optimal placement of clusters centroids and objects are defined, they are sent to the second phase. In the detection phase, we employ a fuzzy approach by the combination of two distance-based methods as classification and outlier to detect anomalies in new monitoring data.
Convergence of the proposed fuzzy anomaly detection system is studied for finding the global and optimal re-sults and measuring the suitable performance over dif-ferent CCN traffic flows (Table 4 from training phase and Tables 10 and 12 from detection phase). Experi-mental results show that the applied CCN traffic flows could be used well for both training and detection phase as well as preexisting methods from the literature. Convergence of the proposed method is also studied for finding global classification of different benchmarking data sets as Iris, Glass, Wine, Ionosphere and Zoo. Ex-perimental results (Table 3) show the accuracy and the robustness of our proposed method based on the average of correct classification and lower standard deviation as compared to other methods.
The feasibility and efficiency of proposed system in training phase compared to nine different approaches. Table 4 depicts the final results using K-means, PSO (MSE), PSO (DBI, MSE), PSO-Kmeans (MSE), meth-ods [36], [37], [38], [39], [40], and our proposed method as PSO-Kmeans (DBI, MSE). The proposed training phase outperforms other methods based on the opti-mal results as DR = 100%, FPR = 1.847% and F-measure=98.99 %. In the training phase, future work is needed in the application of multi-objective optimiza-tion techniques. Moreover, detecoptimiza-tion phase results are very capable for anomaly detection purposes. The vari-ous membership functions are employed to demonstrate the effectiveness of our proposed method among applied well-performing methods in Table 10. In the most cases, the proposed anomaly detection method performed bet-ter than other methods based on the RMSE, minimum and maximum error between target and predicted output at the same time. Specifically, optimal results gained by trapmf and gauss2mf MF. In the detection phase, future work is needed in the application of non-linear member-ship functions.
Our proposed method and the other methods use dif-ferent parameter settings and were repeated 10 times independently to find the global results in the training
phase; therefore, the effect of tuning parameters on per-formance of the methods are studied.
We continue our anomaly detection performance mea-surements by applying well-performing and preexisting methods (from Table 10) and our proposed method over two applied data sets (Tables 8 and 9). As shown in Figs. 9-12 and Table 12, the proposed fuzzy and non-fuzzy anomaly detection phase can outperform other meth-ods. In addition, the times of increment on computa-tional time of proposed method is relative smaller than the other considered methods (Table 14).
10. Conclusion
In this paper, we proposed a novel fuzzy anomaly de-tection system based on the hybridization of PSO and K-means clustering algorithms over Content-Centric Networks (CCNs). This system consists of two phases: the training phase with two simultaneous cost func-tions as well-separated clusters by DBI and local op-timization by MSE, and the detection phase with two combination-based distance approaches as classifica-tion and outlier. Experimental results and analysis show the proposed method in the training phase is very ef-fective in determining the optimal number of clusters, and has a very high detection rate and a very low false positive rate at the same time. In the detection phase, the proposed method clearly outperforms other applied method in terms of AUC (area under the ROC curve), accuracy, sensitivity and specificity. In addition, the times of increment on computational time of proposed method is relative smaller than the other considered methods.
We are currently working on several improvements of the presented approach with the application of com-putational intelligence methodologies (such as multi-objective optimization techniques) to propose a robust method to improve the accuracy of detection rate and reduce false positive rate over different CCNs traffics.
Acknowledgment
This work was supported by the Spanish govern-ment and Generalitat de Catalunya through projects TIN2010-21378-C02-01 and 2009-SGR-1167, respec-tively, and by the European Commission through the NoE EuroNF.
References
(draft). In: Information-Centric Networking; Dagstuhl Semi-nar Proceedings. Schloss Dagstuhl - Leibniz-Zentrum fuer In-formatik, Germany; 2011, .
2. Jacobson, V., Smetters, D.K., Thornton, J.D., Plass, M.F., Briggs, N.H., Braynard, R.L.. Networking named content. In: Proceedings of the 5th international conference on Emerging networking experiments and technologies; CoNEXT ’09. New York, NY, USA: ACM; 2009, .
3. Ohlman, B., Ahlgren, B., Brunner, M., D ´Ambrosio, M., Dan-newitz, C., Eriksson, A., et al. First netinf architecture descrip-tion. FP7-ICT-2007-1-216041-4WARD/D-6.1. 2009, . 4. Hovaidi Ardestani, M., Karami, A., Sarolahti, P., Ott, J..
Congestion control in content-centric networking using neural network. In:CCNxCon 2013. PARC, a Xerox company; 2013, . 5. Zhang, L., Estrin, D., Burke, J., Jacobson, V., Thornton, J.D., Smetters, D.K., et al. Named data networking (ndn) project. In: Proceedings of the ACM SIGCOMM workshop on Information-centric networking; PARC TR-2010-3. 2010, p. 68–73. 6. Louvieris, P., Clewley, N., Liu, X.. Effects-based feature
identification for network intrusion detection. Neurocomputing 2013;121:265–273.
7. Gasti, P., Tsudik, G., Uzun, E., Zhang, L.. Dos and ddos in named-data networking.CoRR2012;abs/1208.0952.
8. Liao, H.J., Lin, C.H.R., Lin, Y.C., Tung, K.Y.. Intrusion detection system: A comprehensive review.Journal of Network and Computer Applications2013;36(1):16–24.
9. Kolias, C., Kambourakis, G., Maragoudakis, M.. Swarm in-telligence in intrusion detection: A survey. Computers and Se-curity2011;30(8):625–642.
10. Peddabachigari, S., Abraham, A., Grosan, C., Thomas, J.. Modeling intrusion detection system using hybrid intelligent systems.Journal of Network and Computer Applications2007; 30(1):114–132.
11. A.Patcha, , J.-M.Park, . An overview of anomaly detection tech-niques: existing solutions and latest technological trends. Com-puter Networks2007;51(12):3448–3470.
12. Palmieri, F., Fiore, U.. Network anomaly detection through nonlinear analysis.computers&security2010;29:737–755. 13. Perdisci, R., Ariu, D., Fogla, P., Giacinto, G., Lee, W..
Mcpad: A multiple classifier system for accurate payload-based anomaly detection.Computer Networks2009;53:864–881. 14. Faysel, M.A., Haque, S.S.. Towards cyber defense: research in
intrusion detection and intrusion prevention systems. Interna-tional Journal of Computer Science and Network Security (IJC-SNS)2010;10(7):316–325.
15. Krawczyk, B., Wo´zniak, M.. Diversity measures for one-class classifier ensembles.Neurocomputing2014;126:36–44. 16. Fiore, U., Palmieri, F., Castiglione, A., Santis, A.D..
Net-work anomaly detection with the restricted boltzmann machine. Neurocomputing2013;122(25):13–23.
17. Chandola, V., Banerjee, A., Kumar, V.. Anomaly detection: a survey.ACM Computer Survey2009;41(3):15:115:58. 18. Corral, G., Armengol, E., Fornells, A., Golobardes, E..
Ex-planations of unsupervised learning clustering applied to data security analysis.Neurocomputing2009;72(13-15):2754–2762. 19. Wang, Q., Megalooikonomou, V.. A performance evaluation framework for association mining in spatial data.Intelligent In-formation Systems2010;35(3):465–494.
20. Jain, A.K., Murty, M.N., Flynn, P.J.. Data clustering: A review.ACM Computing Surveys1999;31(3):264–323. 21. Karami, A., Johansson, R.. Choosing dbscan parameters
auto-matically using differential evolution. International Journal of Computer Applications2014;91(7):1–11. Published by Founda-tion of Computer Science, New York, USA.
22. Kao, Y.T., Zahara, E., Kao, I.W.. A hybridized approach
to data clustering. Expert Systems with Applications 2008; 34(3):1754–1762.
23. Laszlo, M., Mukherjee, S.. A genetic algorithm that exchanges neighboring centers for k-means clustering.Pattern Recognition Letters2007;28(16):2359–2366.
24. Zalik, K.R.. An efficient k-means clustering algorithm.Pattern Recognition Letters2008;29:1385–1391.
25. Chen, C.Y., Ye, F.. Particle swarm optimization algorithm and its application to clustering analysis. In: Proceedings of the IEEE International Conference on Networking, Sensing and Control. 2004, p. 789–794.
26. Selim, S.Z., Ismail, M.A.. K-means-type algorithms: A gen-eralized convergence theorem and characterization of local op-timality. IEEE Transactions on Pattern Analysis and Machine Intelligence1984;6(1):81–87.
27. Karami, A.. Data clustering for anomaly detection in content-centric networks. International Journal of Computer Applica-tions2013;81(7):1–8. Published by Foundation of Computer Science, New York, USA.
28. Naldi, M., Campello, R.. Evolutionary k-means for distributed data sets.Neurocomputing2014;127:30–42.
29. Anderberg, M.R..Cluster Analysis for Applications. Academic Press, Inc., New York, NY; 1973.
30. Quan, H., Srinivasan, D., Khosravi, A.. Particle swarm op-timization for construction of neural network-based prediction intervals.Neurocomputing2014;127:172–180.
31. Carlisle, A., Dozier, G.. An off-the-shelf pso. In:Proceedings of the Particle Swarm Optimization Workshop. 2001, p. 16. 32. Kennedy, J., Eberhart, R.C.. Swarm Intelligence. Morgan
Kaufmann, San Francisco, CA; 2001.
33. Everitt, B.S.. Cluster Analysis. 3rd edition, London, Edward Arnold/Halsted Press; 1993.
34. Kaufman, L., Rousseeuw, P.J.. Finding Groups in Data: An Introduction to Cluster Analysis. New York: John Wiley Sons; 1990.
35. K¨arkk¨ainen, I., Fr¨anti, P.. Minimization of the value of davies-bouldin index. In: Proceedings of the LASTED International Conference signal proccessing and communications. Marbella, Spain; 2000, p. 426–432.
36. Chen, J.. Hybrid clustering algorithm based on pso with the multidimensional asynchronism and stochastic disturbance method.Journal of Theoretical and Applied Information Tech-nology2012;46(1):434–440.
37. Zhenkui, P., Xia, H., Jinfeng, H.. The clustering algorithm based on particle swarm optimization algorithm. In: Proceed-ings of the International Conference on Intelligent Computa-tion Technology and AutomaComputa-tion; ICICTA ’08. Washington, DC, USA: IEEE Computer Society; 2008, p. 148–151.
38. Cui, X., Potok, T.E.. Document clustering analysis based on hybrid pso+k-means algorithm.Journal of Computer Sciences 2005;:27–33.
39. Merwe, D.W.V.D., Engelbrecht, A.P.. Data clustering us-ing particle swarm optimization. In: Proceedings of the IEEE Congress on Evolutionary Computation (CEC). Canberra, Aus-tralia; 2003, p. 215–220.
40. Xiao, L., Shao, Z., Liu, G.. K-means algorithm based on parti-cle swarm optimization algorithm for anomaly intrusion detec-tion. In:Proceedings of the 6th World Congress on Intelligent Control and Automation. Dalian, China; 2006, p. 5854–5858. 41. Conti, M., Gasti, P., Teoli, M.. A lightweight mechanism for
detection of cache pollution attacks in named data networking. Computer Networks2013;57(16):3178–3191.
Information-Centric Networking. Dagstuhl, Germany; 2010, . 43. Xie, M., Widjaja, I., Wang, H.. Enhancing cache robustness
for content-centric networking. In:INFOCOM. 2012, p. 2426– 2434.
44. Widjaja, I.. Towards a flexible resource management system for content centric networking. In:Proceedings of IEEE ICC’12 Next Generation Network Symposium. 2012, .
45. Zhang, L., Estrin, D., Burke, J., Jacobson, V., Thornton, J.D., Smetters, D.K., et al. Named data networking (ndn) project. In: Proceedings of the ACM SIGCOMM workshop on Information-centric networking, number PARC TR-2010-3. 2010, p. 68–73. 46. Lauinger, T.. Security & scalability of content-centric
network-ing. Sept. 2010.
47. Compagno, A., Conti, M., Gasti, P., Tsudik, G.. Poseidon: Mitigating interest flooding ddos attacks in named data network-ing.CoRR2013;abs/1303.4823.
48. Wong, W., Nikander, P.. Secure naming in information-centric networks. In: Proceedings of the Re-Architecting the Internet Workshop, (ReARCH’10). 2010, p. 1–12.
49. Kennedy, J., Eberhart, R.. Particle swarm optimization. In:Proceedings in IEEE International Conference Neural Net-works; vol. 4. 1995, p. 1942–1948.
50. Li, N.J., Wang, W.J., Hsu, C.C.J., Chang, W., Chou, H.G., Chang, J.W.. Enhanced particle swarm optimizer incorporating a weighted particle.Neurocomputing2014;124:218–227. 51. Settles, M.. An Introduction to Particle Swarm
Optimiza-tion. Department of Computer Science, University of Idaho, Moscow; 2005.
52. Shi, Y., Eberhart, R.. A modified particle swarm optimizer. In: IEEE World Congress on Computational Intelligence. 1998, p. 69–73.
53. Eberhart, R.C., Shi, Y.. Comparing inertia weights and con-striction factors in particle swarm optimization. In:Proceedings of the Evolutionary Computation; vol. 1. 2000, p. 84–88. 54. Padhye, N., Deb, K., Mittal, P.. Boundary handling approaches
in particle swarm optimization. In:BIC-TA (1). 2012, p. 287– 298.
55. Gersho, A., Gray, R.M..Vector Quantization and Signal Com-pression. Dordrecht: Kluwer Academic Publishers; 1992. 56. Davies, D.L., Bouldin, D.W.. A cluster separation measure.
IEEE Transactions on Pattern Analysis and Machine Intelli-gence1979;PAMI-1(2):224–227.
57. Izakian, H., Pedrycz, W.. Agreement-based fuzzy c-means for clustering data with blocks of features. Neurocomputing2014; 127:266–280.
58. Wu, S.X., Banzhaf, W.. The use of computational intelligence in intrusion detection systems: A review. Journal of Applied Soft Computing2010;10:1–35.
59. Chimphlee, W., Abdullah, A.H., Chimphlee, S., Srinoy, S.. Unsupervised clustering methods for identifying rare events in anomaly detection. In:6th international Enformatika Confer-ence. 2005, p. 26–28.
60. tao He, H., nan Luo, X., lu Liu, B.. Detecting anomalous network traffic with combined fuzzy-based approaches. In: In-ternational Conference on Intelligent Computing (ICIC). 2005, p. 433–442.
61. Karami, A..Utilization and Comparison of Multi Attribute De-cision Making Techniques to Rank Bayesian Network Options. master thesis; University of Sk¨ovde; Sk¨ovde, Sweden; 2011. 62. Karami, A., Johansson, R.. Utilization of multi attribute
deci-sion making techniques to integrate automatic and manual rank-ing of options.Journal of Information Science and Engineering 2014;30(2):519–534.
63. Verma, J.P..Data Analysis in Management with SPSS Software; chap. 10. Springer; 2013, .
64. Asuncion, A., Newman, D.. UCI ma-chine learning repository. 2007. URL http://www.ics.uci.edu/∼mlearn/MLRepository.html. 65. Lee, W., Stolfo, S.J.. A framework for constructing features
and models for intrusion detection systems. ACM transactions on Information and system security (TiSSEC)2000;3(4):227– 261.
66. M¨unz, G., Li, S., Carle, G.. Traffic anomaly detection using k-means clustering. In:Proceeding of performance, reliability and dependability evaluation of communication networks and distributed systems, 4 GI/ITG Workshop MMBnet. Hamburg, Germany; 2007, .
67. Bradley, A.. The use of the area under the roc curve in the evaluation of machine learning algorithms.Pattern Recognition 1997;30(7):1145–1159.