2994
AN EVOLUTIONARY APPROACH FOR SOFTWARE
DEFECT PREDICTION ON HIGH DIMENSIONAL DATA
USING SUBSPACE CLUSTERING AND MACHINE
LEARNING
1SUMANGALA PATIL, 2A.NAGARAJA RAO, 3C. SHOBA BINDU
1Research Scholar, JNTUA, Anantapuram; India 2HOD, CSE, SJT, Vellore Institute of Technology; India
3Professor, JNTUA, Anantapuram; India
Email Id: 1[email protected], 2[email protected], 3[email protected]
ABSTRACT
Since last decade, due to increasing demand, huge amount of software is being developed, whereas the data intensive applications have also increased the complexity in these types of systems. Also, during the development process, software bugs may severely impact the growth of industries. Hence, the development of bug free software application is highly recommended in the real-time systems. Several approaches have been developed recently that are based on the manual inspection but those techniques are not recommended for huge software development scenario due to maximum chances of error during manual inspection. Thus, machine learning based data mining techniques has gained huge attraction from researchers due to their analyzing and efficiently detect the defect by learning the different attributes. In this work, we present machine learning based approach for software defect prediction. However, software defect datasets suffer from the high dimensionality issues, thus we present a novel subspace clustering approach using evolutionary computation based optimal solution identification for dimension reduction. Later, Support Vector Machine Classification scheme is implemented to obtain the defect prediction performance. Proposed approach is implemented using MATLAB simulation tool by considering NASA software defect dataset. A comparative study is presented which shows that proposed approach achieves better performance when compared with the existing techniques.
Keywords: Software Defect Prediction, Evolutionary Computation, Subspace Clustering, High
Dimensional Data, Machine Learning
1. INTRODUCTION
Recently, a tremendous growth has been noticed into technological growth which includes software and hardware related applications. Due to increased use of software based application, it has become an interesting research area. Nowadays, several real-time applications are highly dependent on the software based systems. The growth of software application related industries depends on the software quality which affects the overall revenue of the industry. According to a study presented in [1], $3.8 trillion of total amount is being spent on the software development in 2014. Another study [2] revealed that 23% of this cost is spent only on the testing and quality assurance of the software. Software reliability is a main aspect for various applications such as military applications, authors in [3] proclaimed that U.S. defense department
spends around $4 billion every year for software quality maintenance. These real-time application studies show the significance of the software quality assurance and maintenance. However, these bugs can be fixed after development of the complete software module but is not considered as efficient solution because it causes 100 times extra cost than bug fixing during the development [4].
2995 for real-time application systems. On the other hand, automated testing is a computer application based process where classification or learning algorithms are implemented to identify the defects in the software module [5]. This complete process of software bug/fault identification is known as software defect prediction (SDP).
As discussed before, Automated Software defect prediction techniques are based on the learning mechanism in the software engineering field. Automated software defect techniques are widely adopted when budget is limited and software module is very huge which cannot be tested comprehensively. Moreover, this helps software engineer to focus on the defective part of the software to improve the efficiency. Several machine learning approaches have been presented for development of SDP model such as Naïve Bayes [6-7], Neural network [8], random forest [9], Convolutional Neural Network [10], Support vector machine (SVM) [11] and decision tree classifier [12]. Arar et al. [7] mentioned the effectiveness of Naïve Bayes algorithm and proclaimed that Naïve Bayes approach is a probabilistic model for classification where features are independent and weight of each attribute is equally important however interrelated feature dependency may decrease the performance hence authors [7] developed feature dependent Naïve Bayes classifier model. In [8], authors developed software fault prediction based approach using neural network. In order to improve the robustness of the system Artificial Bee Colony (ABC) algorithm is also introduced. In this approach, optimal neural network weights are computed using ABC which helps to reduce the error rates in the training. Similarly, in [10] defect prediction scheme is developed using convolutional neural network where deep learning scheme is used for feature generation. In this work, token vectors are generated which are encoded with the help of word embedding and mapping and later convolutional neural network is applied for feature learning. In [11], authors discussed that several classification techniques have been employed for software defect prediction such as Decision tree, k-NN, Naïve Bayes etc. These approaches suffer from the class imbalance issue which degrades the performance of classification of software bugs. In order to deal with this issue authors presented unbiased SVM scheme which is capable to handle the data imbalanced problem. Recently, several researches have been presented which uses ensemble learning methods for software defect prediction and classification of faulty models. However, these schemes suffer from
the issue of generalization of large size software and these methods lead towards the degraded performance which is affected due to data quality such as curse of dimensionality [13], biased data [14] and class imbalance.
1.1 Motivation
Nowadays, the demand of software based applications is increasing rapidly. Along with this increasing demand, the real-time systems are becoming more complex and unpredictable due to sophisticated customer requirements. Due to these complexities, conventional software development techniques may suffer from various issues resulting in faulty module development. Hence, to deal with current complexities in the software development industries, dynamic adaption of conditions is required where dynamic code synthesis can be developed which is used for generating the modules according to the operating conditions and can perform the desired task. These issues can be addressed by using software defect prediction techniques due to their robust classification performance using machine learning schemes. Literature review shows that several schemes have been introduced for SDP but achieving the desired accuracy is still considered as a challenging task. The conventional techniques are based on the machine learning, statistical methods, parametric techniques and hybrid techniques which make use of several parameters for classification. These techniques still suffer from the class imbalance problem where training data samples are considered as majority which are non-defective and less samples are considered for defective datasets. This issue of class imbalance may cause performance degradation on the minority classes [15]. Several studies have been introduced to overcome this issue but still it is considered as a challenging task for real-time software defect prediction applications. Moreover, in software defect data, there is no specific relationship between attributes and fault hence it becomes more challenging issue during processing that what are the features which have significant impact on the classification performance.
1.2 Work Contribution
2996 optimized solution. Later, SVM classification scheme is implemented to achieve the classification performance and finally, a comparative study is presented to shows the robust performance of proposed approach.
1.3 Paper Organization
The rest of article is organized as follows: section 2 presents a brief discussion about recent techniques about software defect prediction. Section 3 presents proposed solution for SDP to deal with class imbalance and dimensionality reduction problem. Experimental study using proposed approach is discussed in section 4. Finally, section 5 presents concluding remarks and future work.
2. RELATED WORKS
This section presents a brief discussion about recent techniques in this field of automated software defect prediction. Here, we discuss about several methods which are based on the concept of machine learning and other hybrid and statistical methods.
Several studies revealed that the ensemble learning schemes can be utilized for software defect prediction. based on these assumptions, Tong et al. [16] developed software defect prediction scheme using two-stage ensemble learning scheme. In this work authors focused on the deep learning schemes where deep feature representation scheme is implemented which is improved by incorporating the stacked denoising autoencoders (SDAEs) scheme to deal-with the class imbalance problem. The complete model uses autoencoders and ensemble learning schemes. In [9], authors developed ensemble learning based scheme for SDP focusing on the imbalanced problem where feature selection and ensemble learning schemes are combined to address the data imbalance and feature reduction. In another recent work, Wang et al. [17] focused on ensemble learning based scheme for software defect prediction. generally, the classification schemes make use of historical bug data from and analyze them to build a precise decision making process for software bug identification. In this filed, multiple kernel learning schemes has shown a significant improvement for learning by overcoming the class-imbalance issues. Hence, authors introduced a multiple kernel learning scheme for SDP. This approach is applied on the data which is obtained from the software metrics. In this multiple kernel ensemble learning approach, a weight vector is also introduced which
is used for reducing the cost of misclassification. Wang et al. [18] developed a novel approach for software reliability measurement with the help of software defect prediction techniques where various software metrics are used for identifying the software bugs by using machine learning approaches. Model selection is considered as a challenging task for SDP applications. Authors presented a defect prediction modelling based on the multi-metric space and multi-type learning methods with the help of ensemble learning schemes.
Chi-2997 square and relief are considered as FC-relevance measurement parameters.
In this field, dimensionality curse is also considered a challenging issue which can limit the performance of proposed approach. Several techniques have been introduced for efficient feature selection and dimensionality reduction in software defect prediction applications. Khoshgoftaar et al. [22] discussed that high-dimensionality and class imbalance problem are the two crucial parameters which affect the system performance. However, this issue can be resolved using feature selection process hence authors developed iterative feature selection process which uses data sampling to address the data imbalance issue and later feature selection is applied to address the high dimensionality issue and finally, feature ranking scheme is also implemented to aggregate the iterative features. The feature ranking process helps to derive the more balanced attributes which can provide the efficient feature model. With the help of similar approach, Bashir et al. [23] also discussed about the two well-known issues of SDP applications which are known as class imbalance and high dimensionality. In this work, authors presented a novel combined approach where feature selection is applied for high dimensionality reduction, data sampling is applied to overcome the class imbalance issue and iterative partition filtering scheme is applied to deal with the noisy data. In another study, Liu et al. [24] studied about the impact of noisy data on software defect prediction. Noisy data can cause the performance related issues due to inaccurate feature selection for processing. Noise threshold based schemes are presented in this field of feature selection but accuracy remained a tedious task. In order to address this issue, authors introduced FECS (FEature Clustering with Selection strategies). The complete methodology includes two phases as feature clustering and feature selection. Further, feature selection approach is divided into three heuristic search approaches. Chen et al. [25] suggested that feature selection is a most effective solution to deal with the high dimensionality. In order to deal with this issue, multi-objective optimization problem is formulated which is solved using a novel feature selection process. Based on optimization schemes,
[image:4.612.305.529.207.531.2]Anbu et al. [27] also developed firefly optimization based approach for optimal feature selection. In the next phase of work, several classification schemes are implemented such as support vector machine (SVM), Naïve Bayes (NB) as well as K-nearest neighbor (KNN) to evaluate and compare the performance of defect prediction using feature selection.
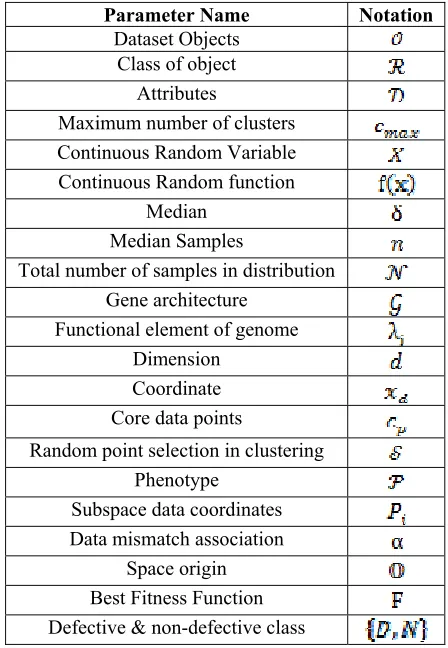
Table 1: Notations used in this work
Parameter Name Notation
Dataset Objects Class of object
Attributes
Maximum number of clusters Continuous Random Variable Continuous Random function
Median Median Samples
Total number of samples in distribution Gene architecture
Functional element of genome Dimension
Coordinate Core data points
Random point selection in clustering Phenotype
Subspace data coordinates Data mismatch association
Space origin Best Fitness Function Defective & non-defective class
3. PROPOSED MODEL
2998
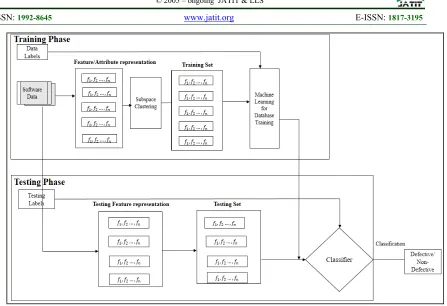
Figure 1. Proposed Model for SDP
Figure 1 shows the complete process of proposed approach of software defect prediction. this scheme is based on the machine learning technique. The complete process is divided into two main phases which are training and testing phase. According to the training phase, the complete software data base is analysed and proposed sub-space clustering algorithm is applied which provides the dimension reduced cluster set of the attributes. This reduced dimension is further used for feature extraction which helps to generate the training dataset. This training dataset is used for training the classifier based on the attributes. Similarly, in the other phase, we apply testing scheme where obtained features are processed and a testing set is created which is used further for classification. This classification is constructed using SVM classification scheme.
3.1. Subspace clustering
In previous section, we have described that several optimization and bio-inspired schemes are widely adopted in the SDP for feature selection of dimension reduction such as genetic algorithm as described in [27]. Moreover, clustering approaches are also widely adopted [19-21] but due to increased complexity in recent software applications, these techniques may not be able to adapt the real-time changes in the software and thus bug identification may not be obtained accurately.
However, both the techniques i.e. clustering and evolutionary computations have shown a significant improvement but dynamic adaption and evolution is highly recommended to further enhance the performance of defect prediction systems.
Let us consider that a dataset contains total objects as where each object is provided by a unique class which is described as by total attributes. Total number of sample objects are identified by taking the size of where denotes the number of attributes or dimensionality of the dataset. The proposed approach requires two inputs as the dataset and the maximum number of clusters and provides a subspace clustered model using different cluster which contains set of objects with the corresponding dimensions. According to the proposed approach, we normalize the data for further processing. Let us consider that is a continuous random variable whose density function is given as and median . The standard deviation of median samples can be computed as
2999 distribution as which is given as , the density function of this is given as
, here we assume that mean and median of the computed distribution are
similar hence it can be simplified as
and . Hence each value of the dataset can be replaced by the obtained median values. After applying this process, the complete data is normalized to the unitary standard deviation with a zero mean.
The proposed clustering scheme uses centroid based subspace modeling which helps to map the complete the multi-dimensional data to the number of classes while improving the original class structure [30].
3.1.1 Gene Structure and evolutionary model
for subspace clustering
In this work, we make use of evolutionary computation and subspace clustering for dimension reduction for software defect prediction application. The gene architecture is formulated using the multiple tuples as where tuples are in the form as where denotes the functional tuple value of gene
and and remaining tuple values are used for defining the phenotype as: , and denotes the normalized sample value which is ranging from
to .
In the next phase, we consider the phenotype model which is used in subspace clustering or grouping the specific core-point data. These number of core points cannot exceed from the total number of desired clusters . Each core data point can be identified as and can be represented as . Let us consider that is the coordinate of the core data point for the given dimension , then can be defined as the all values which are present in the tuple in the form as in the considered gene structure . Thus, at this stage, subspace can be defined as the total dimensions which are contributing to in , it can be expressed as
. However, the non-functional elements of do not participate in the phenotype modeling.
From this assumption, we estimate that the for a given dataset , a subspace clustering of is defined by associating each object of to the best matching core-point in . Finally, a non-empty set of objects which is associated to the core data point formulates a cluster in subspace . According to the evolutionary computation scheme, new gene solutions are generated by applying mutation operation which can be applied using global and point mutation mechanism this is general task which is performed during the evolutionary computation phase which does not require any specific criteria by means of subspace clustering. For any gene structure, the point mutation can be described where is in the form of which denotes a uniformly drawn gene model. according to the point mutation model the element of considered tuple is denoted by replaced with a new random variable in the corresponding range. This can be expressed as:
Where denotes the random selection of the considered element set and are selected as uniformly. In order to obtain the rearranged structure of gene , the tuple is considered to be at the adjacent to the tuple which represents a circular representation of genes. With the help of this, the possible rearrangements of the genes can be expressed as:
3000
3.1.2 Fitness function computation
In this section we present fitness function computation for estimating the quality of subspace clustering for the given dataset phenotype . In order to measure the quality, we apply distance measurement based computation which is used for finding the nearest core data point for group formulation from the . If the dimensionality is increasing in the data, then the distance also increases which become a challenging task to obtain the accurate clustering model this effect is called concertation effect which may lead towards the degraded performance of the system. In order to overcome this issue, Manhattan distance is considered as an effective solution which can be helpful for finding the distance with different number of dimensions. Let us consider that and are the two coordinate points in the given subspace vector over a given dimension set , and denotes the coordinates in the dimension of . With the help of these parameters, the distance can be computed as:
(
This distance measurement is used here to identify the mismatch function as core data points in the space to a core point in the subspace . The higher value of
denotes the poor association of data to . This mismatch identification function can be expressed as:
Where denotes the total size of subspace which is associated to the core point ,
denotes the remaining dimensions, is the space origin.
Let is the subset of data which are associated to the , if is not empty vector and the core data point defines a cluster as
otherwise do not define any cluster. In order to find the best fit solution for the grouping, we compute the fitness function which is given as:
With the help of this fitness function, we obtain a clustered/ grouped model which can be used for dimensionality reduction. The obtained fitness function is used for minimizing the error during clustering process. This error minimization model helps to improve the clustering which contains the similar data hence the data clusters are reduced resulting in dimension reduction of the data. The final obtained data can be used for classification study as discussed in next subsection.
3.1 SVM (Support Vector Machine)
classification
4. EXPERIMENTAL STUDY
This section provides a complete experimental study of proposed neural network based combinatorial testing model. Performance of proposed approach is measured in terms of coverage, domain size and total number of parameters. Complete experimental study is carried out using windows 7 operating system with 1.8 GHz central processing unit with 8GB RAM memory.
According to the experimental study, the initial parameter is fixed to 15 with domain size 4 with a varied from 3 to 6. In this process, experimental results are presented in table 5 where test size ratio, time ratio, size and time parameters are considered for analysis. Proposed model is compared with the conventional IPOG algorithm as depicted in table.
Table 5: Comparative analysis
IPOG
Approach Neuro-IPOG Time and size ratio analysis
t-way Time Size Time Size Time
Ratio RatioSize 3 0.561 181 0.16 204 0.29 1.12 4 16.587 924 0.77 1056 0.046 1.14 5 230.22 4519 11.10 6785 0.048 1.50 6 2152.11 20384 310.26 32543 0.144 1.59
3001 on the time and size ratio analysis. This analysis is carried out for 3 to 6 way testing. Proposed Neuro-IPOG shows improved performance when compared with IPOG. As discussed in previous section, we have considered an experiment where t
[image:8.612.311.524.70.272.2]-way study is presented. Based on this analysis, total number of combination graphical representation is given in figure 3.
Figure 3: Combinations and Coverage
In this figure 3, combinations and coverage are measured for varied number of testing. This analysis shows that 50% combinations are capable to obtain the 100% coverage using two-way testing. Similarly, 3-way testing require 35 combinations for 60% coverage.
Figure.4: % coverage vs t-way
Similarly, figure 4 presents a comparative analysis by considering varied number of testing. In this analysis, t-ways are varied from 2-way testing to
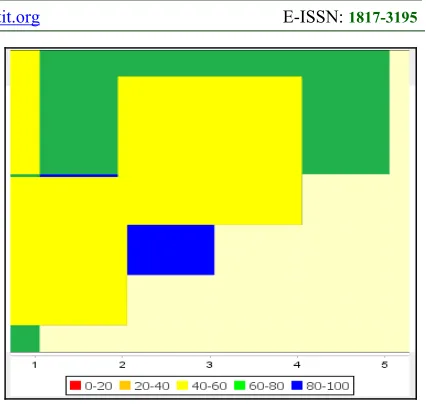
[image:8.612.91.299.192.353.2]6-way testing and corresponding to this percentage coverage is computed. Study shows that 2-way testing obtains more testing coverage when compared with other testing. Figure 5 represents the coverage heat map.
Figure 5: Coverage Heat map
5. CONCLUSION
In this article we have presented a novel approach for two-way testing using neural network model to improve the testing coverage. According to this work, first of all IPOG test case generation strategy is implemented for two-way test case and total coverage is measured. In next phase, neural network model is implemented where hidden layers contain input parameters and output is obtained in terms of best missing test case which can enhance the overall coverage of the system. Based on this approach, an extensive experimental study is presented for two-way testing and further IPOG experiments are also depicted for 6-way testing. From this study it is concluded that proposed approach can be used for improving the coverage for two-way testing.
REFERENCES
[1]Ahmed, J., Siyal, M.Y., Najam, S. and Najam, Z., 2017. Challenges and Issues in Modern Computer Architectures. In Fuzzy Logic Based Power-Efficient Real-Time Multi-Core System (pp. 23-29). Springer Singapore.
[2]Clegg, B.S., Rojas, J.M. and Fraser, G., 2017, May. Teaching software testing concepts using a mutation testing game. In Proceedings of the 39th International Conference on Software Engineering: Software Engineering and Education Track (pp. 33-36). IEEE Press. [3]Jiang, M., Chen, T.Y., Kuo, F.C., Towey, D. and
[image:8.612.89.301.449.623.2]3002 [4]Pandey, A. and Banerjee, S., 2017. Bio-Inspired
Computational Intelligence and Its Application to Software Testing. In Handbook of Research on Soft Computing and Nature-Inspired Algorithms (pp. 429-444). IGI Global.
[5]Lopez-Herrejon, R.E., Javier Ferrer, J., Chicano, F., Haslinger, E.N., Egyed, A. and Alba, E., 2014, July. A parallel evolutionary algorithm for prioritized pairwise testing of software product lines. In Proceedings of the 2014 Annual Conference on Genetic and Evolutionary Computation (pp. 1255-1262). ACM.
[6]D. R. Kuhn, D. R. Wallace and A. M. Gallo, "Software fault interactions and implications for software testing," in IEEE Transactions on Software Engineering, vol. 30, no. 6, pp. 418-421, June 2004.
[7]Zhang, Z., Yan, J., Zhao, Y. and Zhang, J., 2014. Generating combinatorial test suite using combinatorial optimization. Journal of Systems and Software, 98, pp.191-207.
[8]Ziegel, E.R., 2003. Experimental design for combinatorial and high throughput materials development.
[9]Kampel, L., Garn, B. and Simos, D.E., 2017, March. Combinatorial Methods for Modelling Composed Software Systems. In Software Testing, Verification and Validation Workshops (ICSTW), 2017 IEEE International Conference on (pp. 229-238). IEEE.
[10]J. Petke, M. B. Cohen, M. Harman and S. Yoo, "Practical Combinatorial Interaction Testing: Empirical Findings on Efficiency and Early Fault Detection," in IEEE Transactions on Software Engineering, vol. 41, no. 9, pp. 901-924, Sept. 1 2015.
[11]S. Vilkomir and B. Amstutz, "Using Combinatorial Approaches for Testing Mobile Applications," 2014 IEEE Seventh International Conference on Software Testing, Verification and Validation Workshops, Cleveland, OH, 2014, pp. 78-83.
[12]Younis, M.I. and Zamli, K.Z., 2010. MC-MIPOG: A parallel t-way test generation strategy for multicore systems. ETRI journal, 32(1), pp.73-83.
[13]R. Huang, X. Xie, T. Y. Chen and Y. Lu, "Adaptive Random Test Case Generation for Combinatorial Testing," 2012 IEEE 36th Annual Computer Software and Applications Conference, Izmir, 2012, pp. 52-61.
[14]M. N. Borazjany, L. S. Ghandehari, Y. Lei, R. Kacker and R. Kuhn, "An Input Space Modeling Methodology for Combinatorial
Testing," 2013 IEEE Sixth International Conference on Software Testing, Verification and Validation Workshops, Luxembourg, 2013, pp. 372-381.
[15]Lei, Y., Kacker, R., Kuhn, D.R., Okun, V. and Lawrence, J., 2007, March. IPOG: A general strategy for t-way software testing. In Engineering of Computer-Based Systems, 2007. ECBS'07. 14th Annual IEEE International Conference and Workshops on the (pp. 549-556). IEEE.