IJPSR (2012), Vol. 3, Issue 10 (Research Article)
Received on 01 June, 2012; received in revised form 10 July, 2012; accepted 19 September, 2012
VALIDATED HPTLC METHOD FOR ESTIMATION OF CURCUMIN CONTENT IN DIETARY SUPPLEMENT FORMULATION
V.A. Kekre* and S.G. Walode
Department of Pharmaceutical Chemistry, Sinhgad Institute of Pharmaceutical Sciences, Off Mumbai - Pune Express way Kusgaon (B.K), Lonavala-410401, Maharashtra, India
ABSTRACT
The simple, accurate and precise HPTLC method was developed for quantification of curcumin content in dietary supplement formulation. In this method, individual curcuminoids (curcumin, demethoxy curcumin and bisdemethoxy curcumin) with piperine were resolved using mobile phase n-hexane: ethyl acetate: methanol: formic acid (8: 2: 1: 2-3 drops v/v) on a plate precoated with silica gel 60 F254 and quantified densitometrically in
absorbance mode at 421 nm. The Rf value of curcumin was found to be 0.29.
Linearity for curcumin was established between concentration range of 100-180 ng/spot with correlation coefficient of 0.999. The method was further validated as per ICH guidelines. The LOD and LOQ values for curcumin were found to be 27.3 ng and 82.7 ng respectively. The results of percent recovery and repeatability studies with standard deviation (≤2%), concluded that the developed method was accurate and precise and can be used for routine analysis of curcumin in dietary supplement formulations.
INTRODUCTION: Curcumin, [1,7-bis (4-hydroxy-3-methoxyphenyl)-1, 6- heptadiene-3, 5-dione] is the major yellow pigment extracted from turmeric, a commonly used spice, derived from the rhizome of Curcuma longa Linn1. It is a product obtained by solvent extraction of turmeric i.e., the ground rhizomes
of Curcuma longa L.(Curcuma domestica Valeton) and
purification of the extract by crystallization.
Curcumin along with demethoxycurcumin and bis-demethoxycurcumin are the three major pharmacologically important curcuminoids that have been isolated from C. longa and have been shown to possess anti-oxidant, anti-inflammatory,
anti-To increase bioavailability of curcumin in human body most companies in the current scenario are manufacturing curcumin based dietary supplements with piperine as an important ingredient 2. Literature survey has revealed few HPTLC methods for estimation of curcuminoids in, different parts of C.longa plant 3, in turmeric powder 4, for simultaneous estimation of curcumin and piperine 5.
Keywords: Curcuminoids,
Curcumin, High Performance Thin Layer
Chromatography, Densitometric analysis
Correspondence to Author:
V.A. Kekre
Department of Pharmaceutical Chemistry, Sinhgad Institute of Pharmaceutical Sciences, Off Mumbai - Pune Express way Kusgaon (B.K), Lonavala-410401, Maharashtra, India
E-mail: [email protected]
QUICK RESPONSE CODE
IJPSR:
Other analytical techniques have also been employed for estimation of curcuminoids like TLC 6, capillary electrophoresis 7, microemulsion electrokinetic chromatography 8, HPLC 9, 10 but no method was found to be reported for estimation of the curcumin in a dietary supplement formulation in presence of other curcuminoids and piperine (Figure 1).
MATERIALS AND METHOD:
Year of experimentation: 2012
Site of experimentation: Anchrome private limited, Mulund (E), Mumbai (India)
Chemicals and reagents: Standard curcumin was purchased from Loba Chemicals, Pune. Other solvents and reagents used were of E-merck and of analytical grade.
Preparation of Standard Stock Solution: A standard stock solution of curcumin was freshly prepared by dissolving 10 mg of standard curcumin in 10 ml of methanol. Appropriate dilutions of this standard stock solution were made to get the final concentration equal to10 μg/ml.
Instrumentation: A Camag HPTLC system (Muttens, Switzerland) comprising of Camag Linomate V semiautomatic sample applicator, Hamilton syringe (100 μl), Camang TLC scanner 3, Camang WinCATS software, Camang twin trough chamber (10 x 10 and 20 x 10) and ultrasonicator was used during the study. Precoated silica gel aluminium plates 60 F 254, (10 cm ×
10 cm) with 250 μm thickness (E. Merck, Mumbai, India) were used as stationary phase.
Chromatographic conditions: Stationary phase: Precoated silica gel on aluminium plate 60 F 254, (10 cm
×10 cm, prewashed by methanol and activated at 60° C for 5 min prior to chromatography).
Mobile Phase: n-hexane: ethyl acetate: methanol: formic acid in the ratio of 8:2:1:2-3 drops, (v/v/v/v), for resolving curcuminoids.
Quantity of Mobile phase: 12 ml
TLC Chamber saturation Time: 20 min at room temperature (30 ± 1° C) and
Relative Humidity: 60 % ± 5
Application rate: 150nl/s
Scanner band width: 8 mm
Space between two bands: 10 mm
Slit dimension: 6 mm x 0.30 mm
Scanning speed: 20 mm/s
Detection: Densitometrically using a UV detector at 421nm.
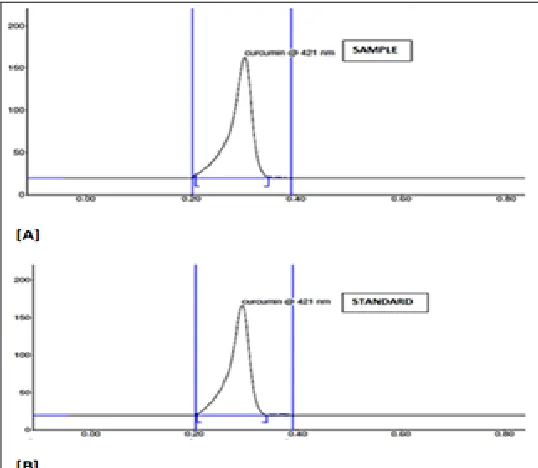
FIGURE 2: REPRESENTATION OF A CHROMATOGRAM SHOWING
PEAKS OF (A) CURCUMIN (Rf 0.29) IN DIETARY FORMULATION
AND (B) CURCUMIN STANDARD (Rf 0.29).
Validation parameters: The method has been validated as per ICH guidelines 11.
[image:3.612.312.591.146.242.2]Linearity: For establishing linearity different volumes 10, 12, 14, 16 and 18 μl of standard stock solution were applied on precoated TLC plates to get concentration in range of (100-180 ng/ spot) curcumin. The plates were then developed in the CAMAG twin through chamber and scanned densitometrically at 421nm (Table 1, Figure 3).
Table 1: Linearity for curcumin
Sr. No. Volume/spot
(μl)
concentration/spot
(ng) Observed Area
1. 10 100 4704.75
2. 12 120 5445.22
3. 14 140 6147.70
4. 16 160 7046.49
5. 18 180 7728.08
Precision: Precision of analytical method was expressed in terms of % RSD. Repeatability was performed by sample application and measurement of peak areas of six replicates of same concentration 120 ng/spot of curcumin (Table 2).
TABLE 2: PRECISION STUDY (REPEATABILITY) FOR CURCUMIN
Sr. No. Volume/spot
(µl) Observedarea Meanarea % RSD
1. 12 5760.22
5601.90 1.417
2. 12 5545.30
3. 12 5566.88
4. 12 5561.20
5. 12 5589.15
6. 12 5588.66
LOD and LOQ: Limit of detection and limit of quantitation were determined based on the standard deviation of the response and the slope as per the ICH guidelines. They were calculated based on the following formulas:
LOD = 3.3 sigma/slope LOQ = 10 sigma/ slope
Sigma = Standard deviation of the response. Slope = Slope of the calibration curve.
[image:3.612.28.581.483.738.2]Recovery studies: Accuracy of the proposed method was ascertained on the basis of recovery studies performed by standard addition method at different levels corresponding to 80%, 100% and 120% of the
[image:4.612.67.547.361.616.2]label claim. A known amount of curcumin was added to preanalysed tablet powder which was then mixed, extracted and analysed at standard optimized chromatographic condition (Table 3).
TABLE 3: RECOVERY STUDIES OF CURCUMIN Sr.
No. %levels
Volume/spot (µl)
Observed area Mean %Recovery±SD % CV
Sample Standard
1. 80 1 2.4 2542.3
2. 80 1 2.4 2431.7 110 ± 0.45 1.054
3. 80 1 2.4 2521.6
4. 100 1 3.0 2689.3
5. 100 1 3.0 2586.6 107 ± 0.91 2.00
6. 100 1 3.0 2595,1
7. 120 1 3.6 2863.5
8. 120 1 3.6 2830.3 103 ± 0.61 1.185
9. 120 1 3.6 2876.2
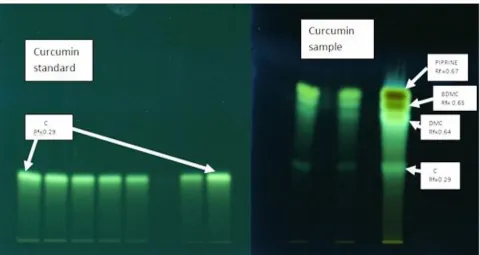
RESULTS AND DISCUSSION: A variety of individual solvent and solvent mixtures in various compositions were tried. A mobile phase containing n-hexane: ethyl acetate: methanol: formic acid (8:2:1:2-3 drops v/v) was found to be most suitable for better resolution of
curcumin with Rf value of 0.29 (Figure 5). Linearity was
established by least square linear regression analysis of the calibration spot. Curcumin showed good linear response in concentration range 100-180 ng/spot with correlation coefficient of 0.999.
FIGURE 5: PHOTO DOCUMENTATION OF CURCUMINOIDS AND ITS CORRELATION WITH STANDARD CURCUMIN
LOD and LOQ of the developed method was found to be 27.3 ng and 82.7 ng respectively, which indicates sensitivity of the method. Low % RSD (1.417) obtained by comparing results of peak area of curcumin for repeatability, suggested an excellent precision of the developed method. Method was found to be specific and didn’t show any undue interference of diluents
CONCLUSION: The developed HPTLC method is accurate, precise, specific and low cost. Statistical analysis proves that the method is reproducible and selective and can be applied for routine analysis of curcumin in dietary supplement formulations.
ACKNOWLEDGMENTS: Authors are thankful to Anchrom Pvt. Ltd, Mulund, (Mumbai), INDIA for providing there vital guidance and HPTLC instrumentation facility. Authors are also grateful to Dr S. B. Bhise Principle, Sinhgad Institute of Pharmaceutical Sciences, Lonavala, for his encouragement and constant support. It is author’s immense pleasure to acknowledge Mr. Rahul Sabnis, for his sincere efforts of providing the dietary supplement formulation from the U.S market for analysis.
REFERENCES:
1. Heath DD, Pruitt MA, Brenner DE, Begum AN, Frautschy SA, Rock CL: Tetrahydro curcumin in plasma and urine: quantitation by high performance liquid chromatography. J. Chromatogr. B 2005; 824: 206-212.
2. Anand P, Kunnuakkara AB, Newman RA, Aggarwal BB: Bioavailability of curcumin: problems and promises. Mol. Pharmaceutics 2009; 4(6): 807-818.
3. Paramasivam M, Aktar MW, Poi R, Banerjee H, Bandyopadhyay A: Occurrence of curcuminoids in curcuma longa: a quality
standardization by HPTLC. Bangladesh J Pharmacol 2008; 3: 55-58.
4. Gantait A, Barman T, Mukherjee PK: Validated method for estimation of curcumin in turmeric powder. Indian J Traditional Knowledge 2011; 10(2): 247-250.
5. Vyas N, Gamit K, Khan MY, Panchal S, Pudarikakshudu K: Simultaneous estimation of curcumin and piperine in there crude powder mixture and ayurvedic formulation using High Performance Thin Layer Chromatography. Int. Journ. of Research in Pharmaceutical and Biomedical Sciences 2011; 2(1): 231-236.
6. Tonnesen HH, Grislingaas AL, Karlsen J: Studies on curcumin and curcuminoids: evaluation of Thin Layer Chromatography as mentioned for quantification of curcumin and curcuminoids. Z lebensm unters forsch 1991; 193: 548-550.
7. Lechtenberg M, Quandt B, Nahrstedt A: Quantitative determination of curcuminoids in curcuma rhizome and rapid differentiation of Curcuma domestica val. and curcuma xanthrrhiza by capillary electrophoresis. Phyto. Anal. 2004; 15: 152-158.
8. Jiangtt H, Somogyi A, Jacobsen NE, Timmermann BN, Gang DR: Analysis of curcuminoids by positive and negative electronspray ionization and tandem mass spectrometry. Mass spectrom 2006; 20: 1001-12.
9. Jayaprakasha GK, Jagan ML, Sakariah KK: Improved HPLC method for determination of curcumin, demethoxy curcumin and bis demethoxy curcumin. J. Agric. Foodchem 2002; 50: 3668-72.
10. Jadhav B.K, Mahadik K.R, Paradkar A.R: Development and validation of improved reversed phase-HPLC method for simultaneous determination of curcumin, demethoxy curcumin and bisdemethoxy curcumin. Chromatographia 2007; 65: 483-88.
11. Anonymous, Validation of analytical procedures: text and methodology Q2 (R1), ICH harmonised tripartite guideline, In:
ICH (Ed), November 2005.
How to cite this article: